


zabbix服务自定义监控
准备环境:
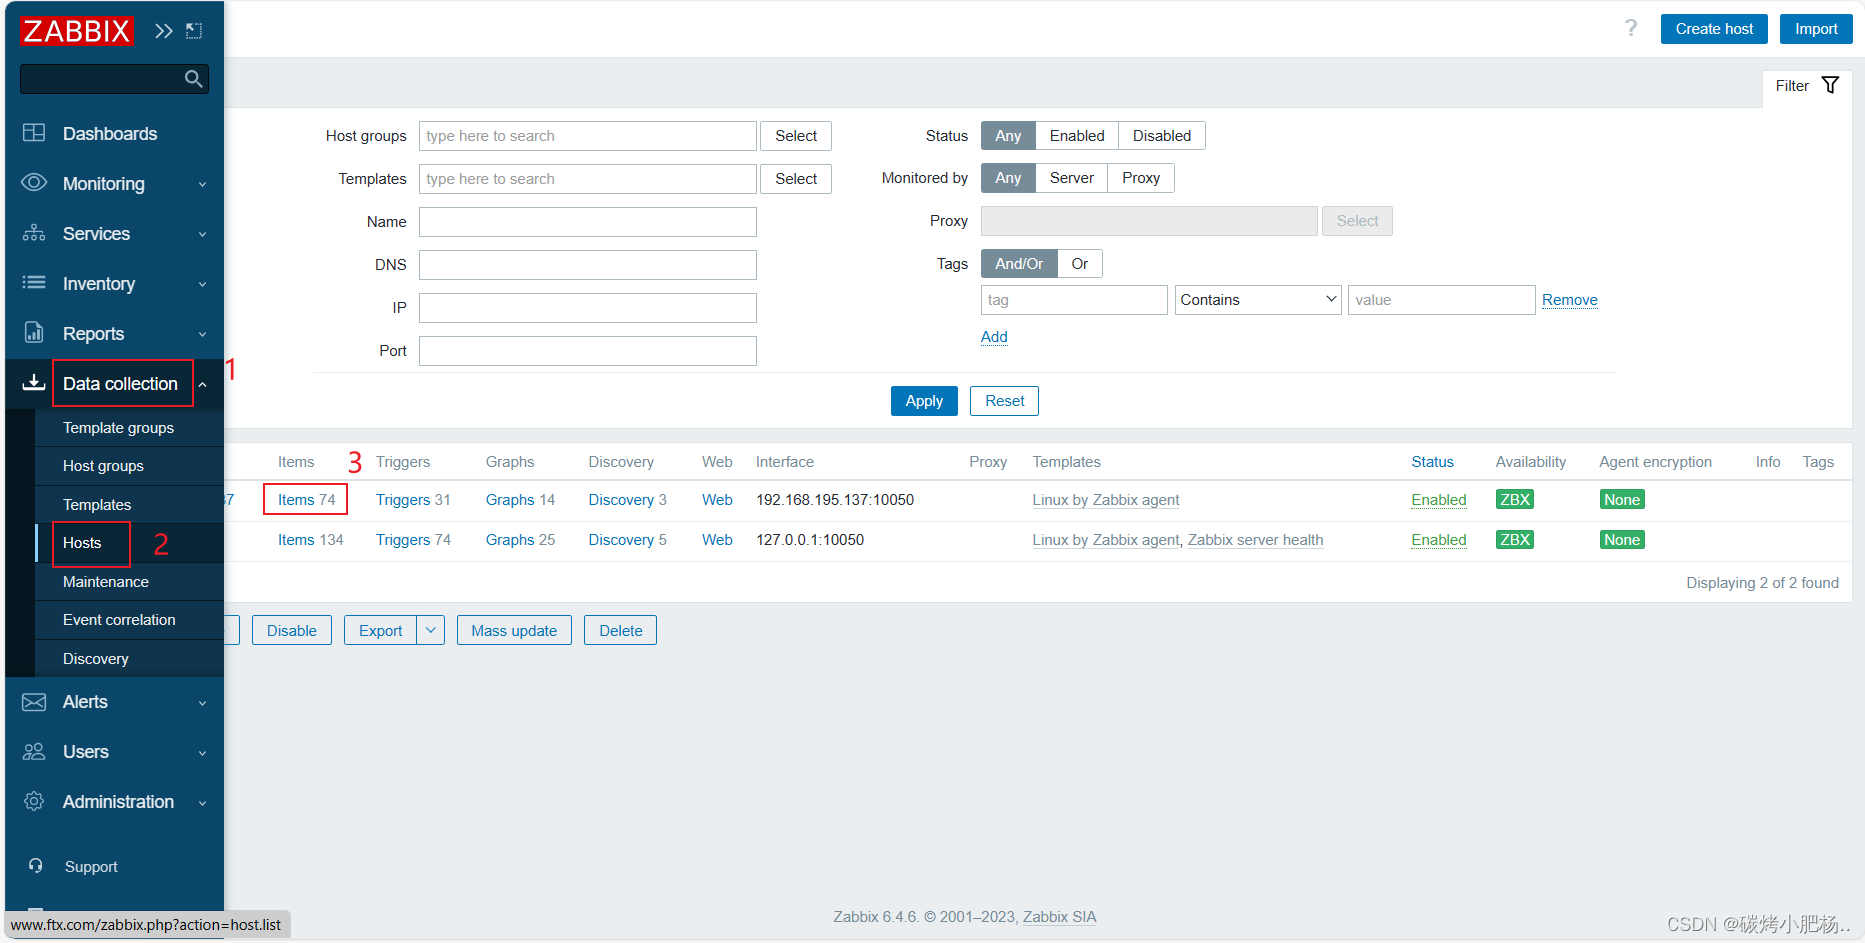
我们此次准备的被监控端主机为192.168.195.137(centos2)这台主机,监控主机为192.168.195.130(client)这台主机
** 注:我们的自定义监控得出内容是写在被监控主机的zabbix_agentd.conf这个配置文件中的,所以我们都是在被监控端进行配置**
1.自定义监控进程
1.1在被监控端开启自定义监控功能
[root@centos2 ~]# cd /usr/local/etc/
[root@centos2 etc]# ls
zabbix_agentd.conf  zabbix_agentd.conf.d
[root@centos2 etc]# vim zabbix_agentd.conf
[root@centos2 etc]# grep -A2 'UnsafeUserParameters=0' zabbix_agentd.conf
# UnsafeUserParameters=0
UnsafeUserParameters=1

//同时,配置文件中也告诉了我们使用自定义监控的格式,我们获取值的方式是通过脚本来实现的
[root@centos2 etc]# grep -A4 'Option: UserParameter$' zabbix_agentd.conf
### Option: UserParameter
#	User-defined parameter to monitor. There can be several user-defined parameters.
#	Format: UserParameter=<key>,<shell command>     //<key>则是我们在网页上加入监控项时的key
#	See 'zabbix_agentd' directory for examples.
1.2编辑一个脚本文件,用于获取服务的进程号(脚本默认放在同一个地方,此处我们创建一个专门用于放置脚本文件的目录,放置到/script,不要放在用户家目录下面,防止后续出现权限受限的问题)
[root@centos2 ~]# mkdir /script
[root@centos2 ~]# cd /script
//编辑脚本文件
[root@centos2 script]# vim showprocess.sh
[root@centos2 script]# cat showprocess.sh
#!/bin/bash
process=$(ps -ef | grep "$1" | grep -Ev "grep|$0" | wc -l)
if [ $process -eq 0 ];then //此处判断若过滤出来的服务的进程为0时,说明没有开启此服务,则输出1,说明处在问题,反之则说明有进程,则输出0,表示不存在问题
echo "1"
else
echo "0"
fi
//查看一下我们的服务端口,用几个服务做一下测试
[root@centos2 script]# ss -antl
State Recv-Q Send-Q Local Address:Port Peer Address:Port
LISTEN 0 128 0.0.0.0:22 0.0.0.0:*
LISTEN 0 100 127.0.0.1:25 0.0.0.0:*
LISTEN 0 128 0.0.0.0:10050 0.0.0.0:*
LISTEN 0 128 [::]:22 [::]:*
LISTEN 0 100 [::1]:25 [::]:*
[root@centos2 script]# ./showprocess.sh postfix //显示0,说明服务进程存在
0
[root@centos2 script]# ./showprocess.sh httpd //显示1,说明服务进程不存在
1
//进入配置文件,创建自定义监控任务
[root@centos2 etc]# vim zabbix_agentd.conf
[root@centos2 etc]# tail -1 zabbix_agentd.conf
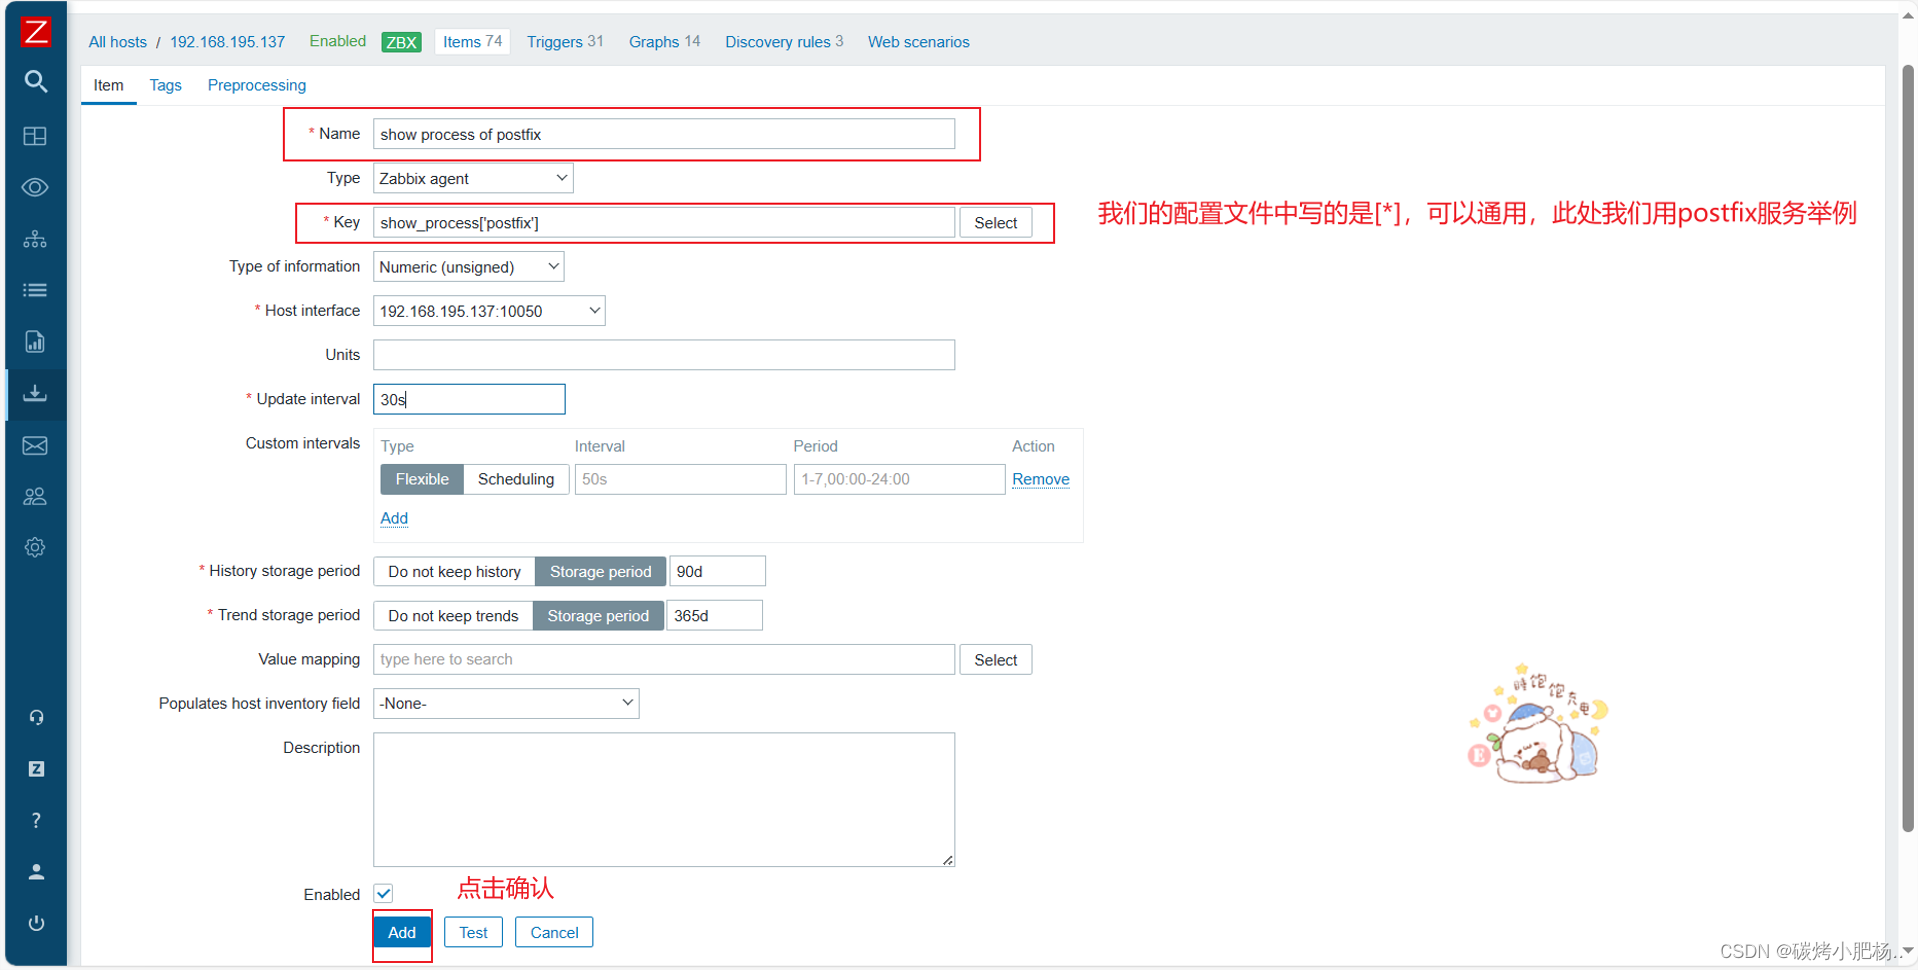
UserParameter=show_process[*],/bin/bash /script/showprocess.sh $1
//因为我们修改了配置文件,所以需要重启服务,重新读取配置文件内容
[root@centos2 etc]# systemctl restart zabbix_agentd.service
//创建自定义监控任务后,我们需要在server端去测试一下是否能接受到被监控端的值
[root@client ~]# zabbix_get -s 192.168.195.137 -k show_process['postfix']
0 //成功接收到值
主机上的配置完成
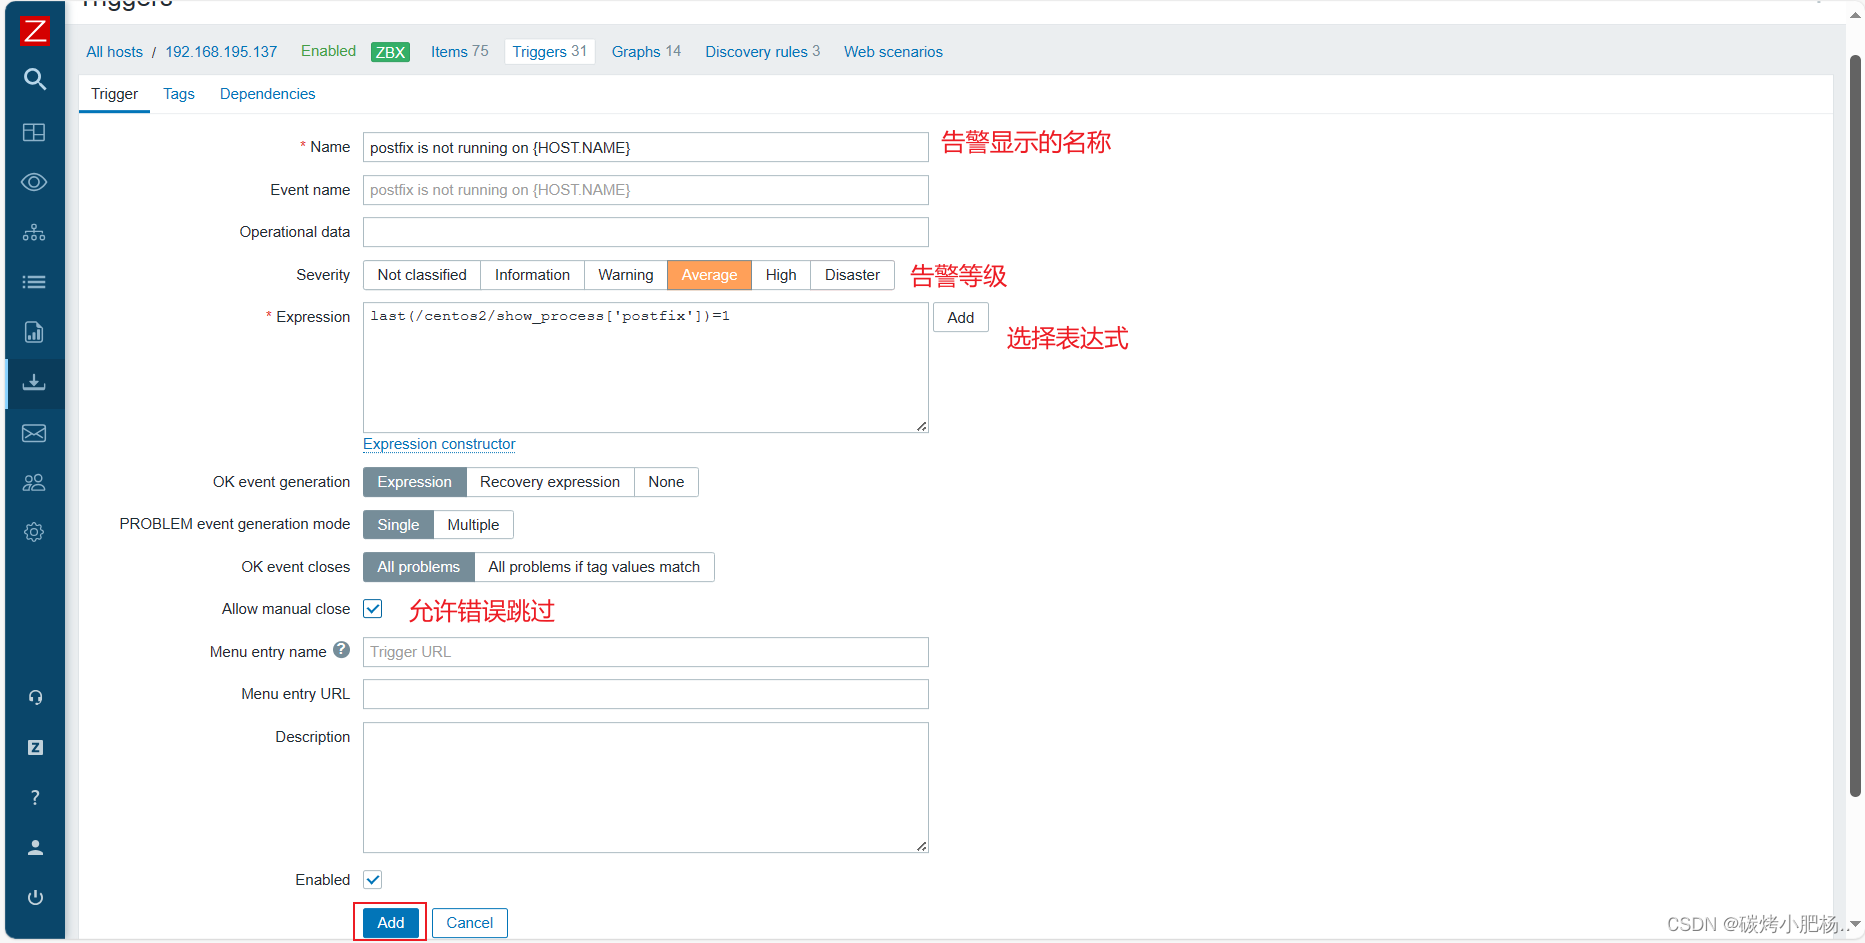
1.3为该脚本配置监控项、触发器
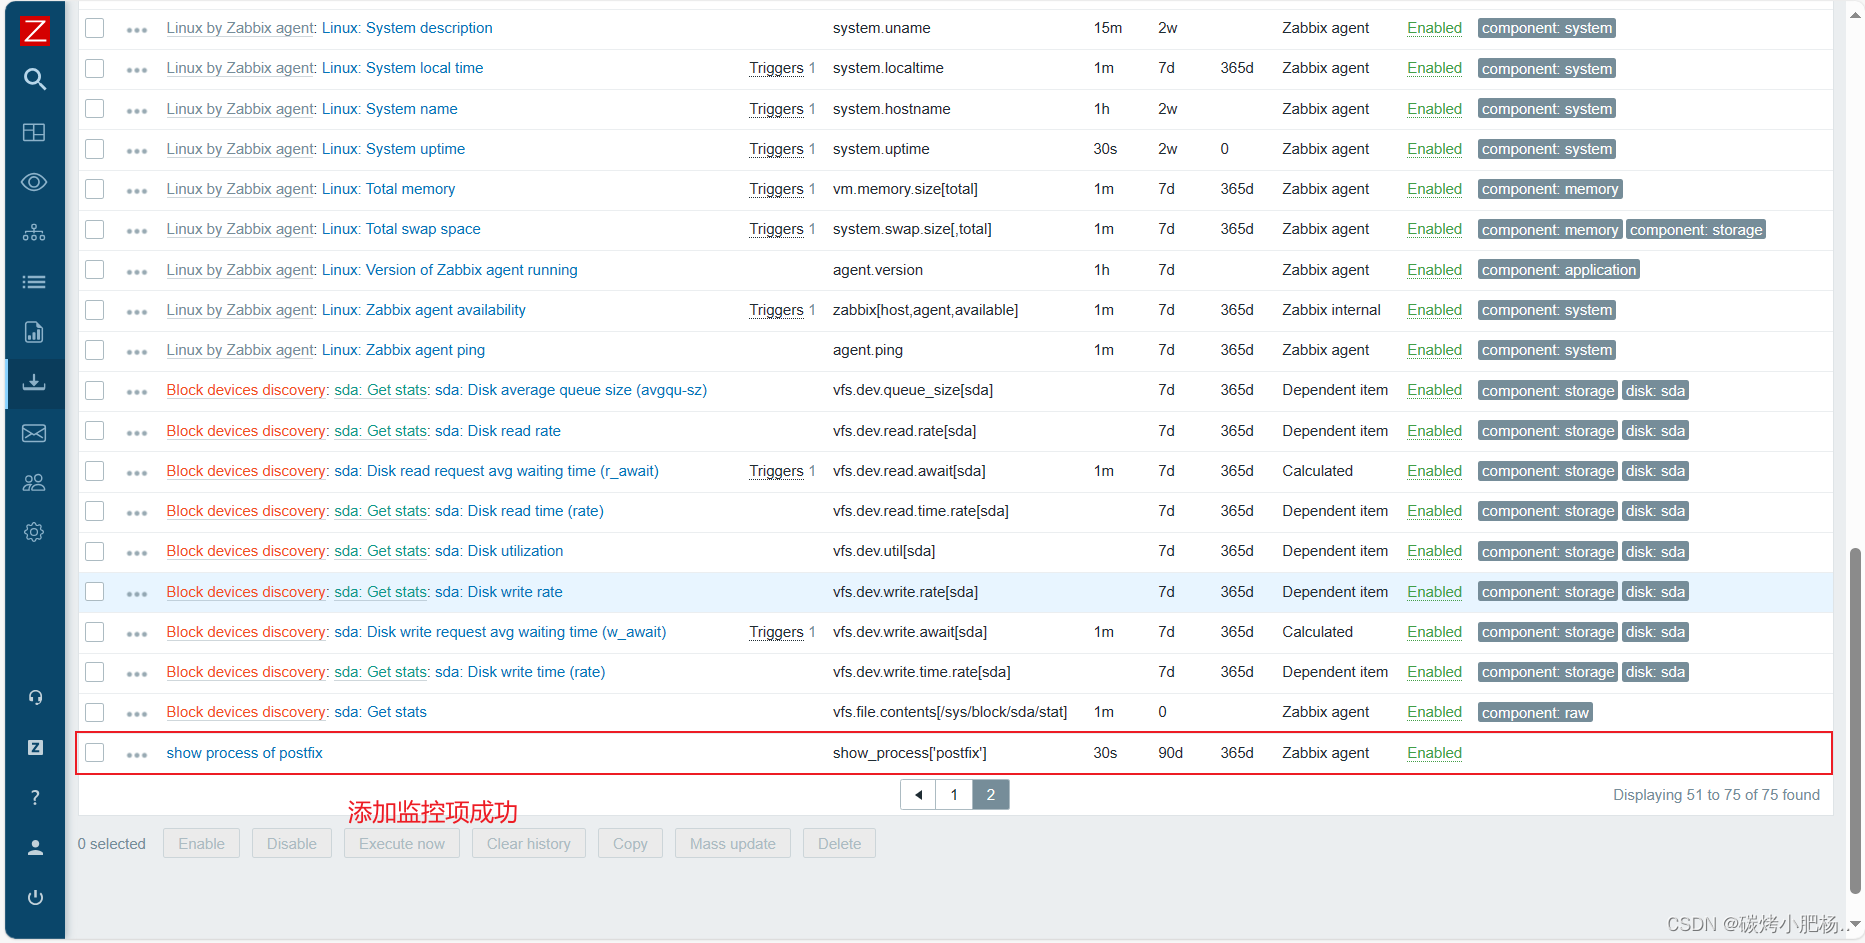
创建监控项
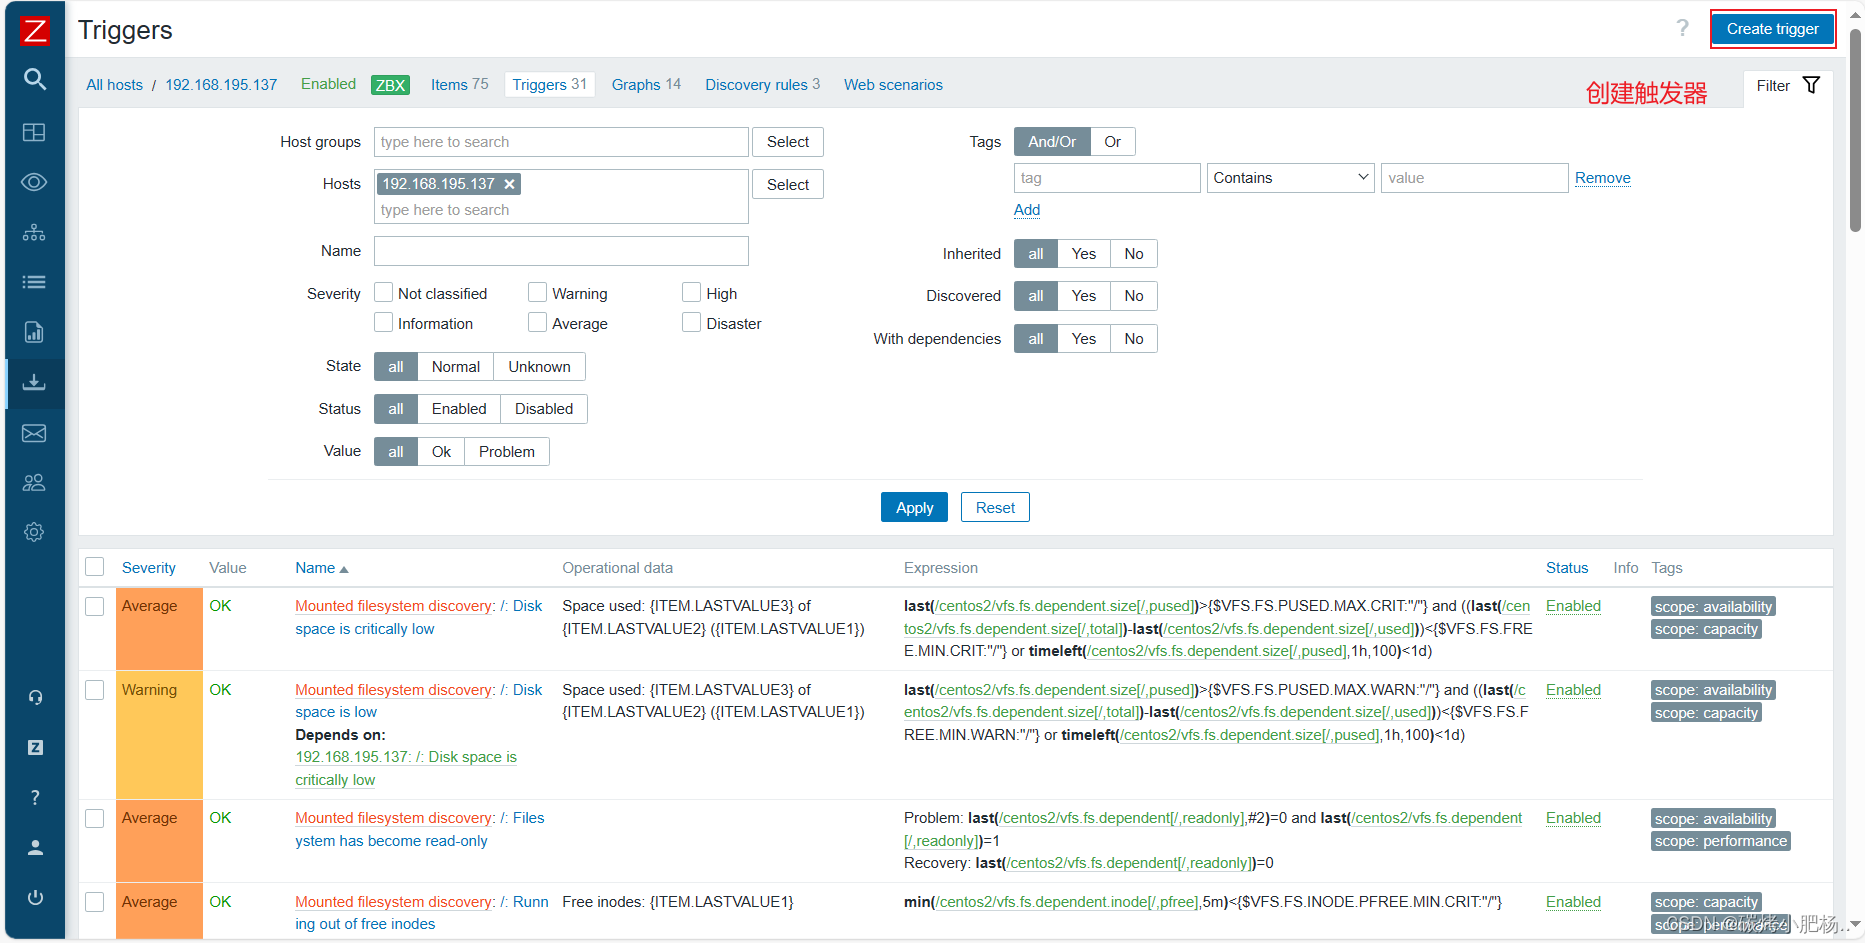
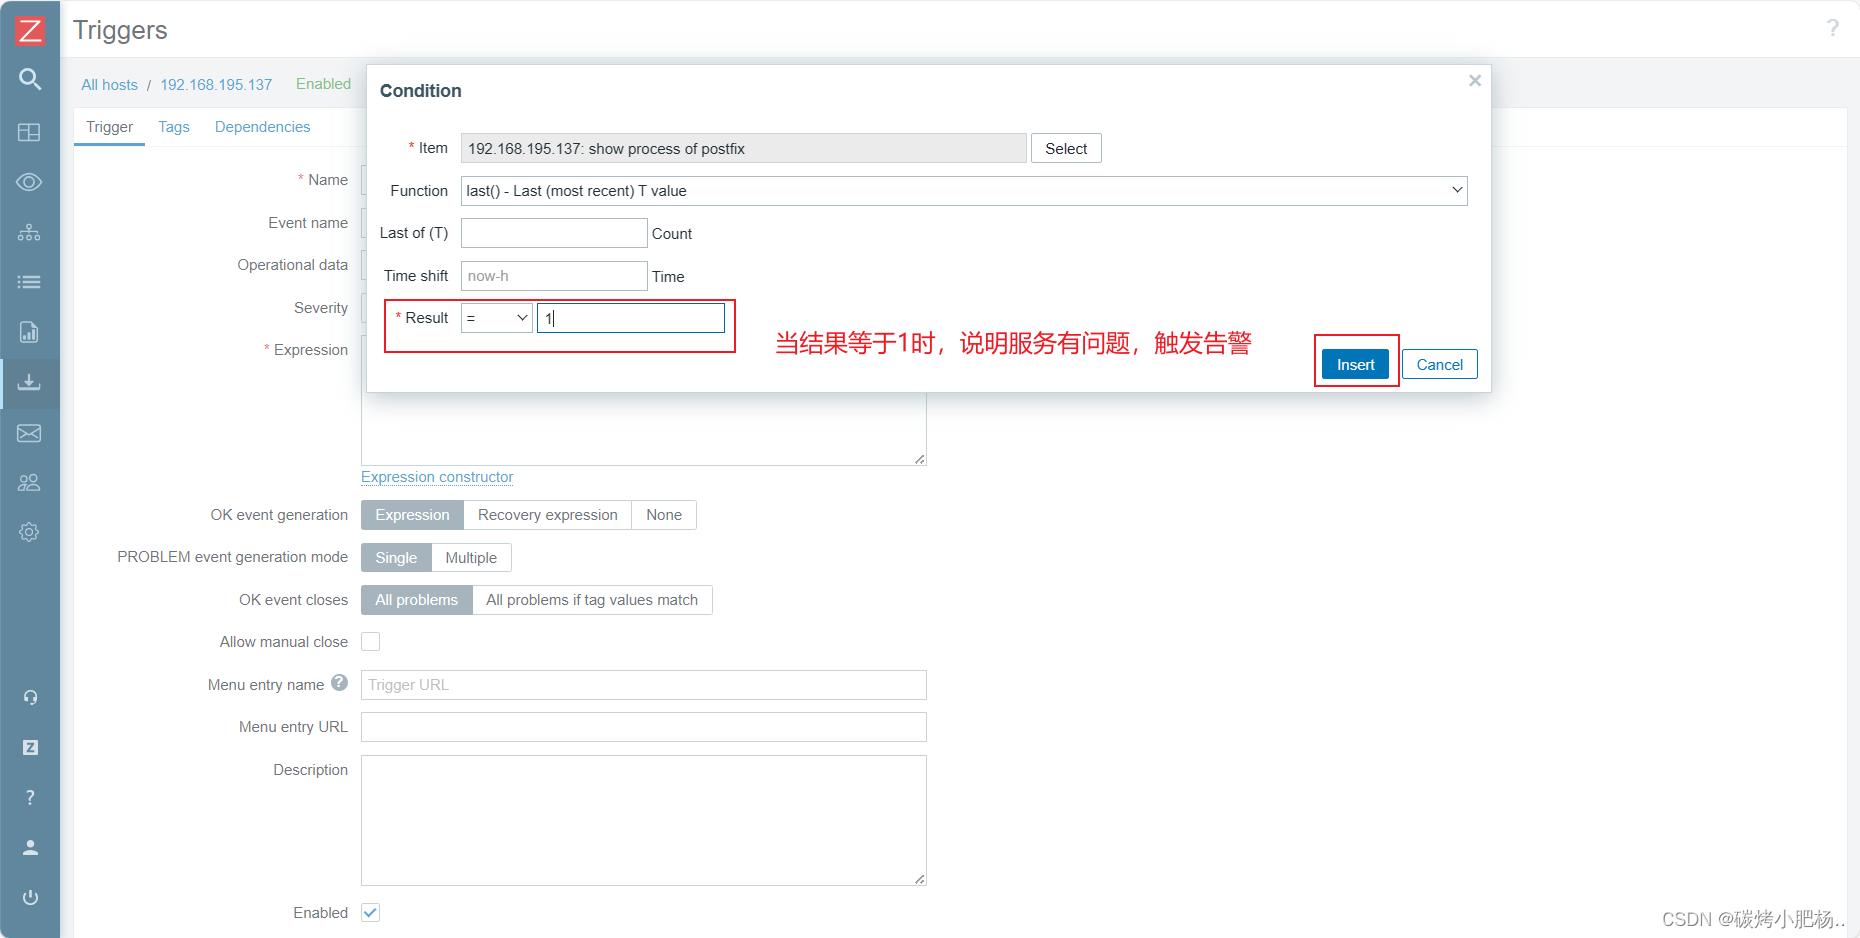
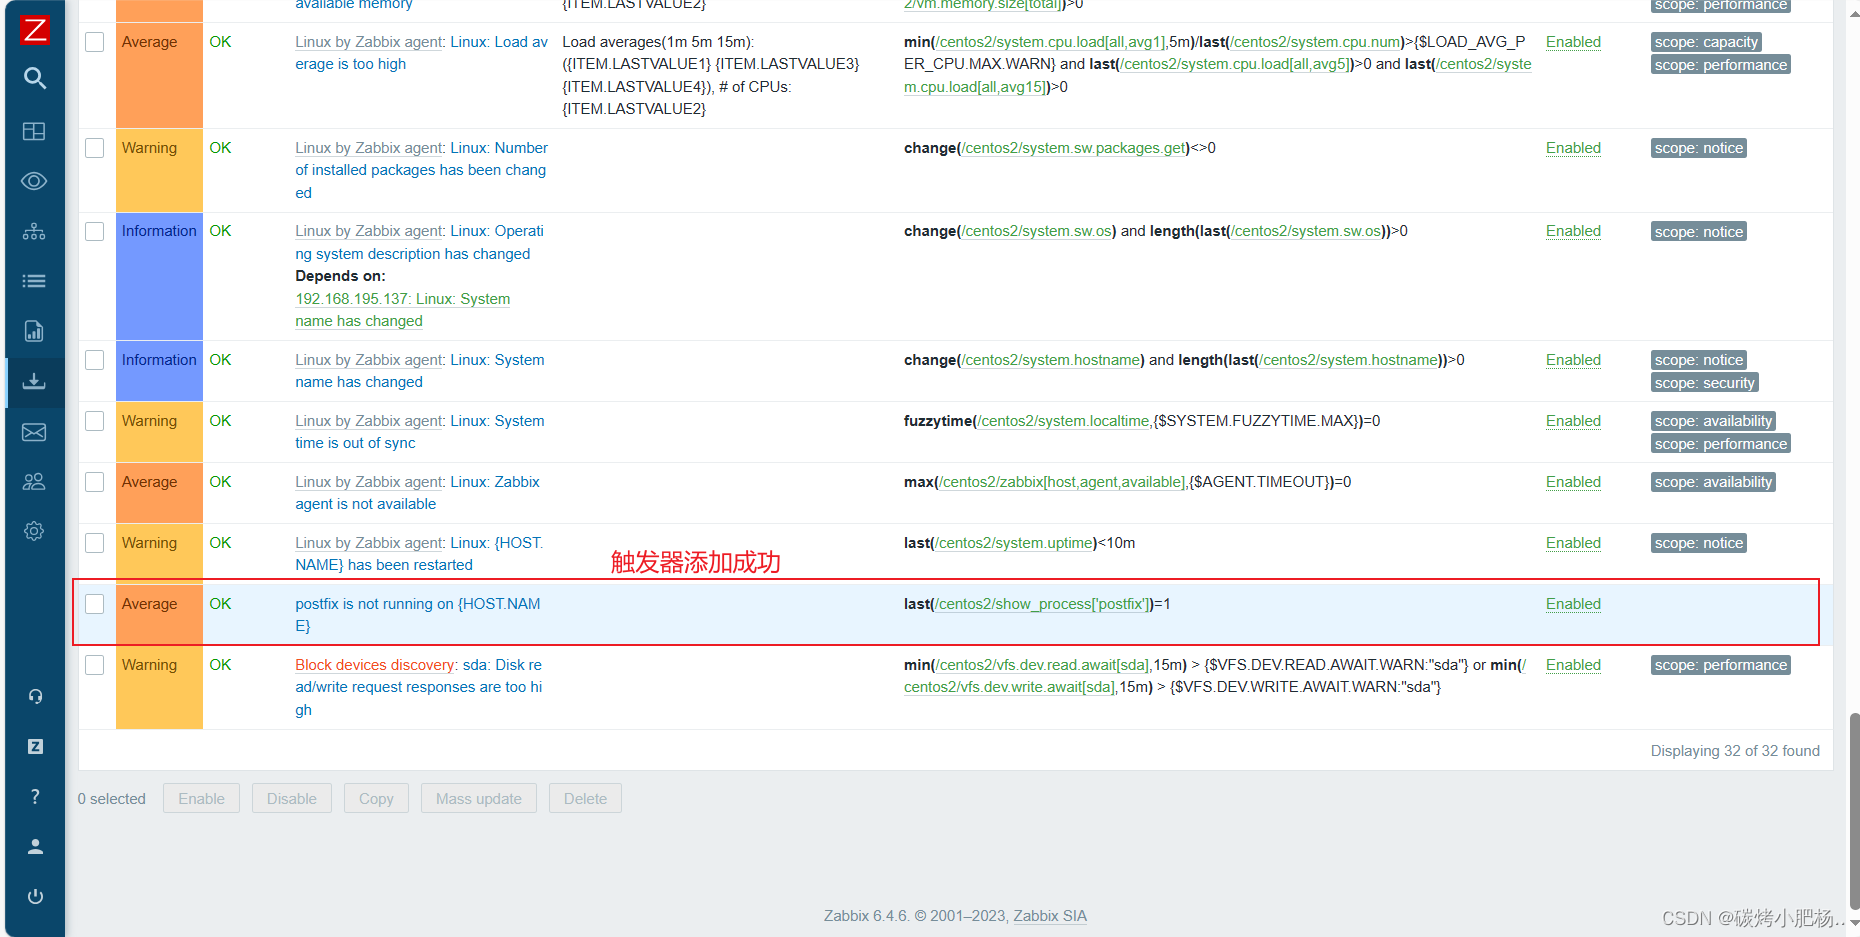
创建触发器
1.4测试
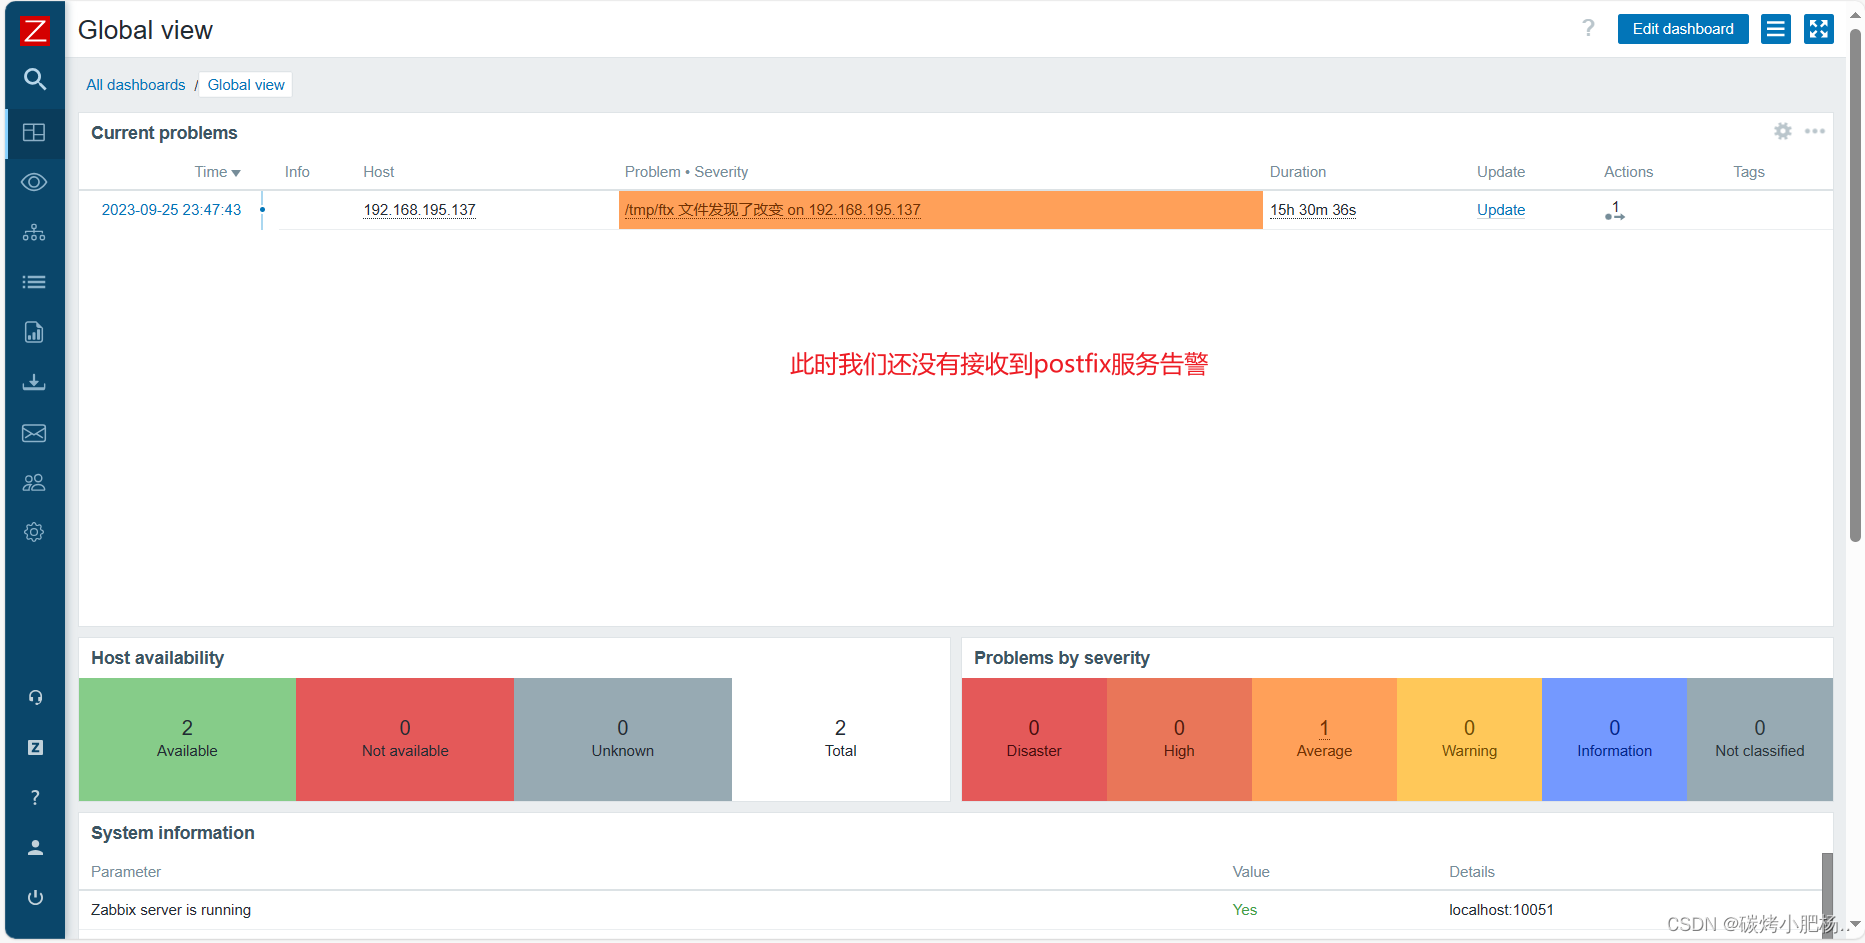
我们手动关闭一下postfix服务
[root@centos2 etc]# systemctl restart zabbix_agentd.service
[root@centos2 etc]# systemctl stop postfix.service
[root@centos2 etc]# ss -antl
State          Recv-Q          Send-Q                     Local Address:Port                      Peer Address:Port
LISTEN         0               128                              0.0.0.0:22                             0.0.0.0:*
LISTEN         0               128                              0.0.0.0:10050                          0.0.0.0:*
LISTEN         0               128                                 [::]:22                                [::]:*
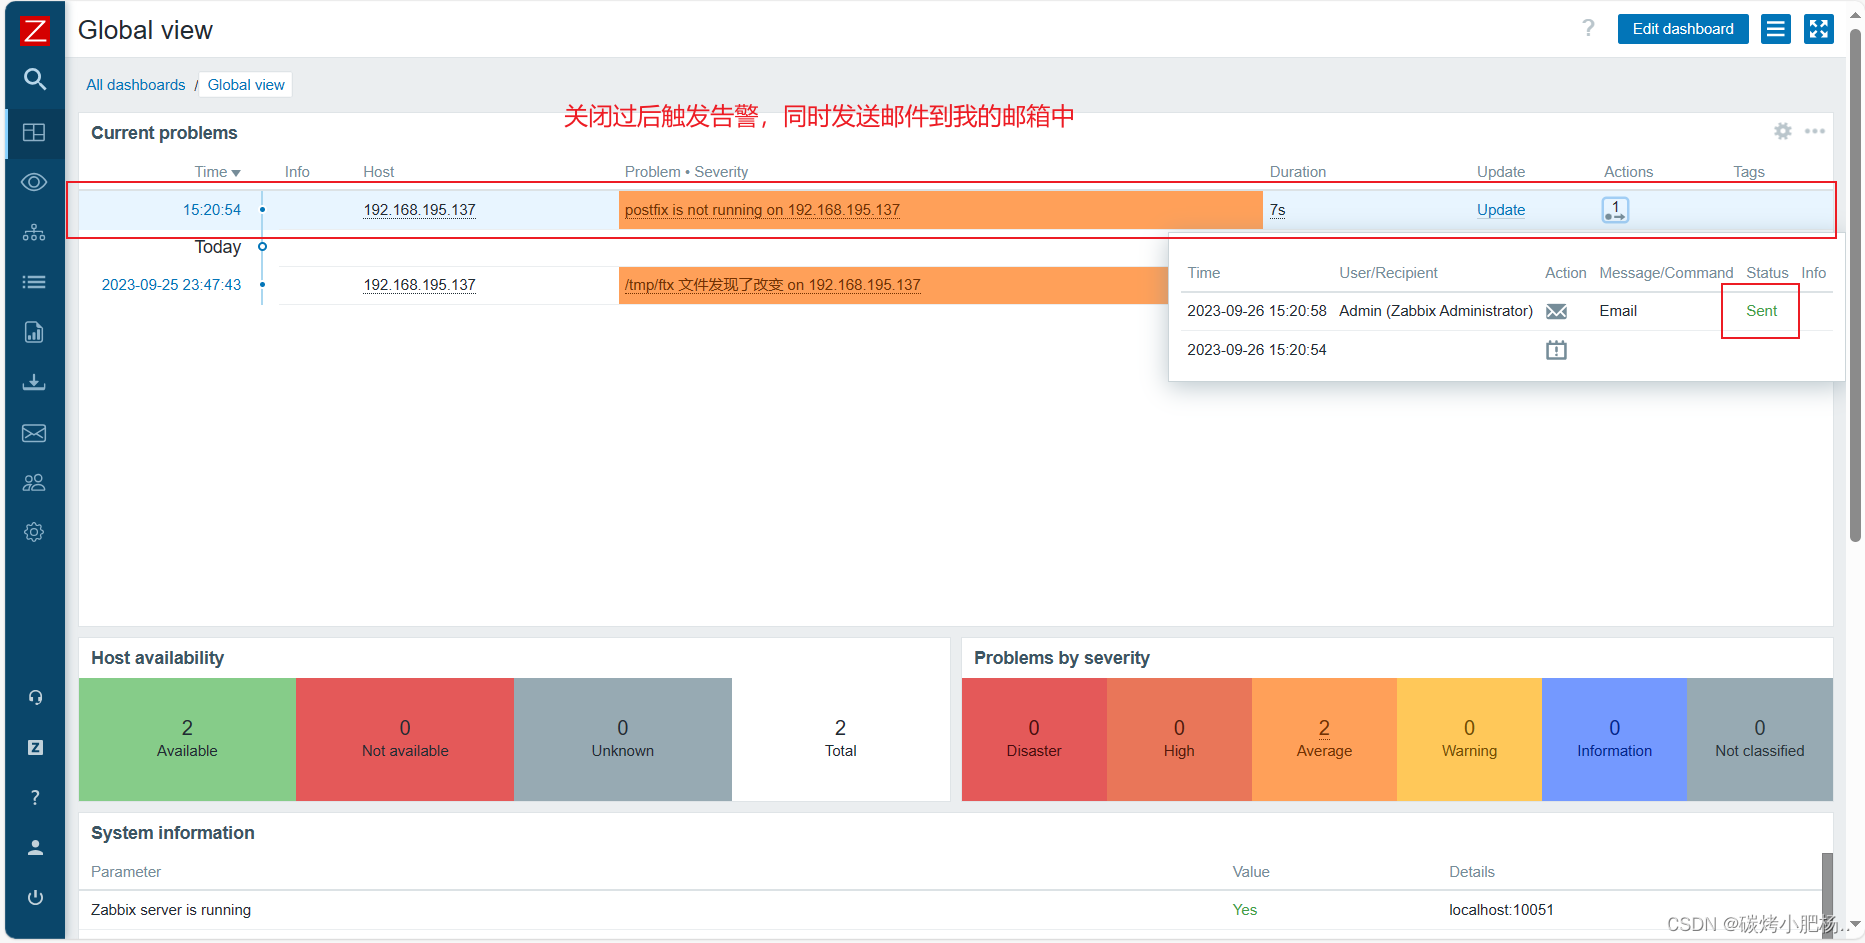
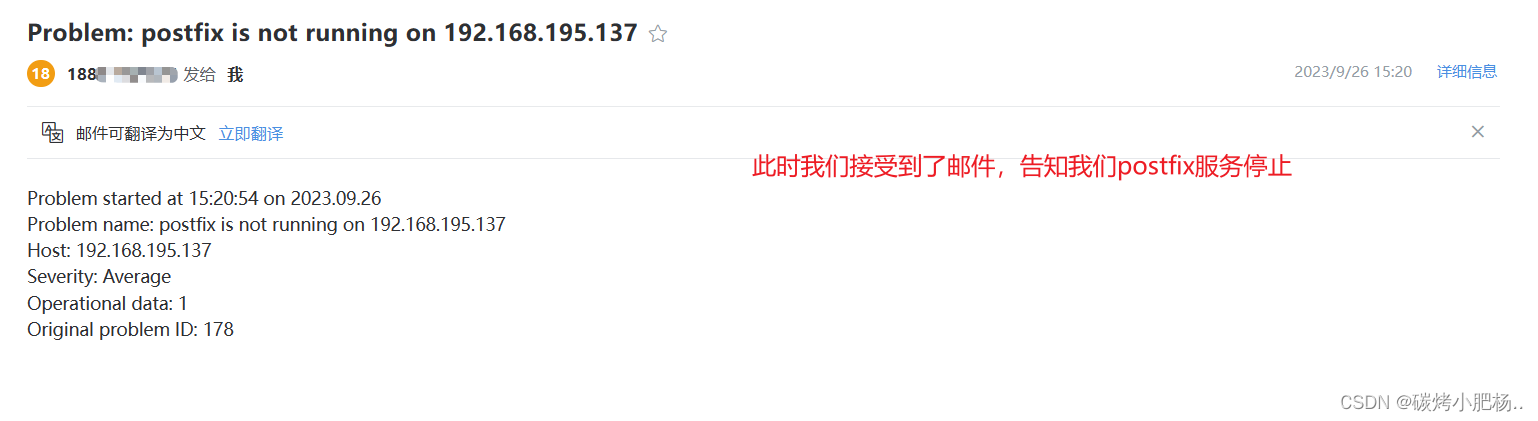
查看邮箱
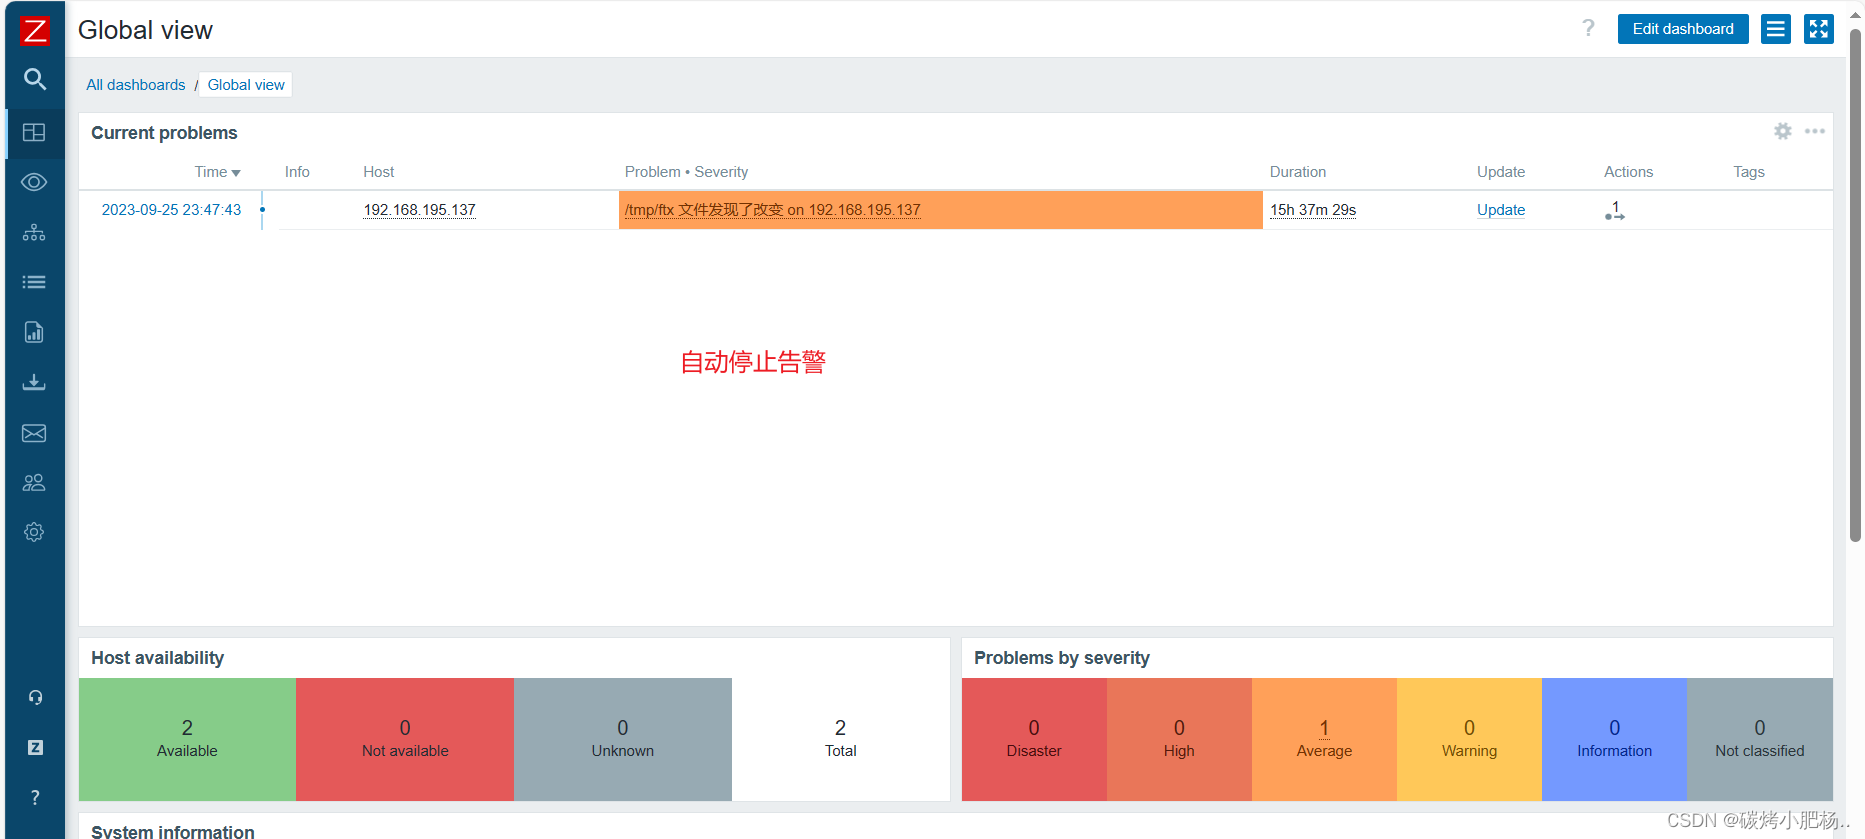
重新开启服务
[root@centos2 etc]# systemctl start postfix.service
[root@centos2 etc]# ss -antl
State          Recv-Q          Send-Q                     Local Address:Port                      Peer Address:Port
LISTEN         0               128                              0.0.0.0:22                             0.0.0.0:*
LISTEN         0               100                            127.0.0.1:25                             0.0.0.0:*
LISTEN         0               128                              0.0.0.0:10050                          0.0.0.0:*
LISTEN         0               128                                 [::]:22                                [::]:*
LISTEN         0               100                                [::1]:25                                [::]:*
2.自定义监控日志
注:自定义监控日志同样也是利用脚本,不同的是监控进程使用的是shell脚本,而监控日志使用的却是python脚本
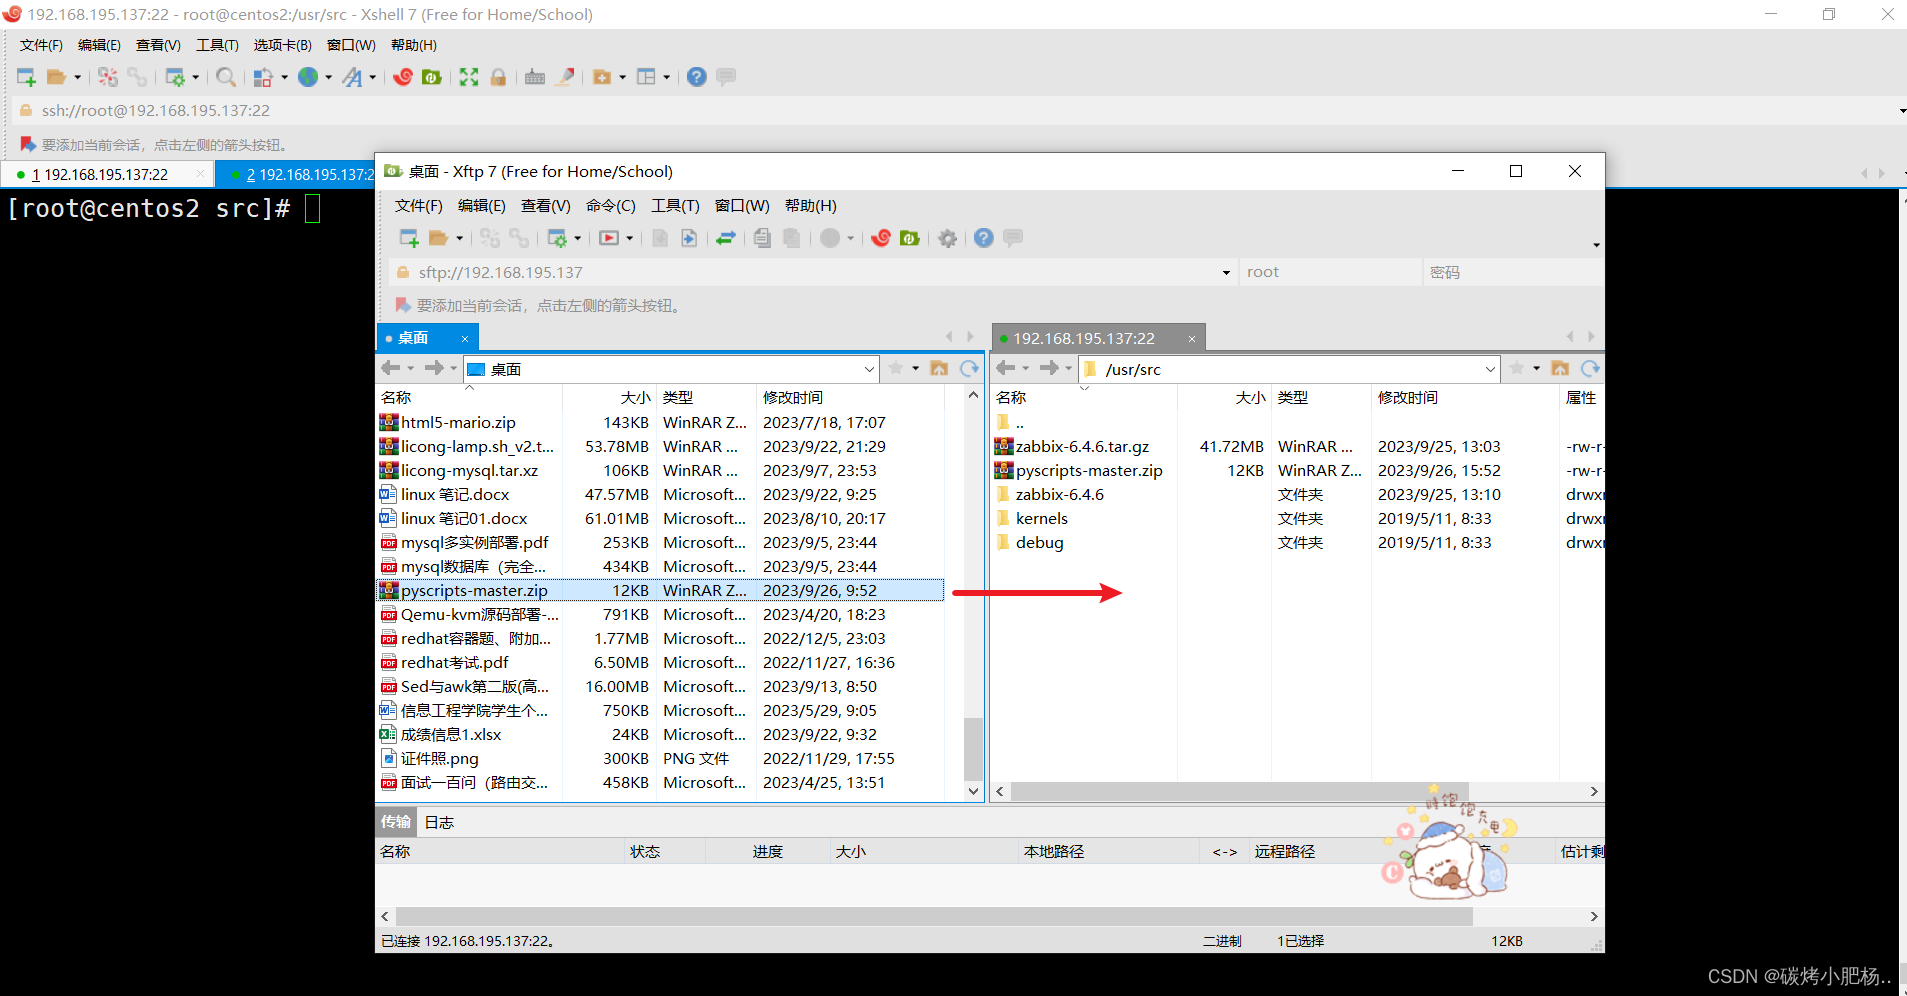
2.1到码云上拉取有关的包
压缩包地址:https://github.com/chendao2015/
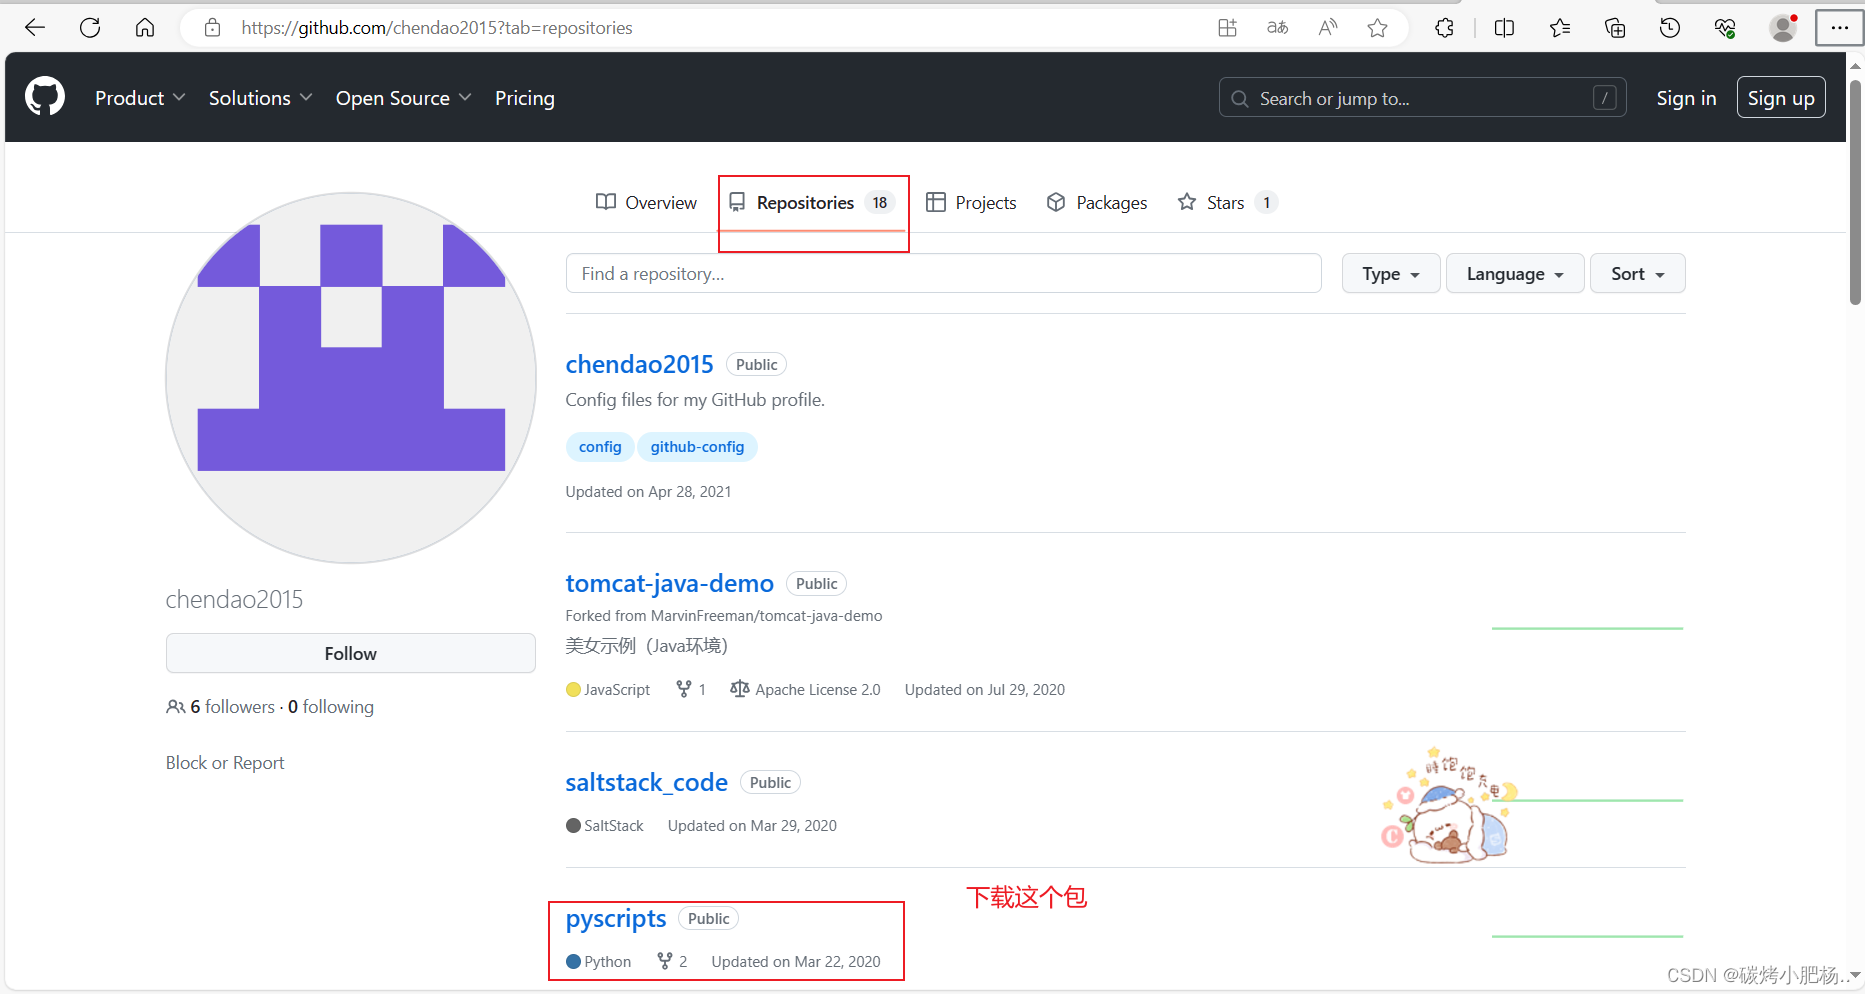
将下载的包发送到被监控端
//安装unzip包和Python3的包以便于解压和执行脚本
[root@centos2 script]# yum -y install unzip
省略. . .

[root@centos2 ~]# yum -y install python3
省略. . .

//解压后查看文件,并服务log.py文件执行权限
[root@centos2 src]# ls
debug  kernels  pyscripts-master.zip  zabbix-6.4.6  zabbix-6.4.6.tar.gz
[root@centos2 src]# unzip pyscripts-master.zip
Archive:  pyscripts-master.zip
67a2f27e90f1cb27d46bbe855d255b3e0d302cd7
   creating: pyscripts-master/
  inflating: pyscripts-master/README.md
  inflating: pyscripts-master/dmp4.py
  inflating: pyscripts-master/log.py
  inflating: pyscripts-master/mail_send.py
  inflating: pyscripts-master/定时发微信群消息.zip
[root@centos2 src]# ls
debug  kernels  pyscripts-master  pyscripts-master.zip  zabbix-6.4.6  zabbix-6.4.6.tar.gz
[root@centos2 src]# cd pyscripts-master/
[root@centos2 pyscripts-master]# ls
dmp4.py  log.py  mail_send.py  README.md  定时发微信群消息.zip
[root@centos2 pyscripts-master]# mv log.py /script/    //将此文件移动到我们存放脚本的目录中
[root@centos2 pyscripts-master]# ls /script/
log.py  showprocess.sh
[root@centos2 pyscripts-master]# chmod +x /script/log.py   //赋予执行权限
[root@centos2 pyscripts-master]# ls /script/
log.py  showprocess.sh
log.py的用法

测试log.py脚本文件
//首先我们要指定一个日志文件
[root@centos2 script]# vim /tmp/test.log  //我们顺便往里面添加了一些数据,并在其中加入了Error字符
[root@centos2 script]# cat /tmp/test.log
fdsfgdgds
fefebkmzds
fdsfsd
bgdlb

sfhfad
Error
gfgfghn
nlnsn
[root@centos2 script]# python3 log.py /tmp/test.log  //第一次读取检查到了Error关键词,返回码为1,表示存在问题
1
[root@centos2 script]# python3 log.py /tmp/test.log  //第二次读取的返回码为0正常,因为前面读取过的不会再次读取
0

//查看/tmp/logseek文件,看读取的位置
[root@centos2 script]# cat /tmp/logseek
62

注:按照log.py的用法可知,第二参数和第三参数存在默认选项,我们也可以指定文件,指定关键词
2.2编辑被控制端配置文件
//创建自定义监控任务
[root@centos2 etc]# vim zabbix_agentd.conf
[root@centos2 etc]# tail -1 zabbix_agentd.conf
UserParameter=check_logs[*],python3 /script/log.py $1 $2 $3

//修改配置文件后需重启服务,重新读取配置文件
[root@centos2 etc]# systemctl restart zabbix_agentd.service

//创建自定义监控任务后,我们需要在server端去测试一下是否能接收到被监控端的值
[root@client ~]# zabbix_get -s 192.168.195.137 -k check_logs['/tmp/test.log']
1
[root@client ~]# zabbix_get -s 192.168.195.137 -k check_logs['/tmp/test.log']
0

注:在server端测试时,先将被监控端的/tmp/logseek删除
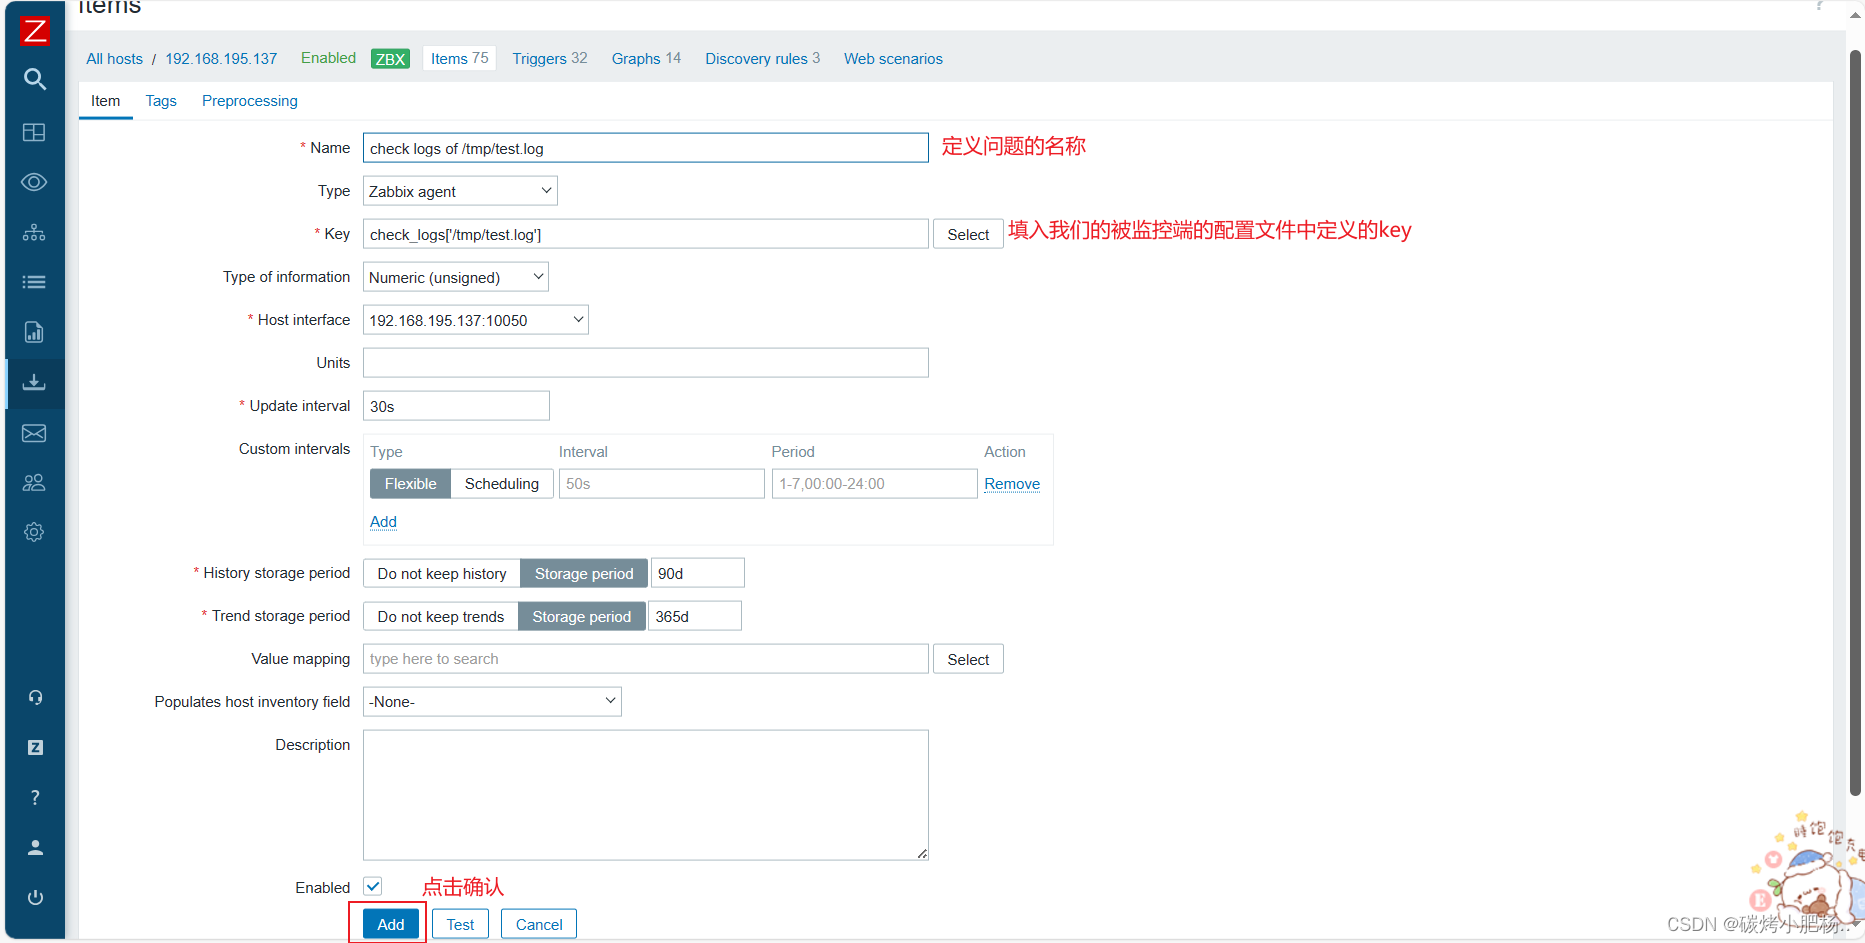
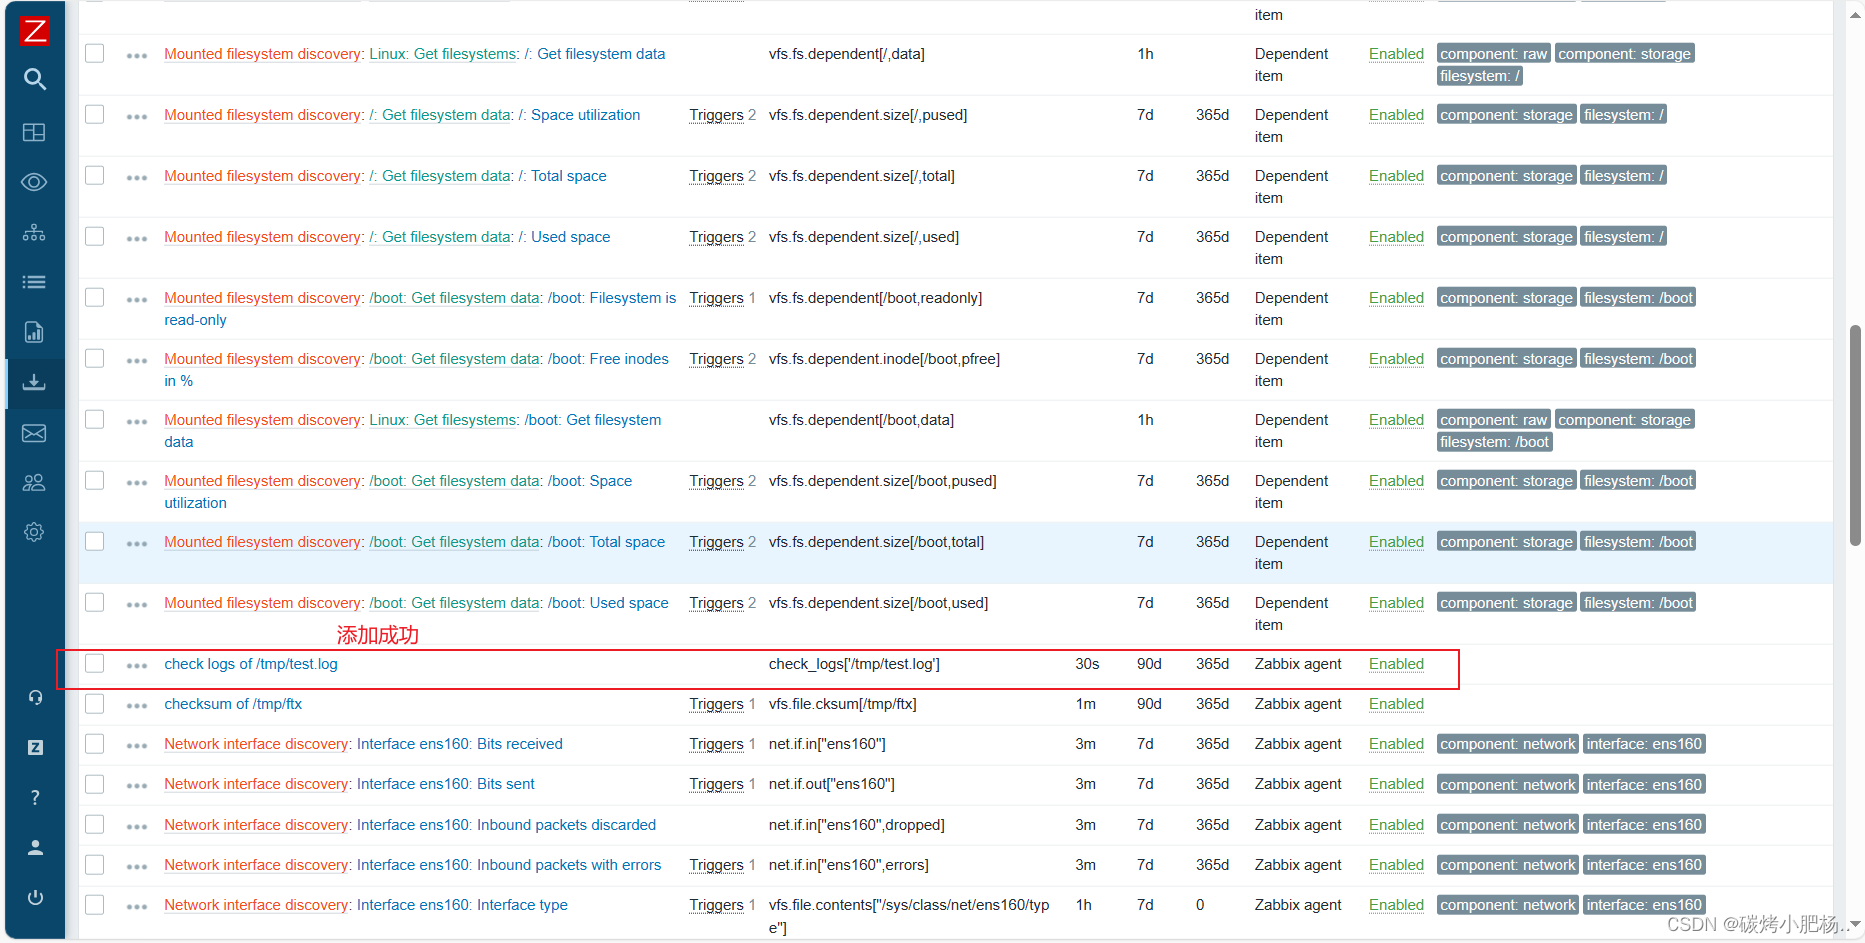
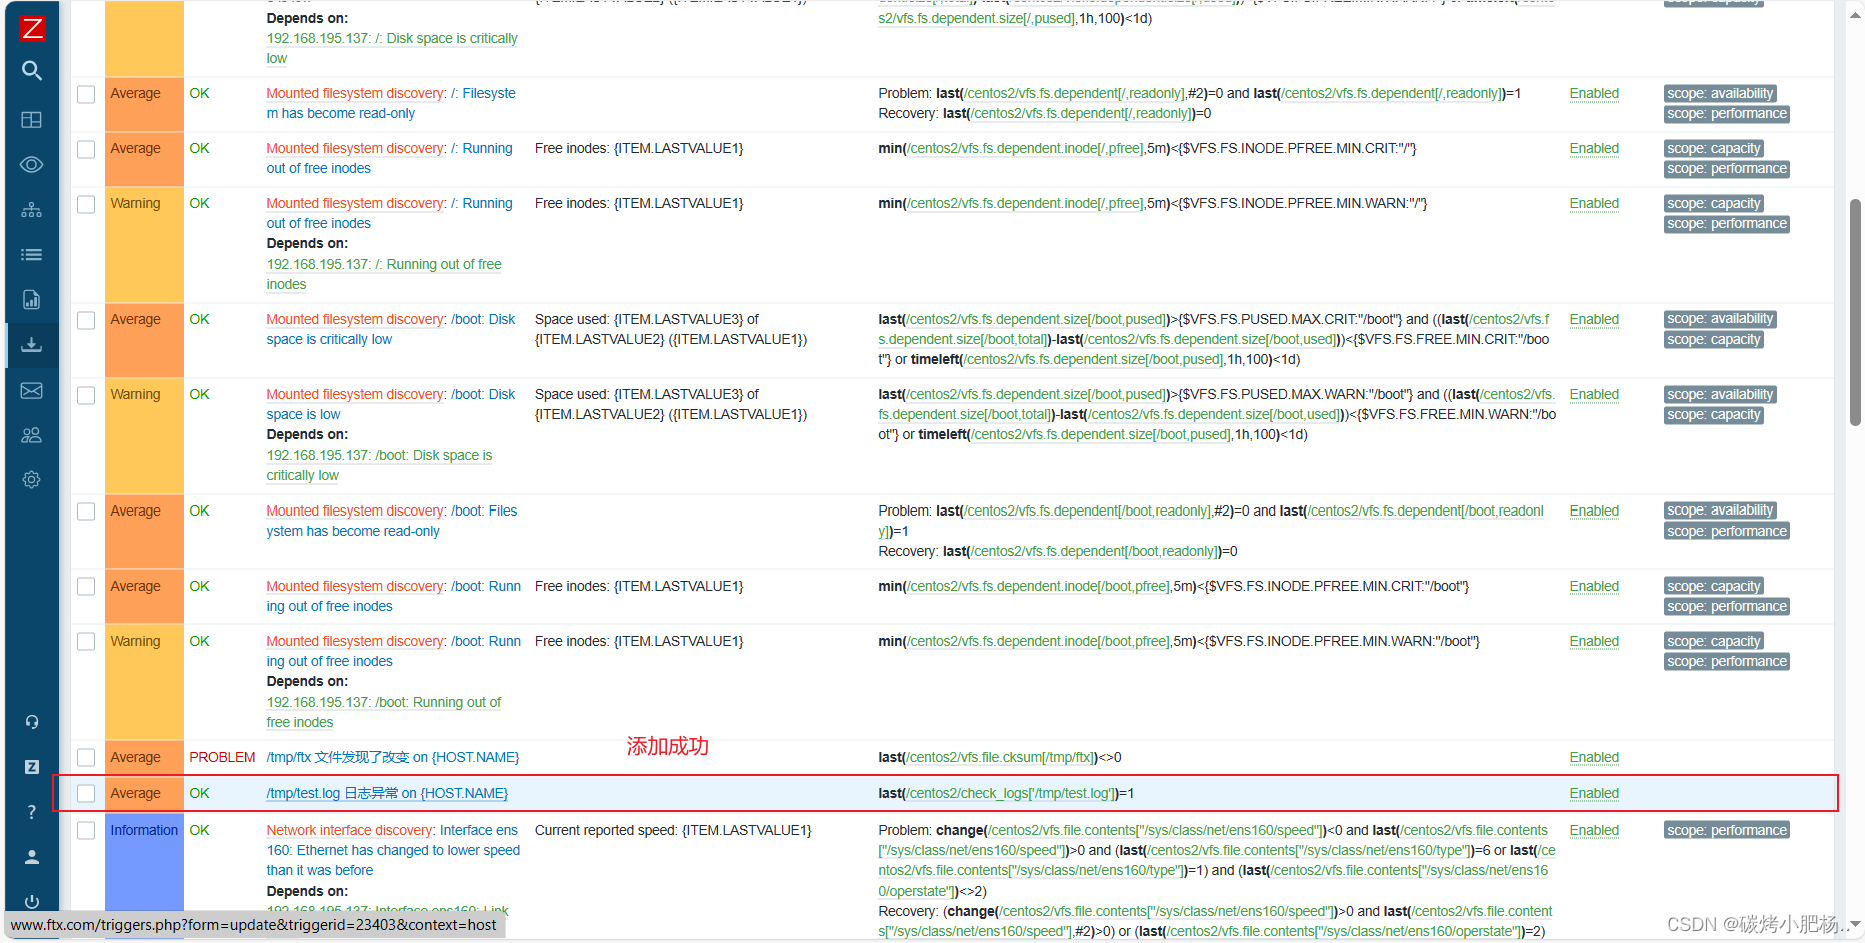
2.3创建监控项和触发器
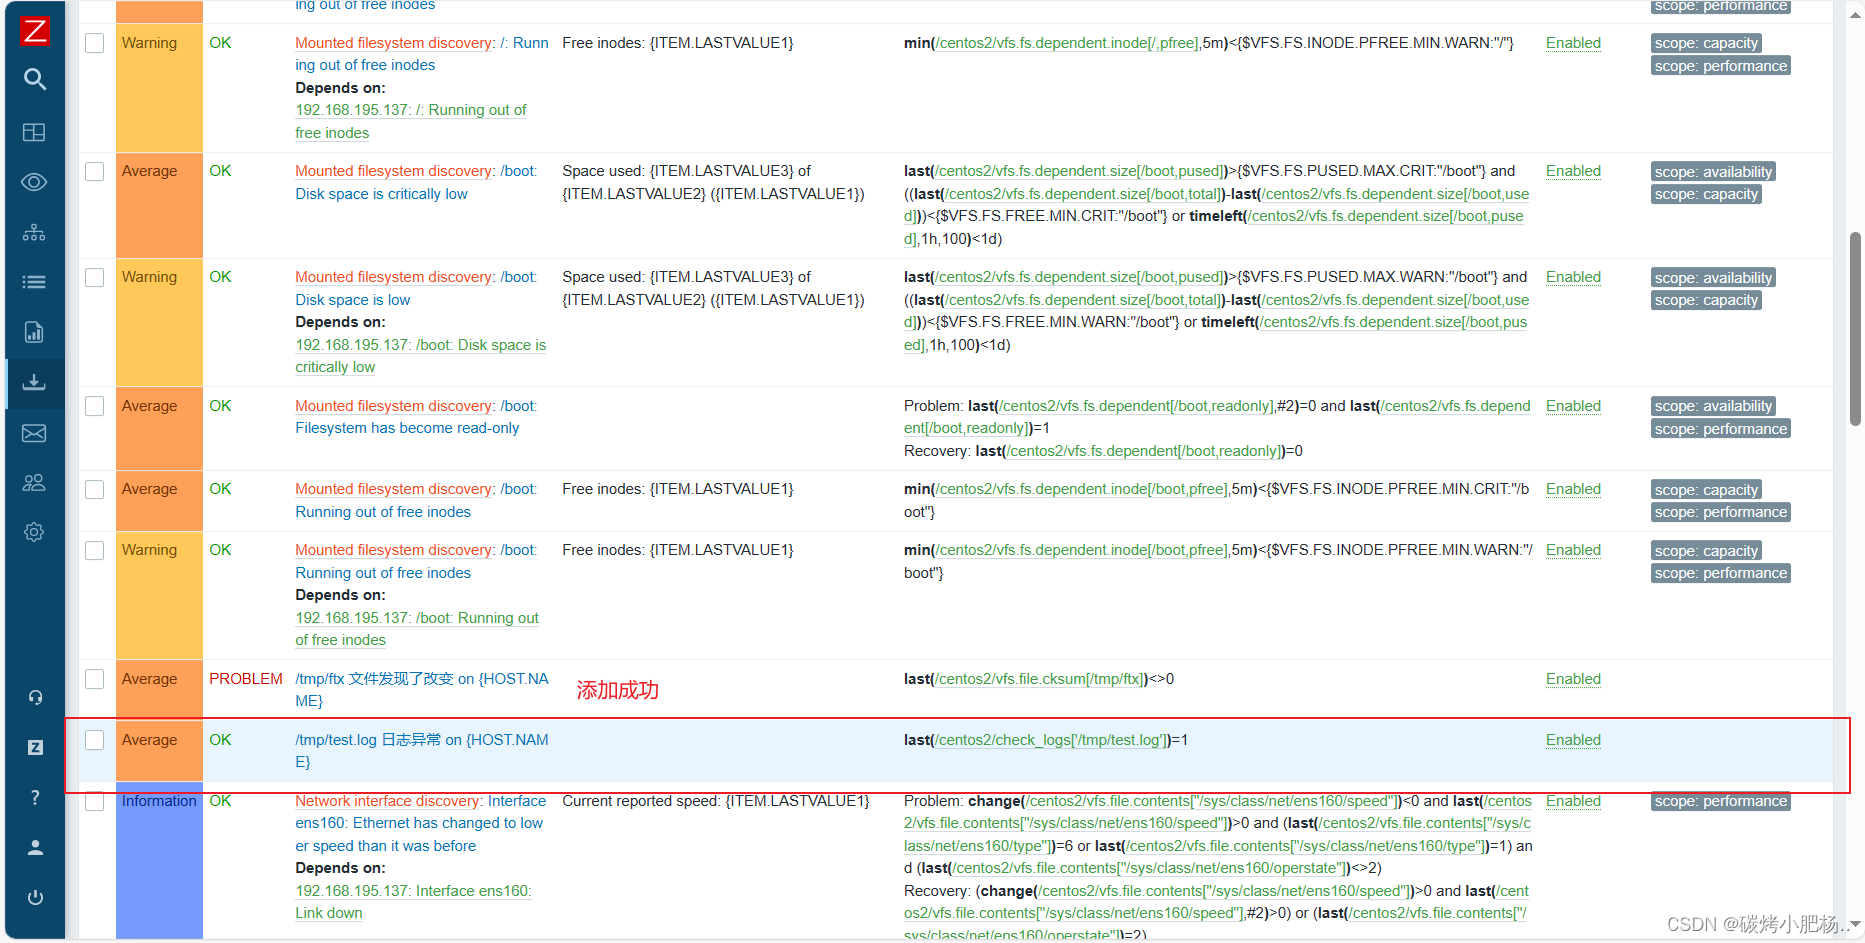
创建监控项
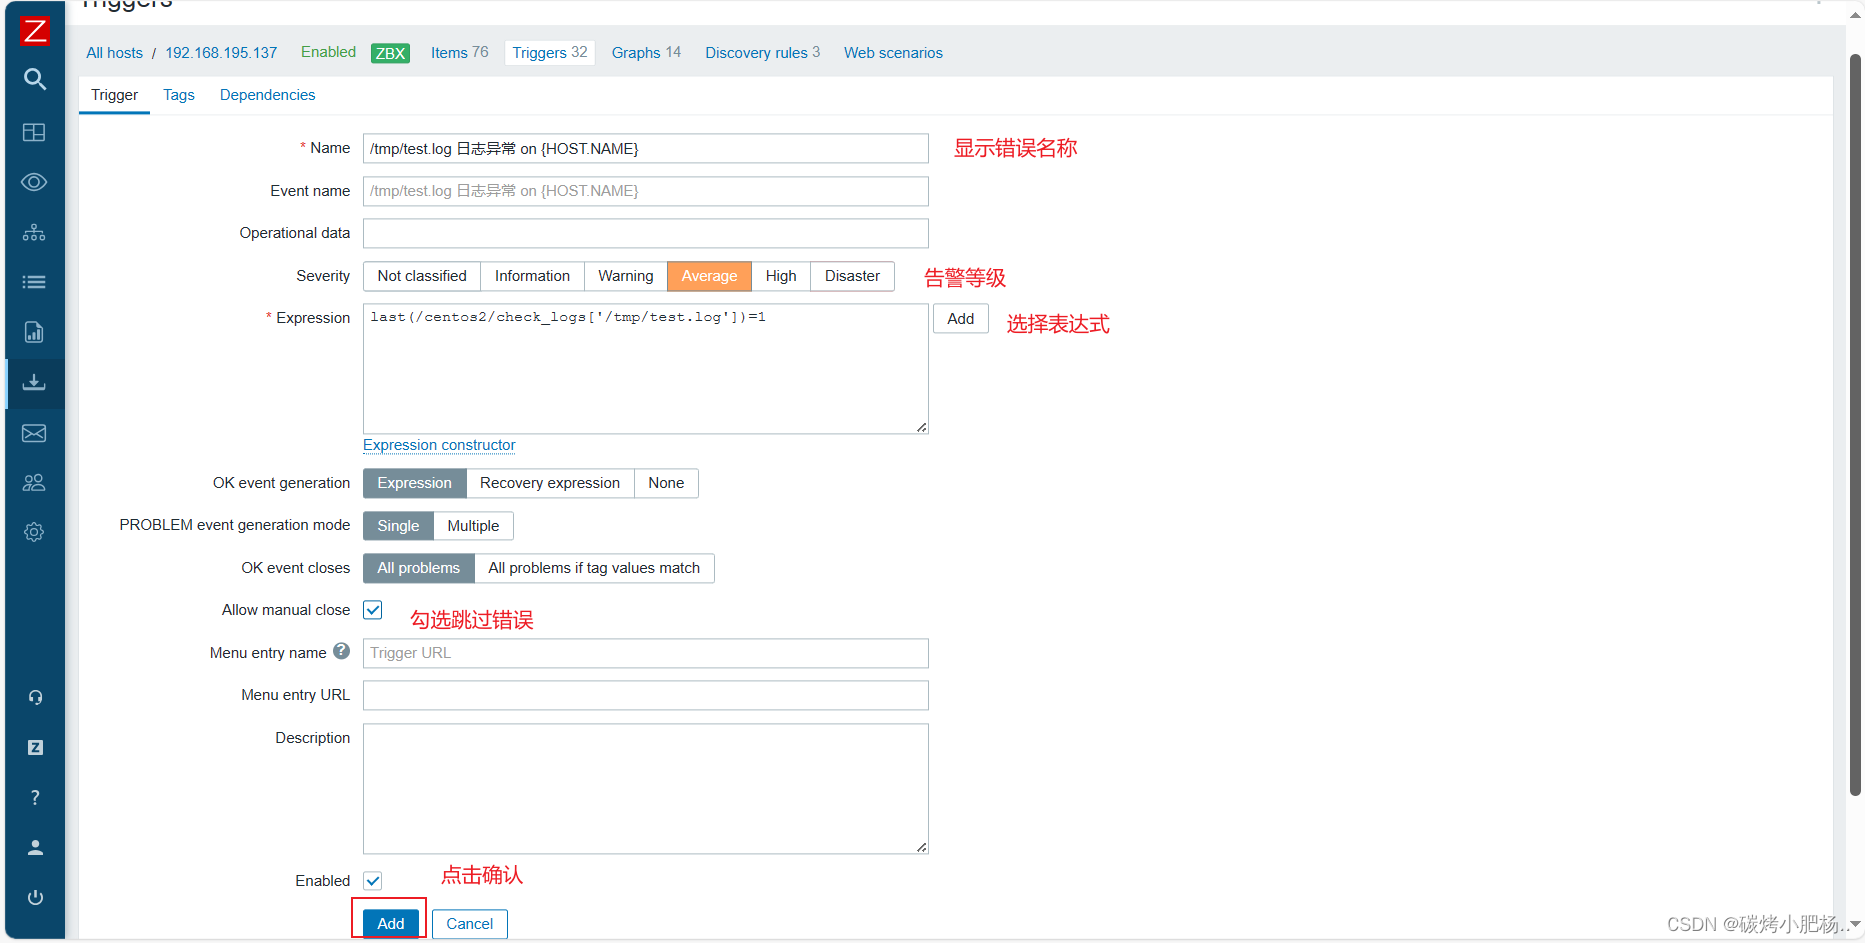
创建触发器
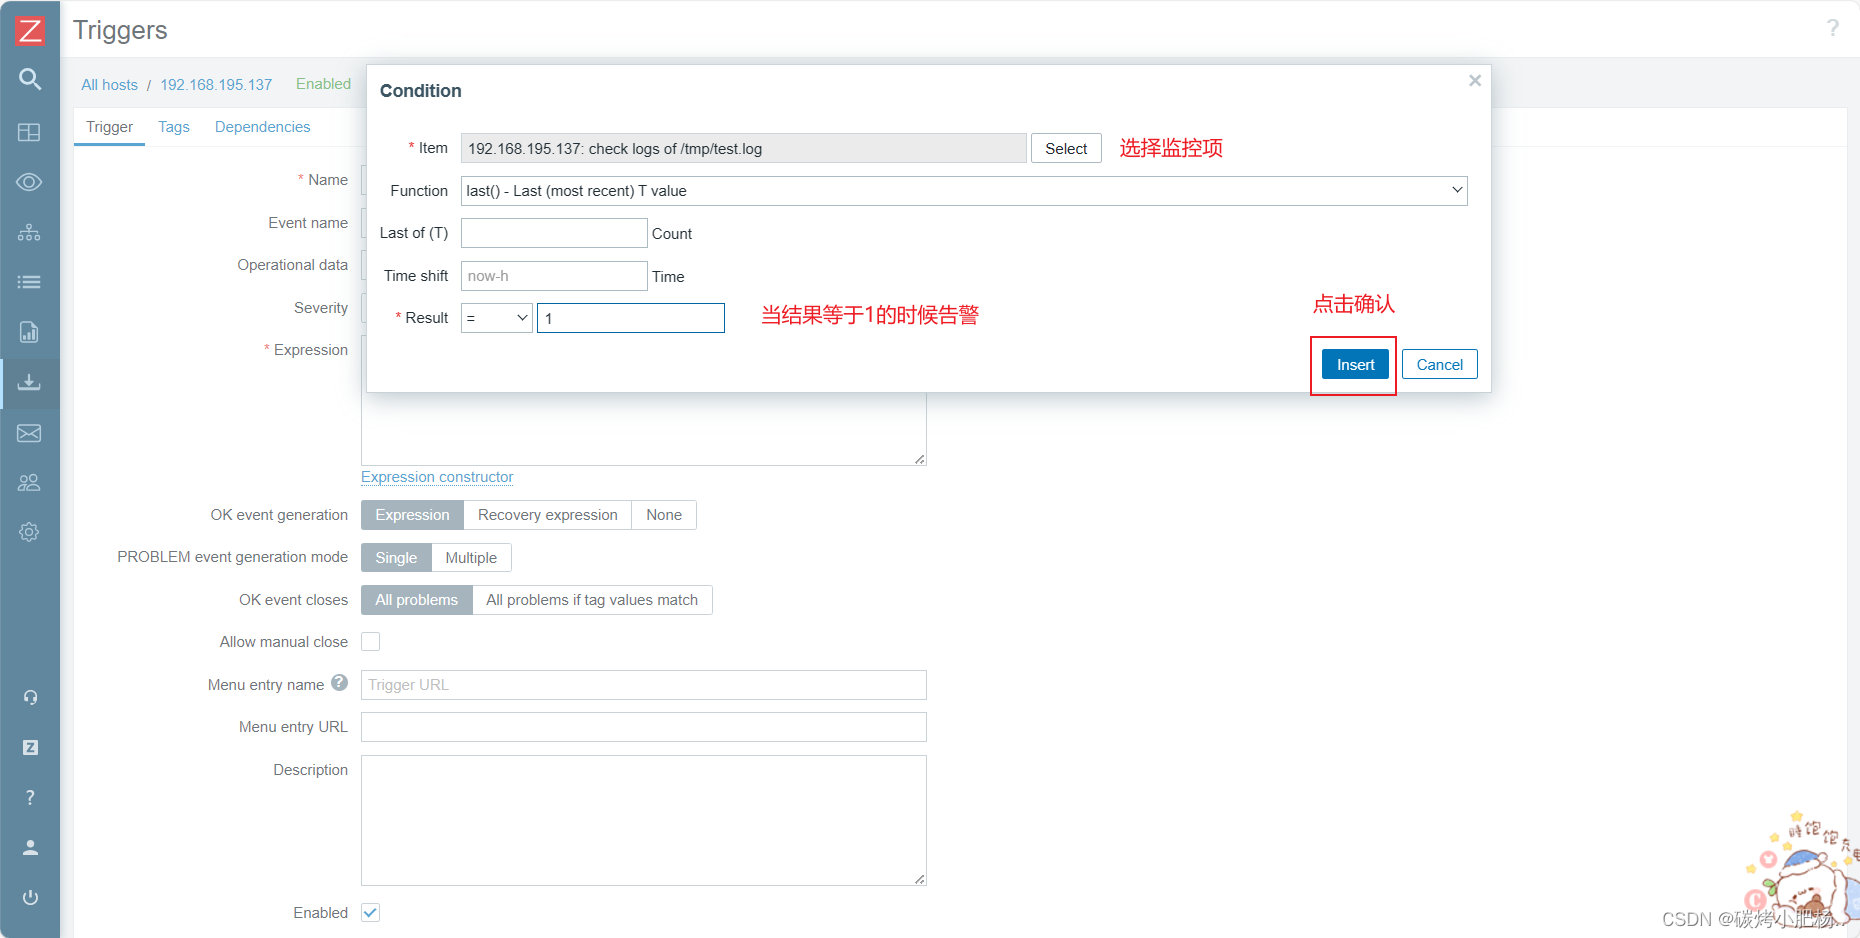
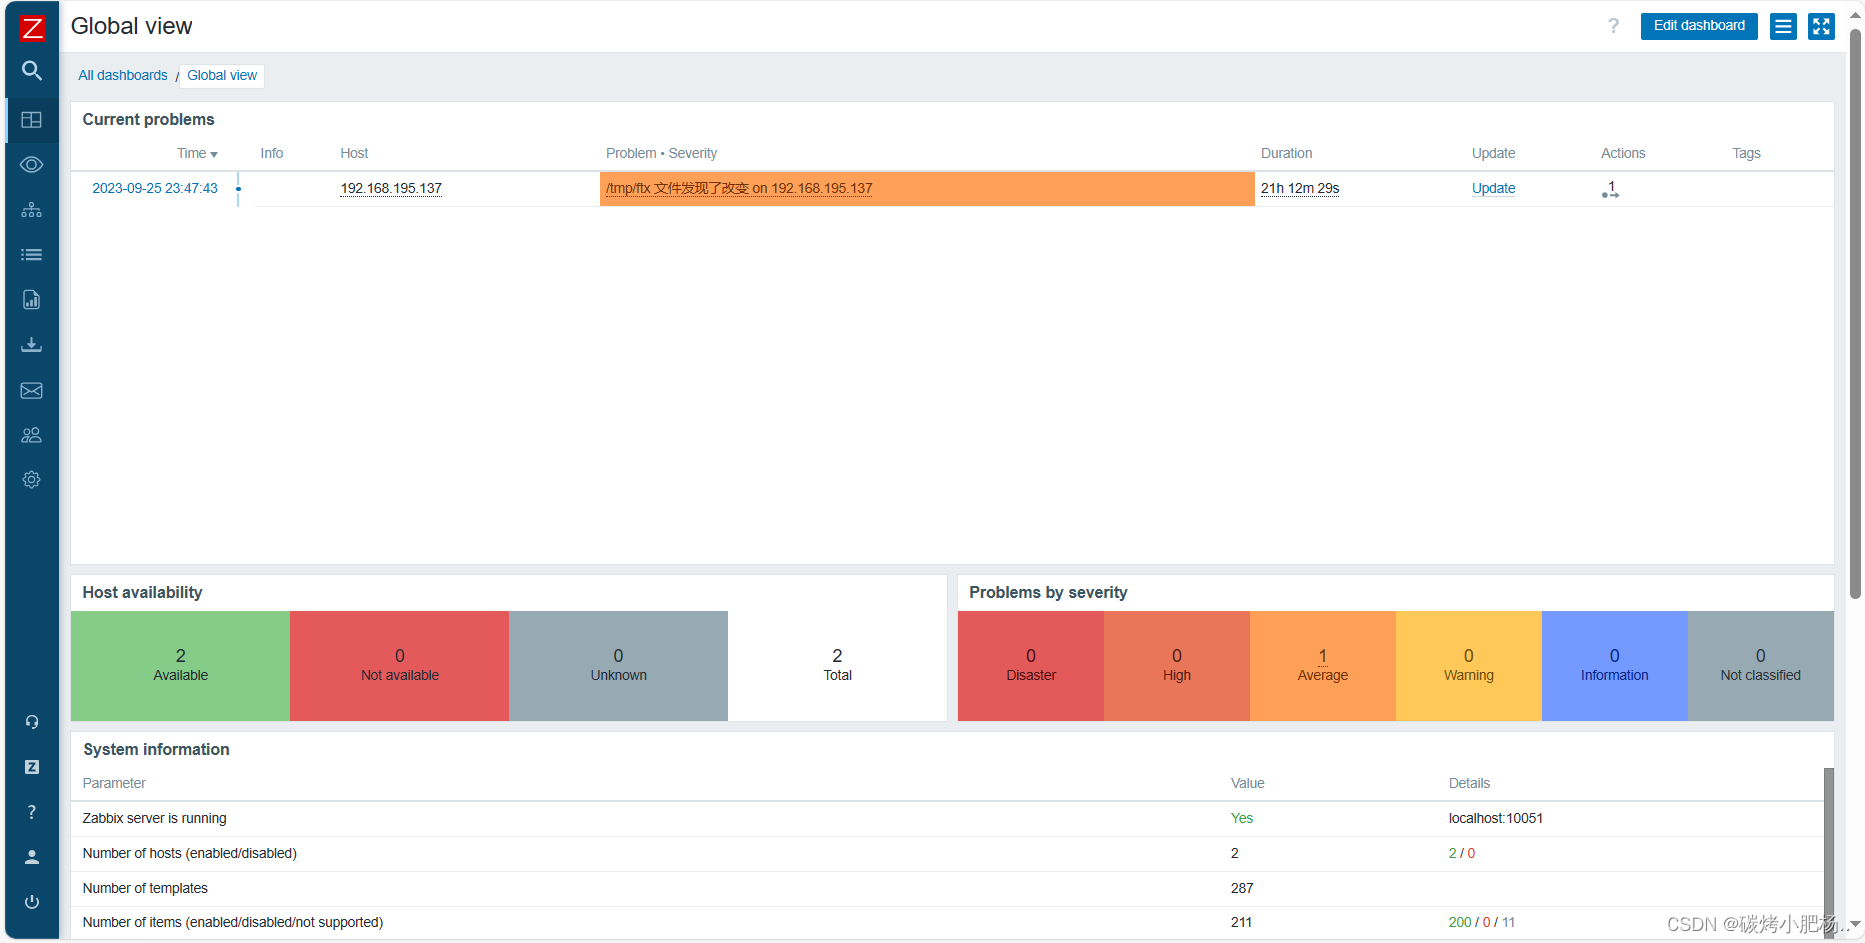
2.4测试
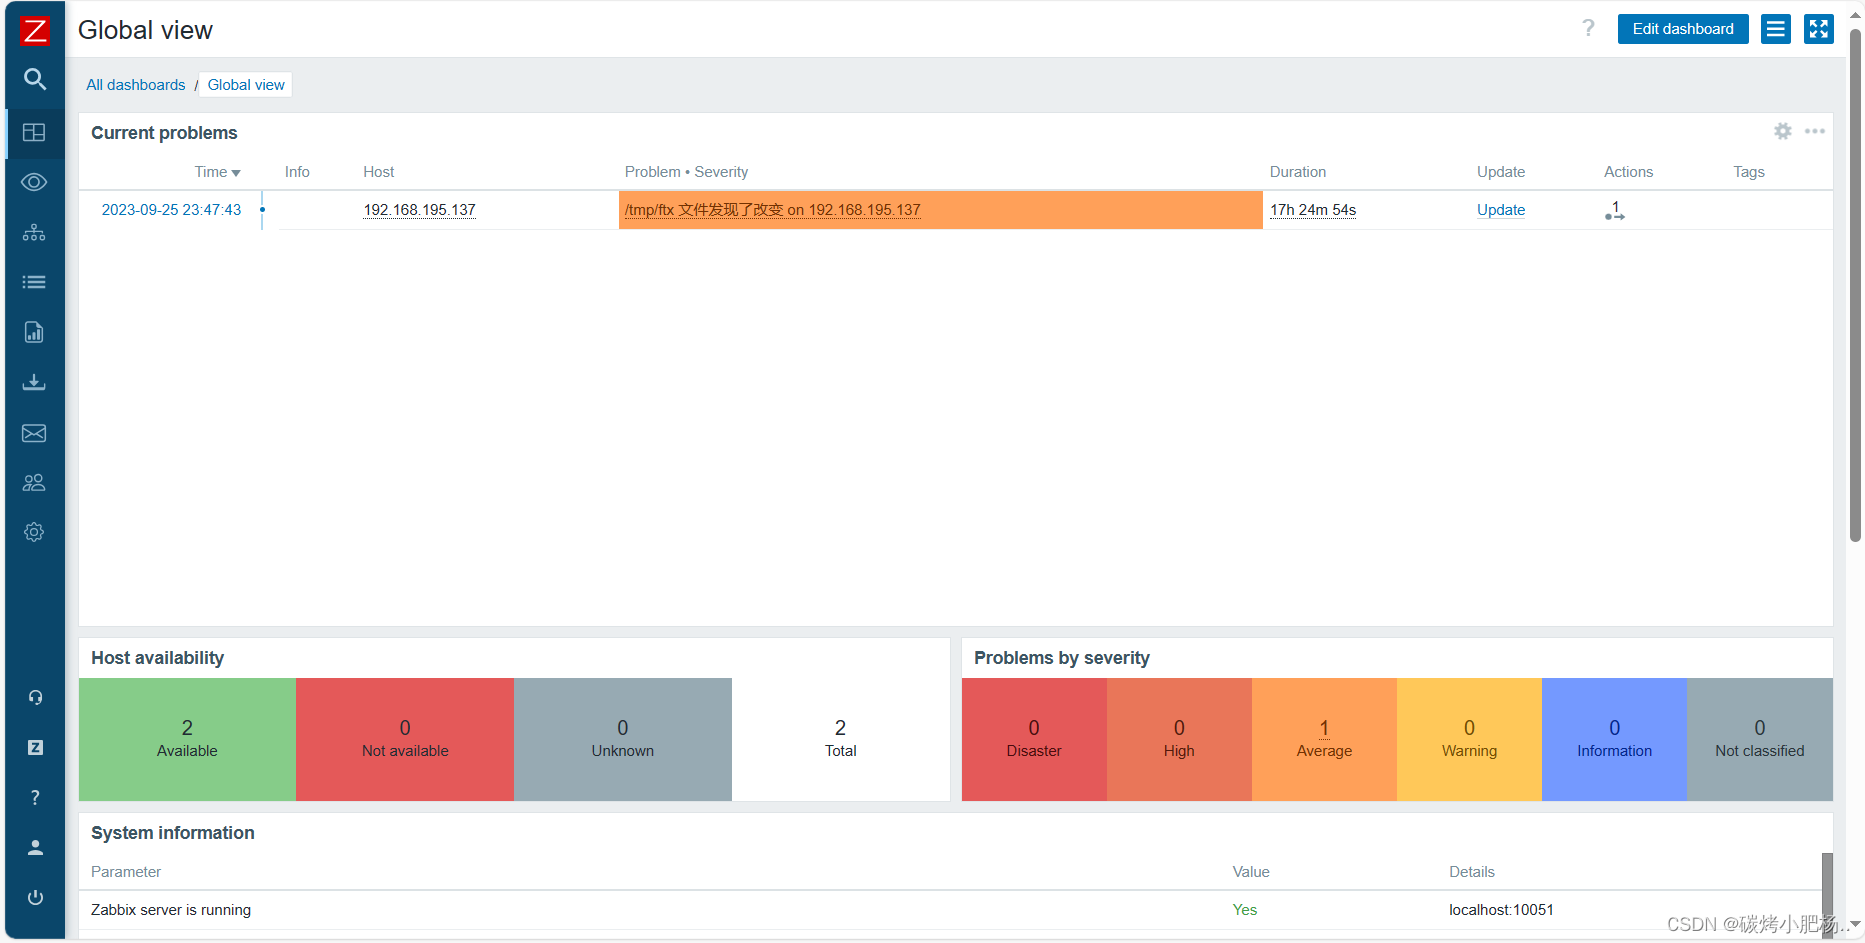
此时还没有出现日志异常告警
我们手动触发一下告警
//向/tmp/test.log日志文件中添加Error
[root@centos2 tmp]# echo "Error" >> /tmp/test.log
[root@centos2 tmp]#
再次查看
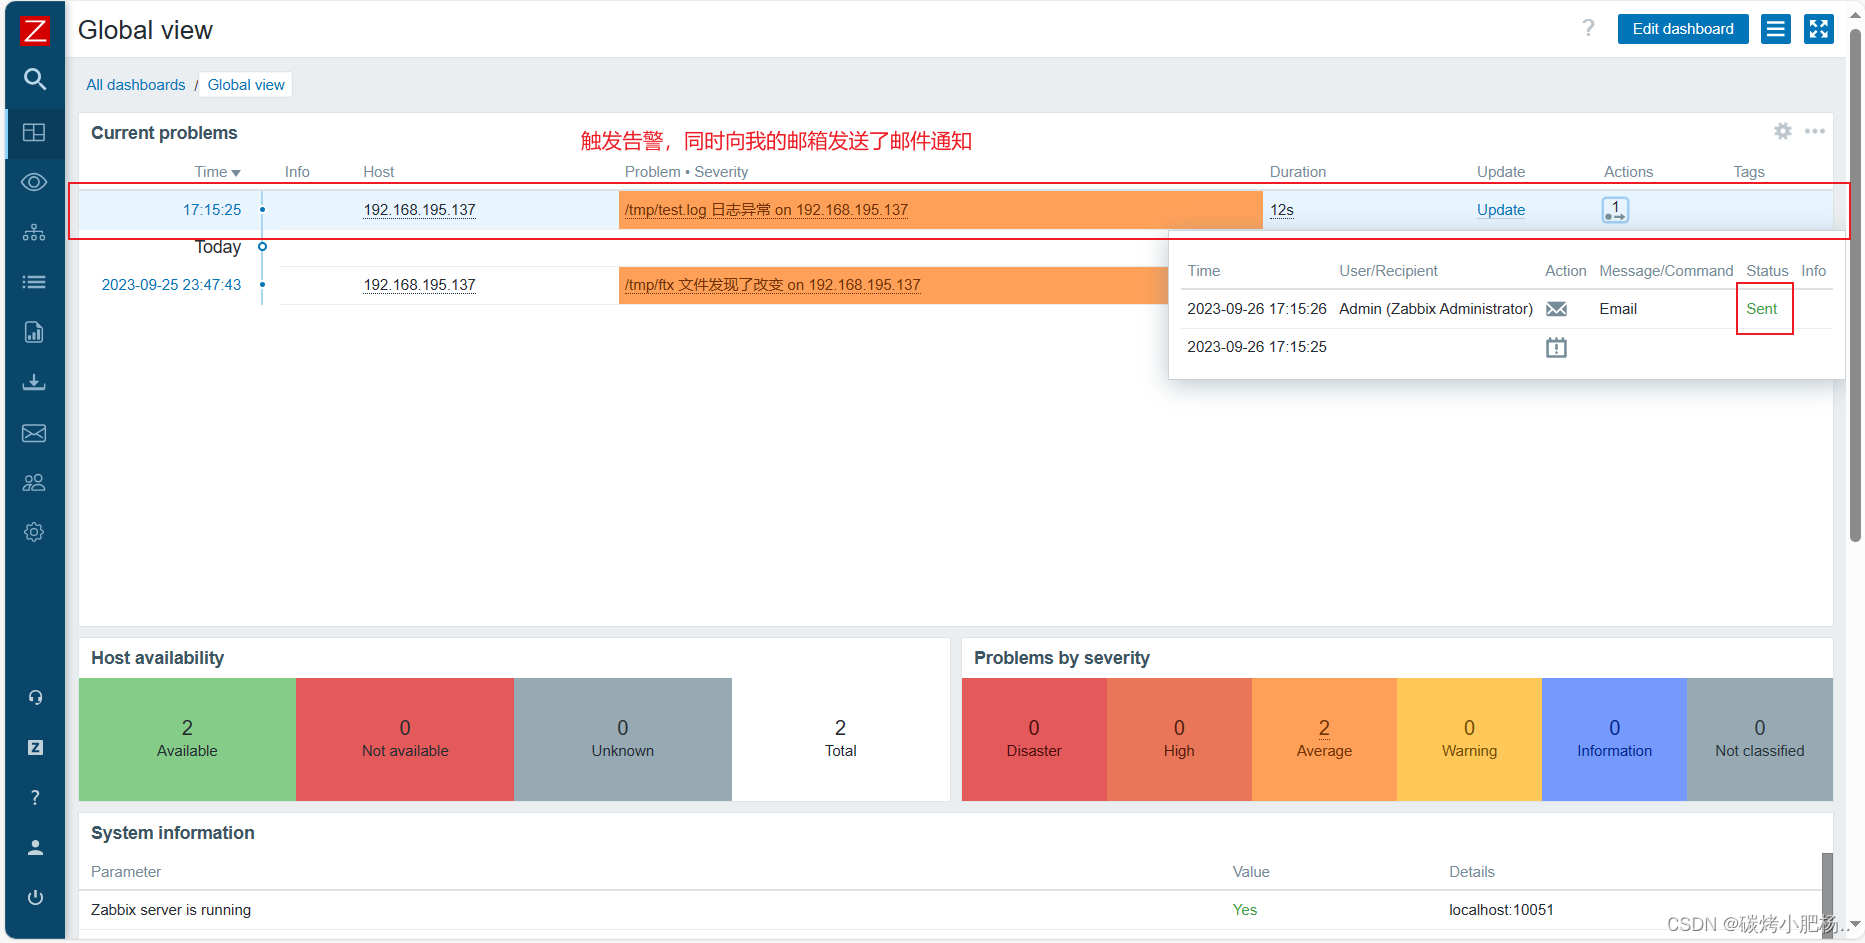
查看邮箱
3.自定义监控mysql主从
3.1配置主库
//关闭防火墙和selinux
[root@CentOS8 ~]# systemctl stop firewalld.service
[root@CentOS8 ~]# setenforce 0

//安装mariadb服务
[root@CentOS8 ~]# yum -y install mariadb mariadb-server

//设置服务开机自启
[root@CentOS8 ~]# systemctl enable --now  mariadb.service
Created symlink /etc/systemd/system/mysql.service → /usr/lib/systemd/system/mariadb.service.
Created symlink /etc/systemd/system/mysqld.service → /usr/lib/systemd/system/mariadb.service.
Created symlink /etc/systemd/system/multi-user.target.wants/mariadb.service → /usr/lib/systemd/system/mariadb.service.
[root@CentOS8 ~]# ss -antl
State          Recv-Q          Send-Q                      Local Address:Port                     Peer Address:Port
LISTEN         0               128                               0.0.0.0:22                            0.0.0.0:*
LISTEN         0               128                                  [::]:22                               [::]:*
LISTEN         0               80                                      *:3306                                *:*

//设置mysql密码,并创建授权用户
[root@CentOS8 ~]# mysql
Welcome to the MariaDB monitor.  Commands end with ; or \g.
Your MariaDB connection id is 8
Server version: 10.3.28-MariaDB MariaDB Server

Copyright (c) 2000, 2018, Oracle, MariaDB Corporation Ab and others.

Type 'help;' or '\h' for help. Type '\c' to clear the current input statement.

MariaDB [(none)]> set password = password('12345678');
Query OK, 0 rows affected (0.000 sec)

MariaDB [(none)]> grant replication slave on *.* to 'yyr'@'192.168.195.137' identified by 'yyr123456';
Query OK, 0 rows affected (0.000 sec)

MariaDB [(none)]> flush privileges;
Query OK, 0 rows affected (0.000 sec)

MariaDB [(none)]> quit
Bye

//编辑配置文件
[root@CentOS8 ~]# vim /etc/my.cnf.d/mariadb-server.cnf
[root@CentOS8 ~]# grep -A7 '^\[mysqld' /etc/my.cnf.d/mariadb-server.cnf
[mysqld]
datadir=/var/lib/mysql
socket=/var/lib/mysql/mysql.sock
log-error=/var/log/mariadb/mariadb.log
pid-file=/run/mariadb/mariadb.pid

log-bin=mysql_bin    //添加这两行
server-id=10

//修改配置文件后重启服务
[root@CentOS8 ~]# systemctl restart mariadb.service

[root@CentOS8 ~]# mysql -uroot -p12345678
Welcome to the MariaDB monitor.  Commands end with ; or \g.
Your MariaDB connection id is 9
Server version: 10.3.28-MariaDB-log MariaDB Server

Copyright (c) 2000, 2018, Oracle, MariaDB Corporation Ab and others.

Type 'help;' or '\h' for help. Type '\c' to clear the current input statement.

MariaDB [(none)]> show master status;
+------------------+----------+--------------+------------------+
| File             | Position | Binlog_Do_DB | Binlog_Ignore_DB |
+------------------+----------+--------------+------------------+
| mysql_bin.000002 |      328 |              |                  |
+------------------+----------+--------------+------------------+
1 row in set (0.001 sec)

配置主库完成
3.2配置从库
//关闭防火墙和selinux
[root@centos2 ~]# systemctl stop firewalld.service
[root@centos2 ~]# setenforce 0

//编辑配置文件
[root@centos2 ~]# vim /etc/my.cnf.d/mariadb-server.cnf
[root@centos2 ~]# grep -A7 '^\[mysqld' /etc/my.cnf.d/mariadb-server.cnf
[mysqld]
datadir=/var/lib/mysql
socket=/var/lib/mysql/mysql.sock
log-error=/var/log/mariadb/mariadb.log
pid-file=/run/mariadb/mariadb.pid

server-id=20                     //添加入下两行
relay-log=mysql-relay-bin

//修改配置文件后重启服务
[root@centos2 ~]# systemctl restart mariadb.service

//设置mysql密码
[root@centos2 ~]# mysql
Welcome to the MariaDB monitor.  Commands end with ; or \g.
Your MariaDB connection id is 8
Server version: 10.3.28-MariaDB MariaDB Server

Copyright (c) 2000, 2018, Oracle, MariaDB Corporation Ab and others.

Type 'help;' or '\h' for help. Type '\c' to clear the current input statement.

MariaDB [(none)]> set password = password('12345678');
Query OK, 0 rows affected (0.000 sec)

MariaDB [(none)]> change master to
    -> master_host='192.168.195.136',
    -> master_user='yyr',
    -> master_password='yyr123456',
    -> master_log_file='mysql_bin.000002',
    -> master_log_pos=328;
Query OK, 0 rows affected (0.004 sec)

MariaDB [(none)]> start slave;
Query OK, 0 rows affected (0.001 sec)

MariaDB [(none)]> show slave status\G;
*************************** 1. row ***************************
                Slave_IO_State: Waiting for master to send event
                   Master_Host: 192.168.195.136
                   Master_User: yyr
                   Master_Port: 3306
                 Connect_Retry: 60
               Master_Log_File: mysql_bin.000002
           Read_Master_Log_Pos: 328
                Relay_Log_File: mysql-relay-bin.000002
                 Relay_Log_Pos: 555
         Relay_Master_Log_File: mysql_bin.000002
              Slave_IO_Running: Yes               //出现两个yes表示成功
             Slave_SQL_Running: Yes
               Replicate_Do_DB:
           Replicate_Ignore_DB:
            Replicate_Do_Table:
        Replicate_Ignore_Table:
       Replicate_Wild_Do_Table:
   Replicate_Wild_Ignore_Table:
                    Last_Errno: 0
                    Last_Error:
                  Skip_Counter: 0
           Exec_Master_Log_Pos: 328
               Relay_Log_Space: 864
               Until_Condition: None
                Until_Log_File:
                 Until_Log_Pos: 0
            Master_SSL_Allowed: No
            Master_SSL_CA_File:
            Master_SSL_CA_Path:
               Master_SSL_Cert:
             Master_SSL_Cipher:
                Master_SSL_Key:
         Seconds_Behind_Master: 0
 Master_SSL_Verify_Server_Cert: No
                 Last_IO_Errno: 0
                 Last_IO_Error:
                Last_SQL_Errno: 0
                Last_SQL_Error:
   Replicate_Ignore_Server_Ids:
              Master_Server_Id: 10
                Master_SSL_Crl:
            Master_SSL_Crlpath:
                    Using_Gtid: No
                   Gtid_IO_Pos:
       Replicate_Do_Domain_Ids:
   Replicate_Ignore_Domain_Ids:
                 Parallel_Mode: conservative
                     SQL_Delay: 0
           SQL_Remaining_Delay: NULL
       Slave_SQL_Running_State: Slave has read all relay log; waiting for the slave I/O thread to update it
              Slave_DDL_Groups: 0
Slave_Non_Transactional_Groups: 0
    Slave_Transactional_Groups: 0
1 row in set (0.000 sec)

ERROR: No query specified

MariaDB [(none)]>
3.3编写匹配mysql主从状态的脚本
[root@centos2 ~]# cd /script/
[root@centos2 script]# vim mysql_status.sh
[root@centos2 script]# cat mysql_status.sh
#!/bin/bash

count=$(mysql -uroot -p12345678 -e 'show slave status\G;' | grep -i 'running:' | grep -c 'Yes')

if [ $count -ne 2 ];then
    echo '1'
else
    echo '0'
fi

conut表示的是匹配到的Yes的个数,-c选项是匹配到关键词的个数,将结果写入判断,若有两个yes则打印0,表示主从状态没问题,若不为两个yes,则打印1表示主从状态有问题
3.4编辑被监控端配置文件
//创建自定义监控任务
[root@centos2 etc]# vim zabbix_agentd.conf
[root@centos2 etc]# tail -1 zabbix_agentd.conf
UserParameter=check_mysql_status,/bin/bash /script/mysql_status.sh

//修改配置文件后需重启服务,重新去读配置文件
[root@centos2 etc]# systemctl restart zabbix_agentd.service

//创建自定义监控任务后,我们需要在server端测试一下是否能够接收到被监控端的值
[root@client ~]# zabbix_get -s 192.168.195.137 -k check_mysql_status
0
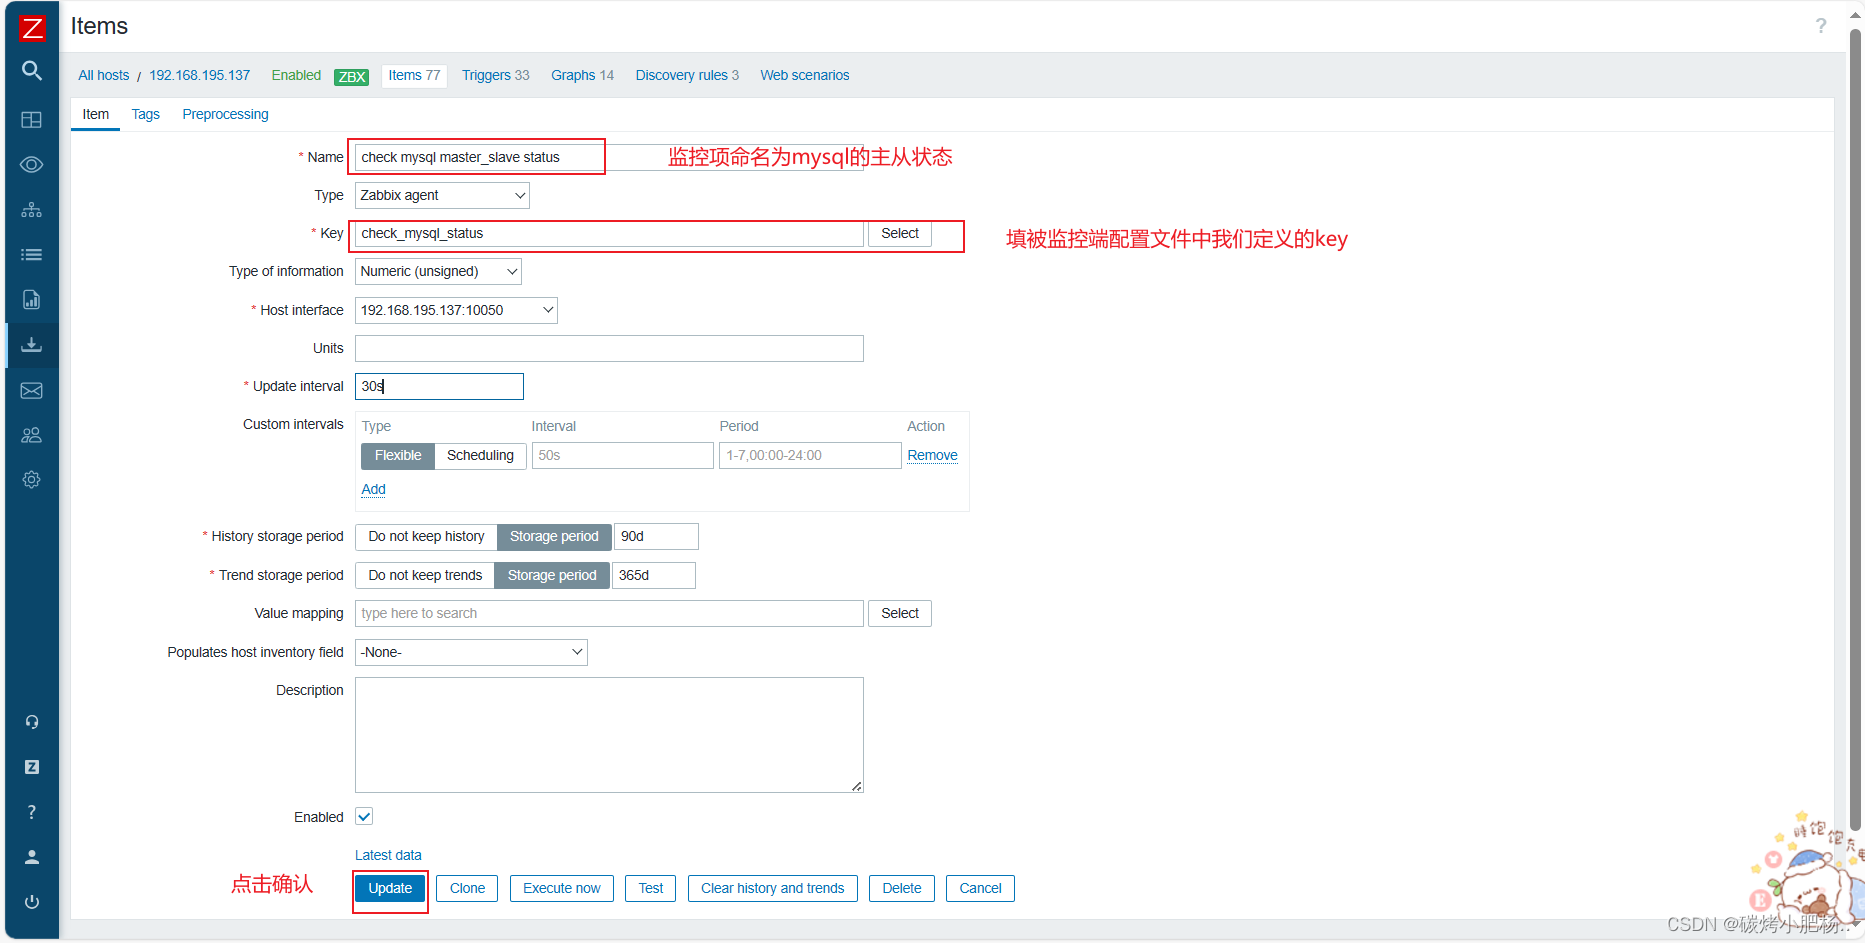
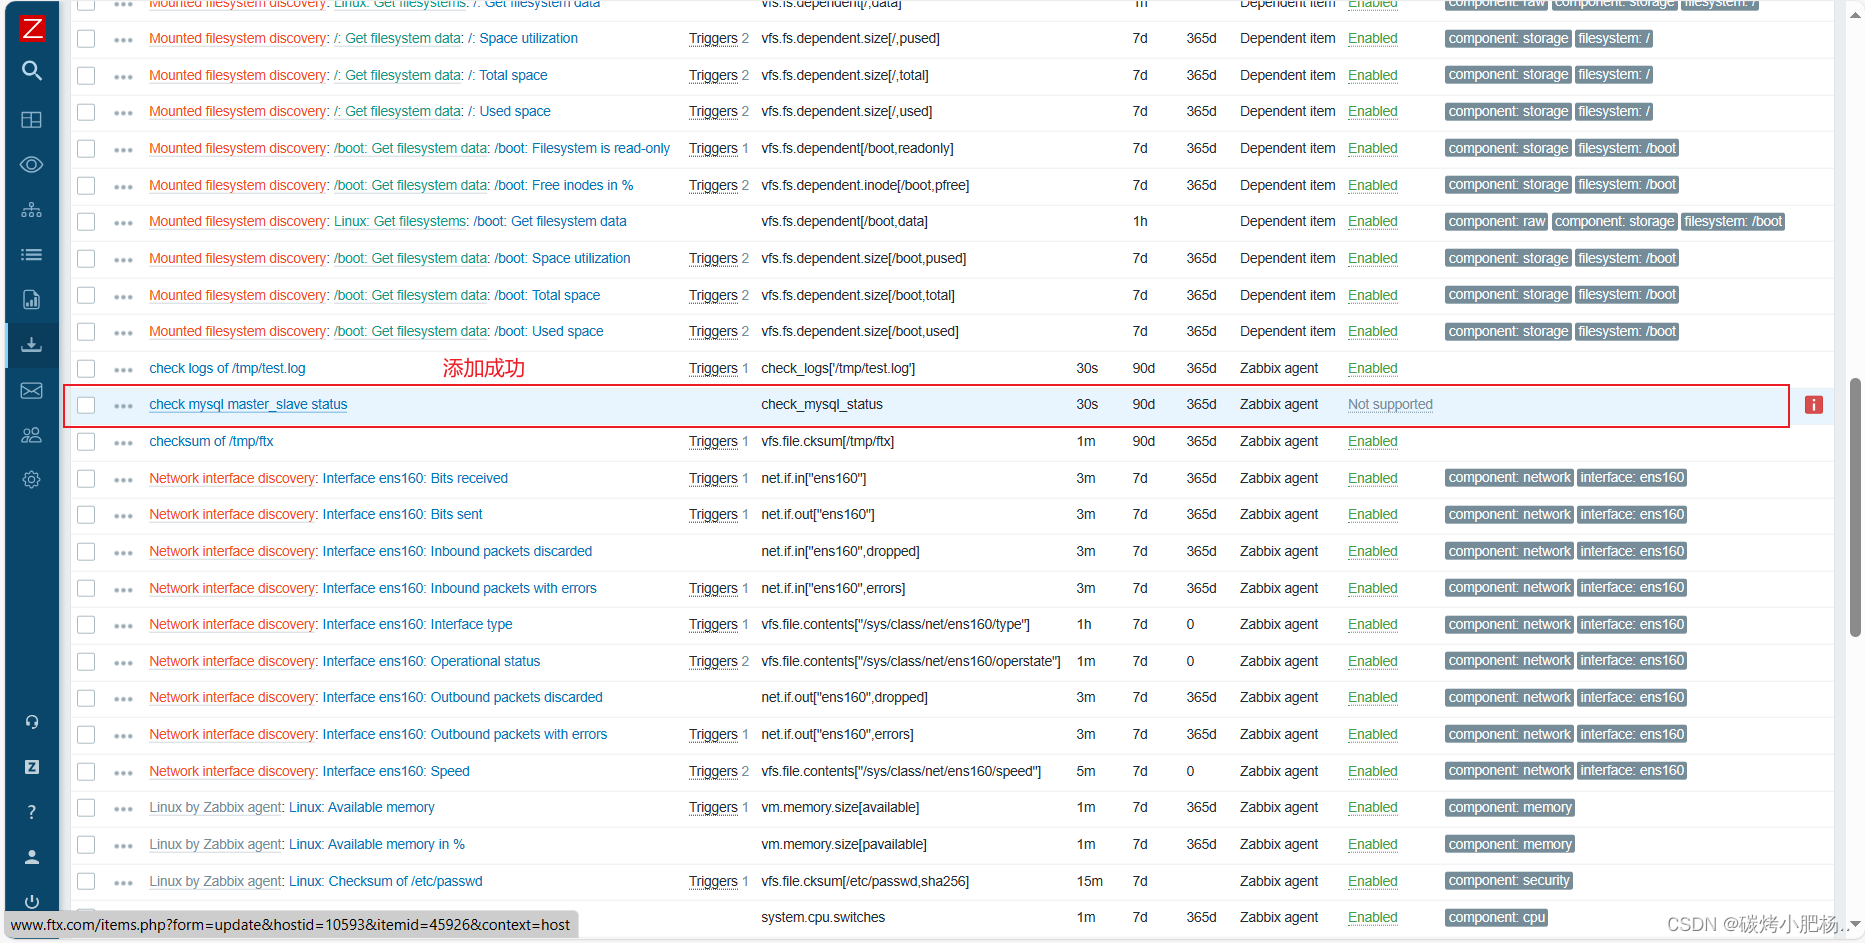
3.5创建监控项和触发器
创建监控项
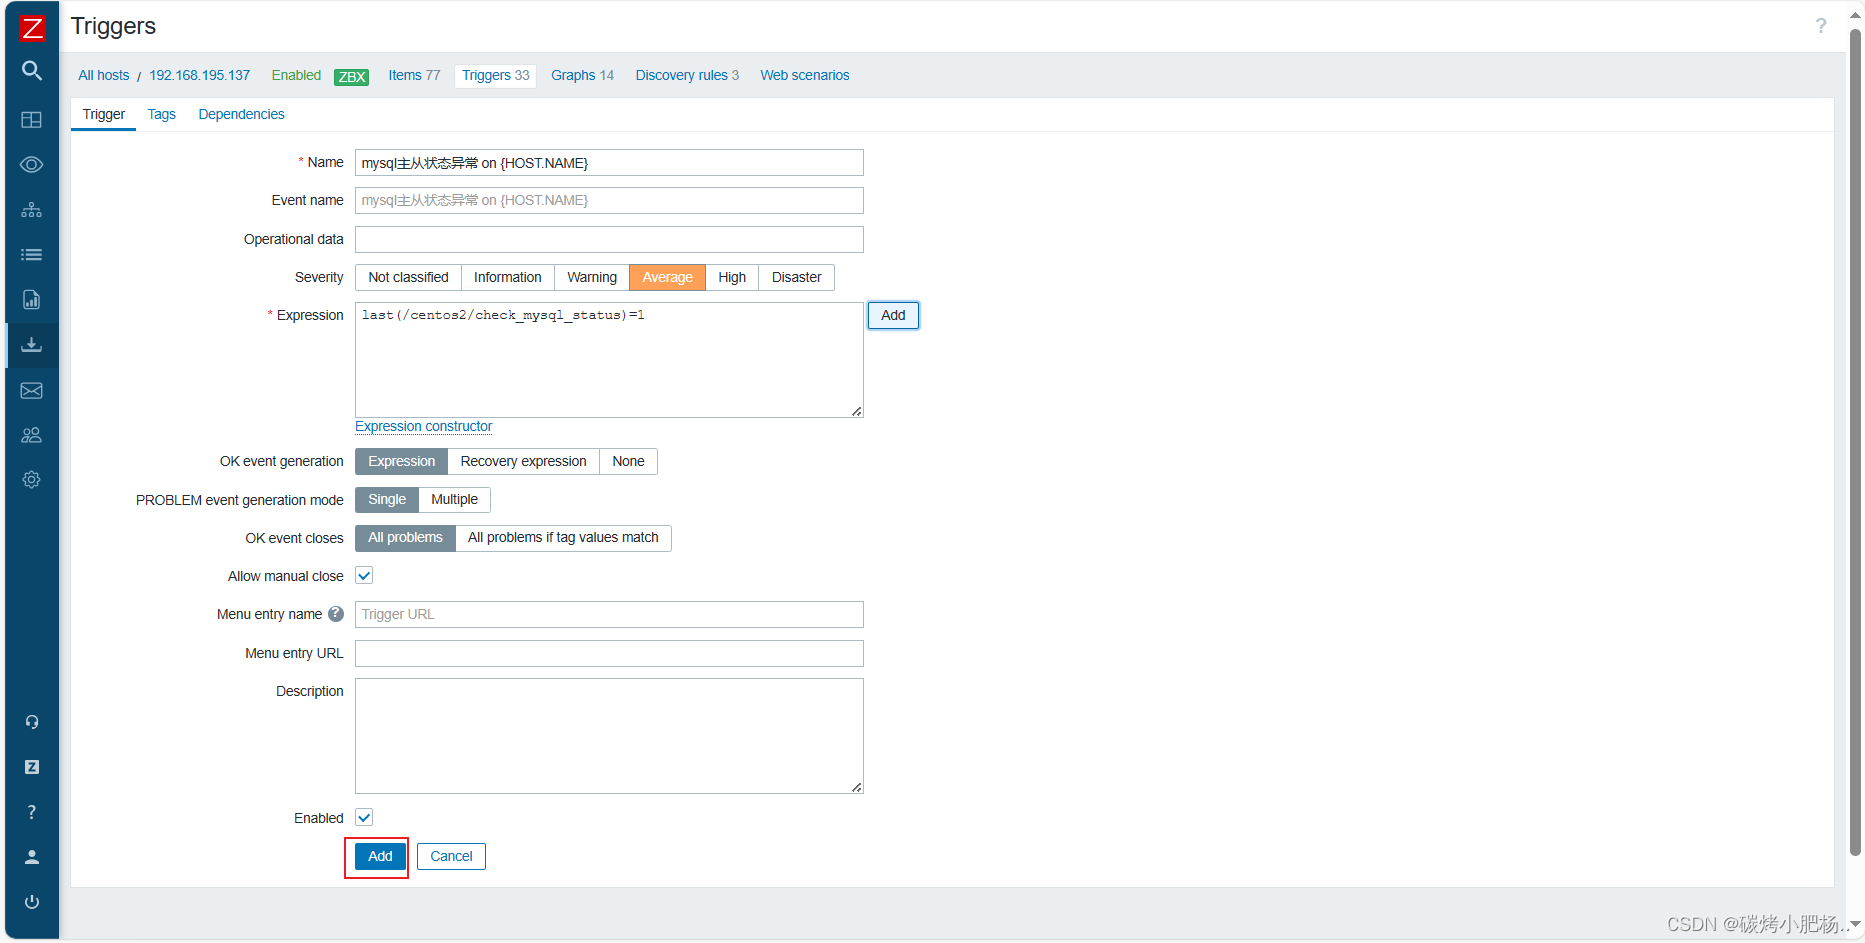
创建触发器
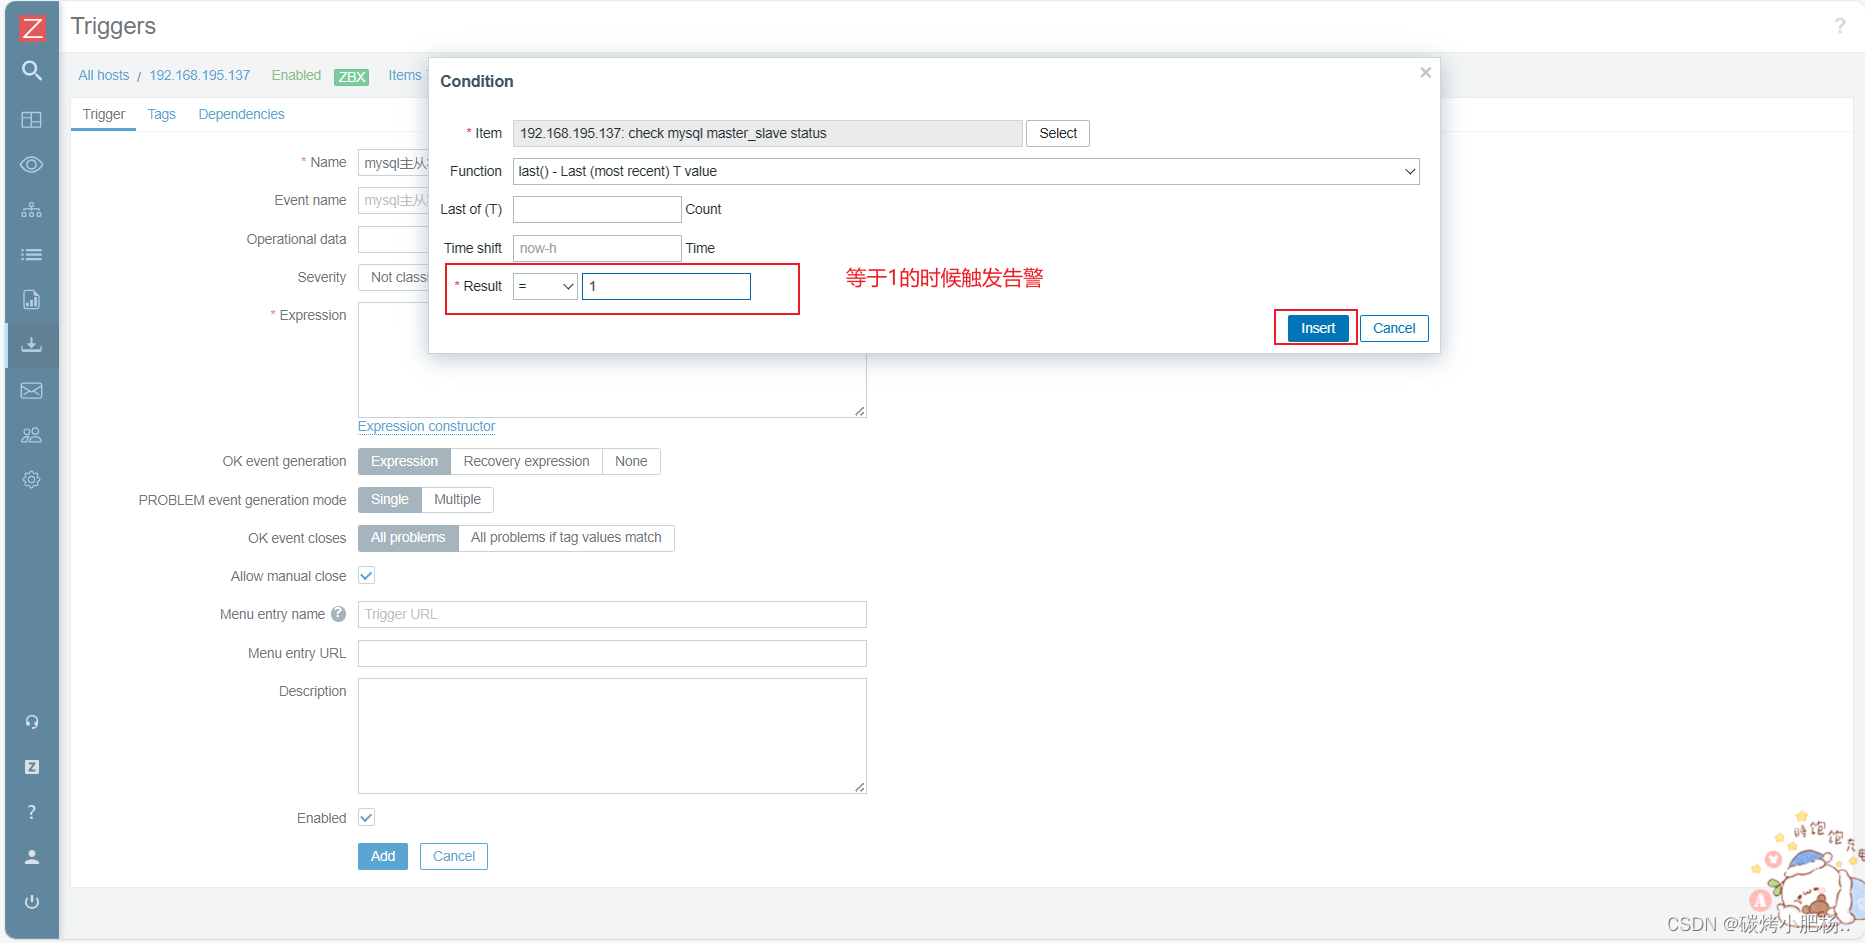
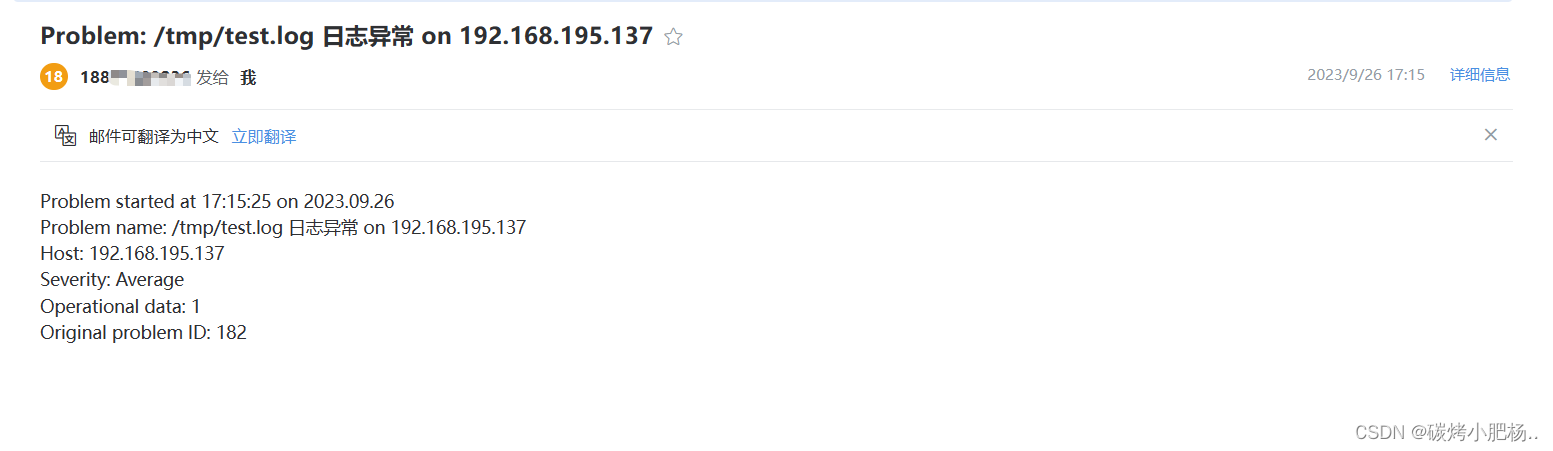
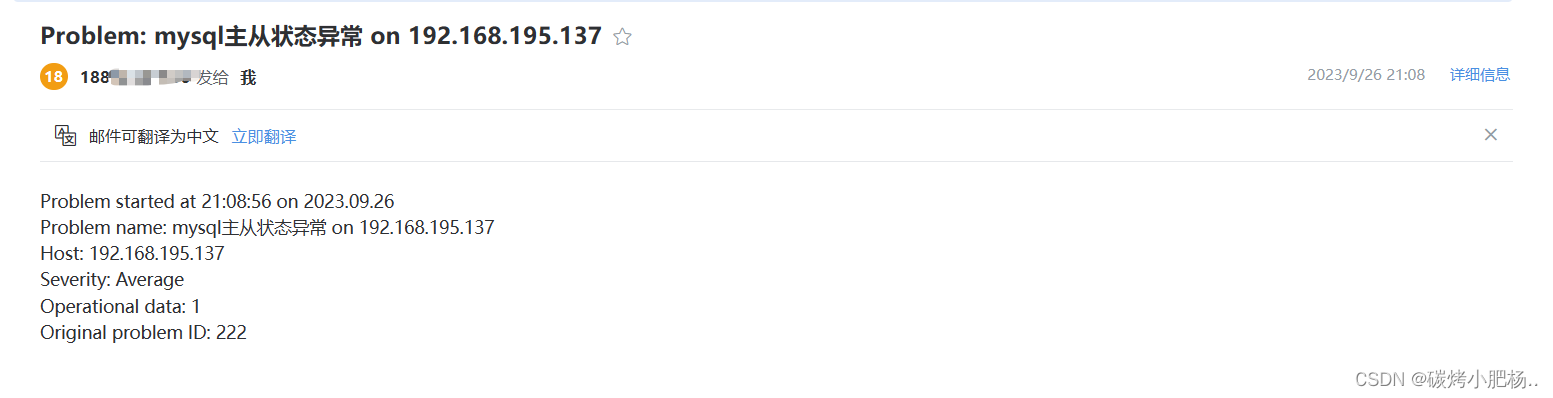
3.6测试
开启防火墙使主从状态断开联系,模拟告警
[root@CentOS8 ~]# systemctl start firewalld.service

[root@centos2 script]# mysql -uroot -p12345678 -e 'stop slave;'
[root@centos2 script]# mysql -uroot -p12345678 -e 'start slave;'
[root@centos2 script]# mysql -uroot -p12345678 -e 'show slave status\G;'
*************************** 1. row ***************************
                Slave_IO_State: Connecting to master
                   Master_Host: 192.168.195.136
                   Master_User: yyr
                   Master_Port: 3306
                 Connect_Retry: 60
               Master_Log_File: mysql_bin.000002
           Read_Master_Log_Pos: 328
                Relay_Log_File: mysql-relay-bin.000003
                 Relay_Log_Pos: 555
         Relay_Master_Log_File: mysql_bin.000002
              Slave_IO_Running: Connecting
             Slave_SQL_Running: Yes
               Replicate_Do_DB:
           Replicate_Ignore_DB:
            Replicate_Do_Table:
        Replicate_Ignore_Table:
       Replicate_Wild_Do_Table:
   Replicate_Wild_Ignore_Table:
                    Last_Errno: 0
                    Last_Error:
                  Skip_Counter: 0
           Exec_Master_Log_Pos: 328
               Relay_Log_Space: 1163
               Until_Condition: None
                Until_Log_File:
                 Until_Log_Pos: 0
            Master_SSL_Allowed: No
            Master_SSL_CA_File:
            Master_SSL_CA_Path:
               Master_SSL_Cert:
             Master_SSL_Cipher:
                Master_SSL_Key:
         Seconds_Behind_Master: NULL
 Master_SSL_Verify_Server_Cert: No
                 Last_IO_Errno: 2003
                 Last_IO_Error: error connecting to master 'yyr@192.168.195.136:3306' - retry-time: 60  maximum-retries: 86400  message: Can't connect to MySQL server on '192.168.195.136' (113 "No route to host")
                Last_SQL_Errno: 0
                Last_SQL_Error:
   Replicate_Ignore_Server_Ids:
              Master_Server_Id: 10
                Master_SSL_Crl:
            Master_SSL_Crlpath:
                    Using_Gtid: No
                   Gtid_IO_Pos:
       Replicate_Do_Domain_Ids:
   Replicate_Ignore_Domain_Ids:
                 Parallel_Mode: conservative
                     SQL_Delay: 0
           SQL_Remaining_Delay: NULL
       Slave_SQL_Running_State: Slave has read all relay log; waiting for the slave I/O thread to update it
              Slave_DDL_Groups: 0
Slave_Non_Transactional_Groups: 0
    Slave_Transactional_Groups: 0
成功触发
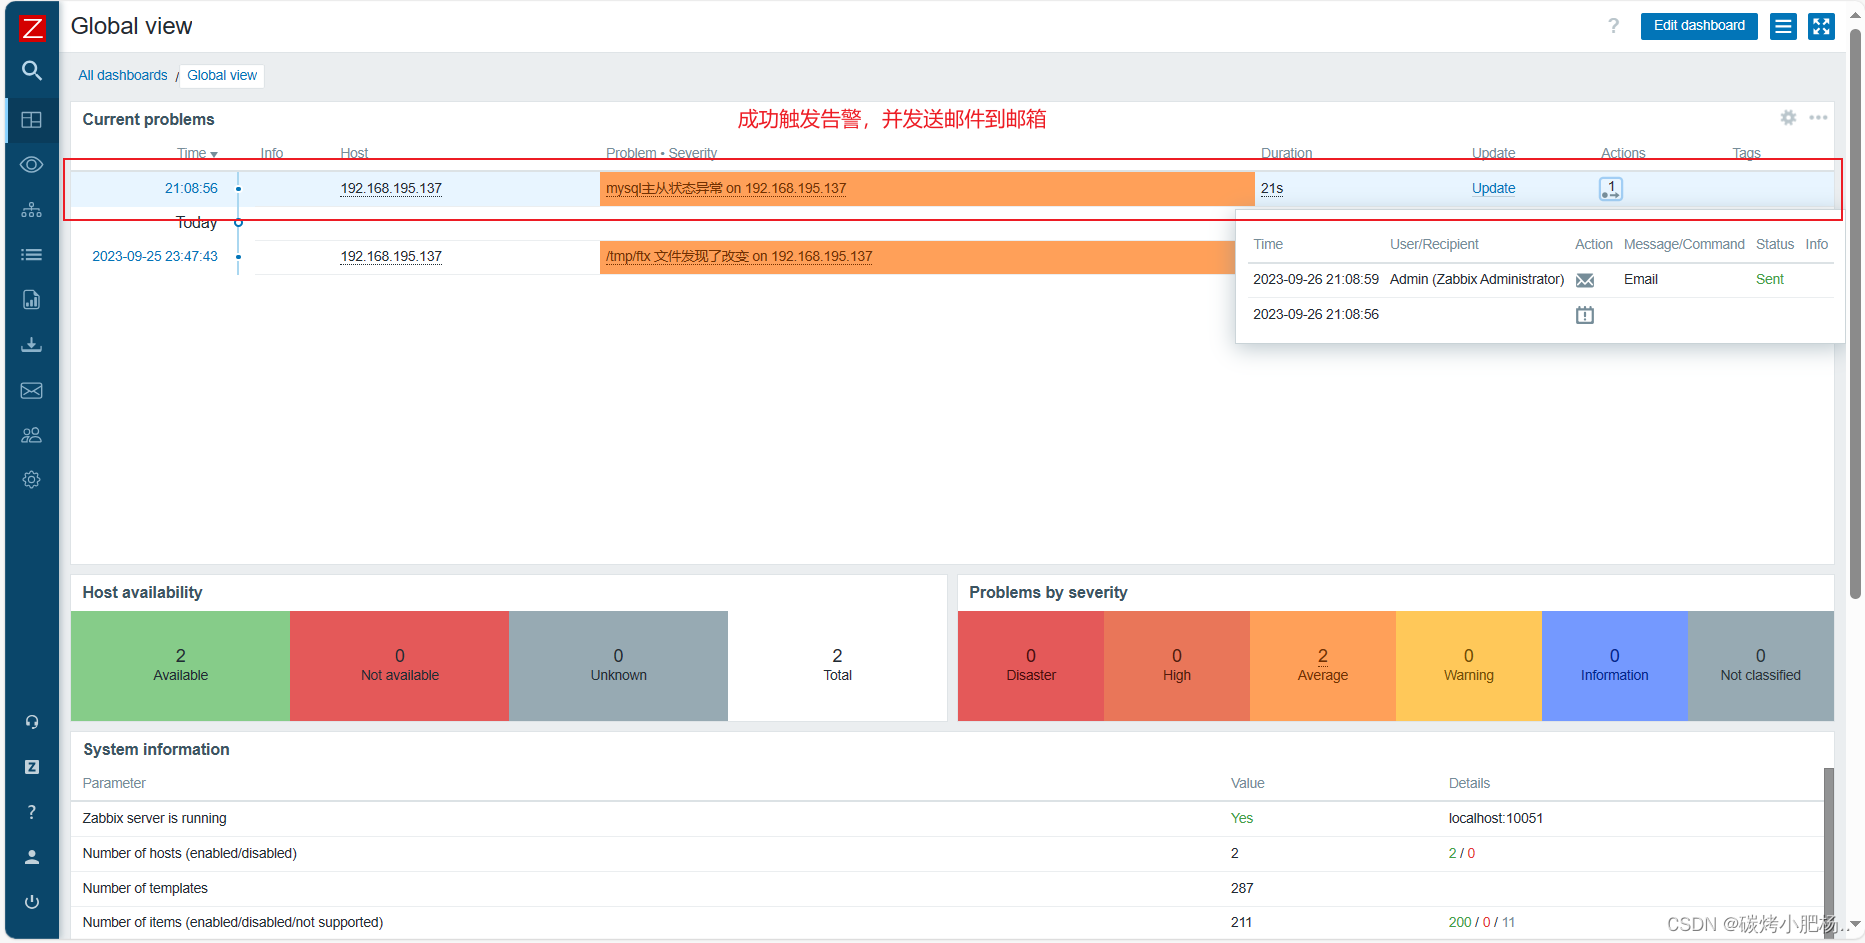
查看邮箱
4.自定义监控mysql延迟
获取mysql延迟的值,看的是show slave status\G;中Seconds_Behind_Master:的值
4.1编写获取show slave status\G;中Seconds_Behind_Master:的值的脚本
[root@centos2 script]# vim mysql_delay.sh
[root@centos2 script]# cat mysql_delay.sh
#!/bin/bash

mysql -uroot -p12345678 -e 'show slave status\G' | grep 'Seconds_Behind_Master:' | awk '{print $NF}'
[root@centos2 script]# chmod +x mysql_delay.sh
4.2编辑被监控端的配置文件
//创建自定义监控任务
[root@centos2 etc]# vim zabbix_agentd.conf
[root@centos2 etc]# tail -1 zabbix_agentd.conf
UserParameter=check_mysql_delay,/bin/bash /script/mysql_delay.sh

//修改配置文件后需重启服务,重新读取配置文件
[root@centos2 etc]# systemctl restart zabbix_agentd.service

//创建自定义监控任务后,我们需要在server端测试一下是否能够接收到被监控端的值
[root@client ~]# zabbix_get -s 192.168.195.137 -k check_mysql_delay
0
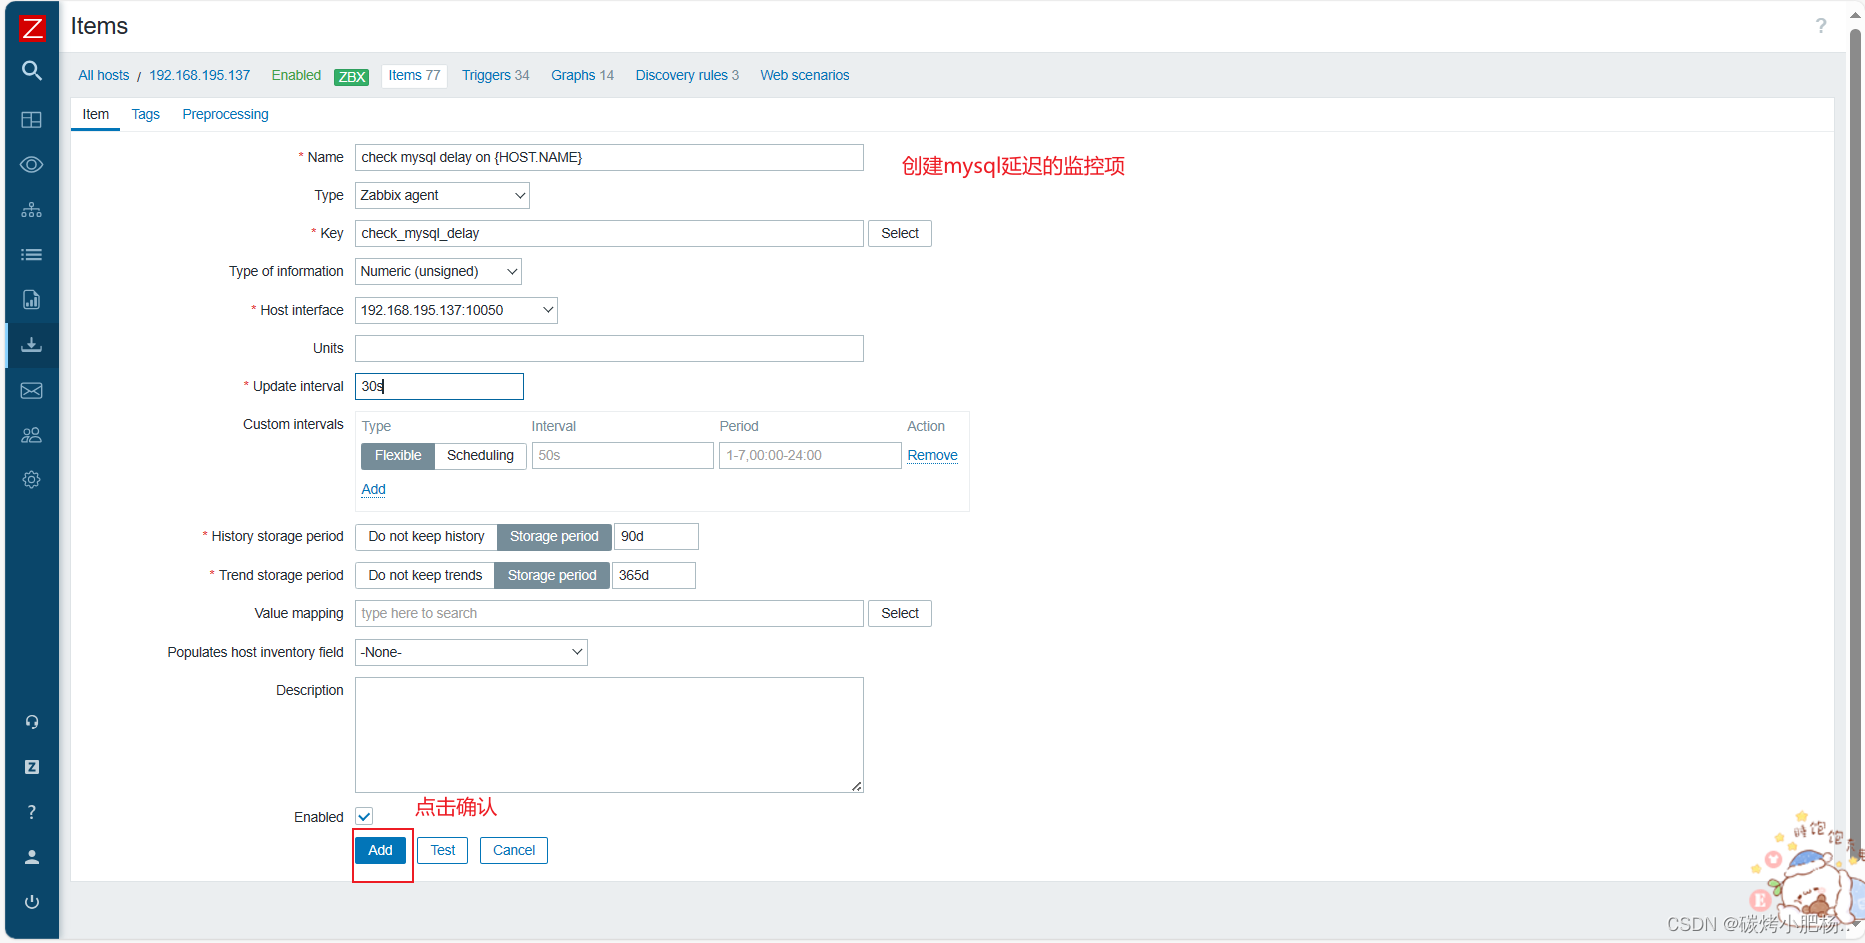
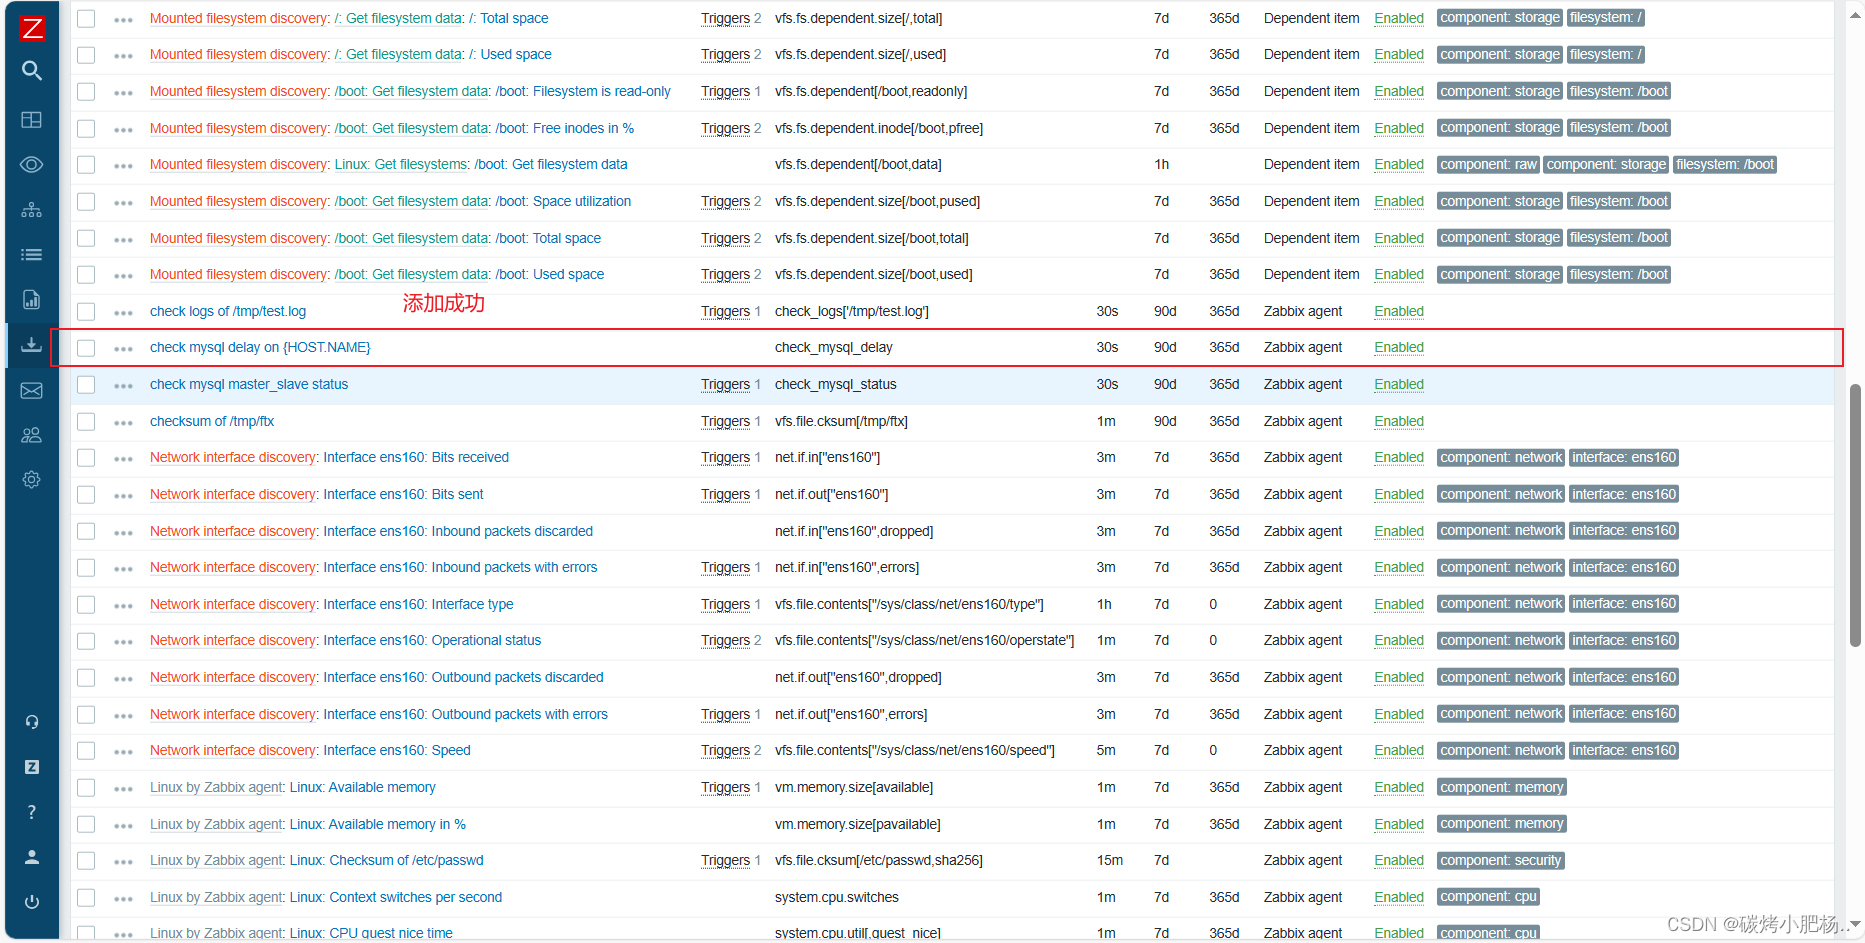
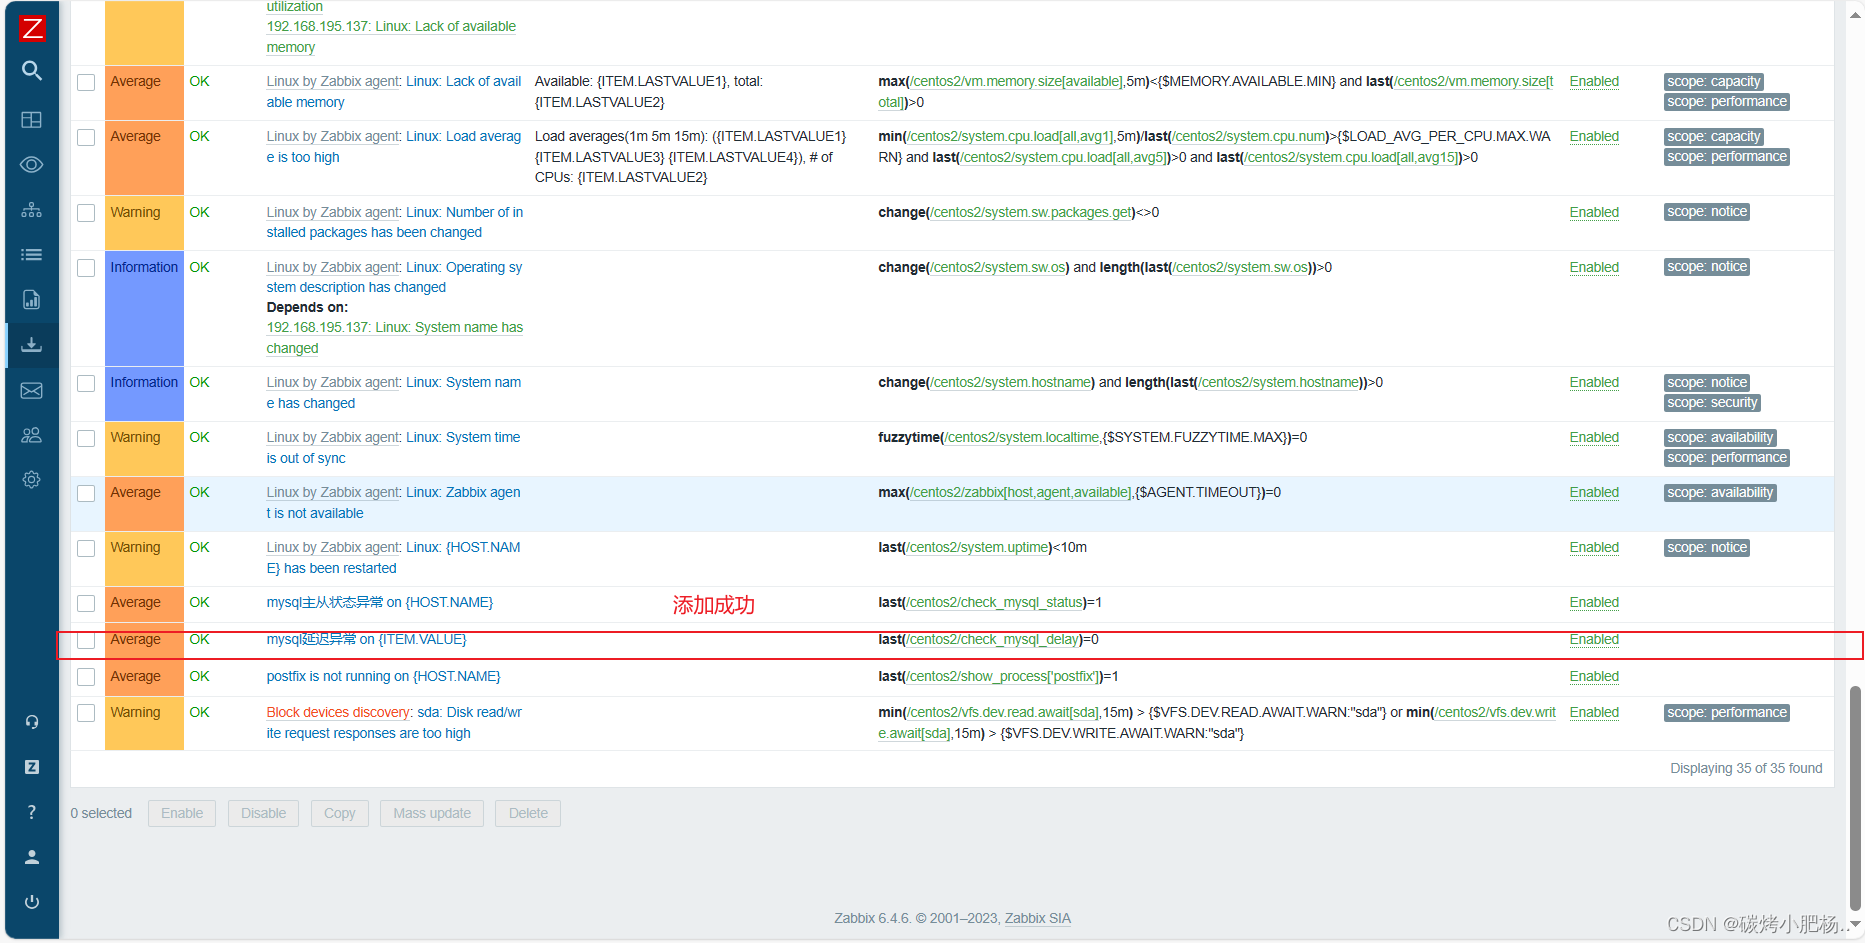
4.3创建监控项和触发器
创建监控项
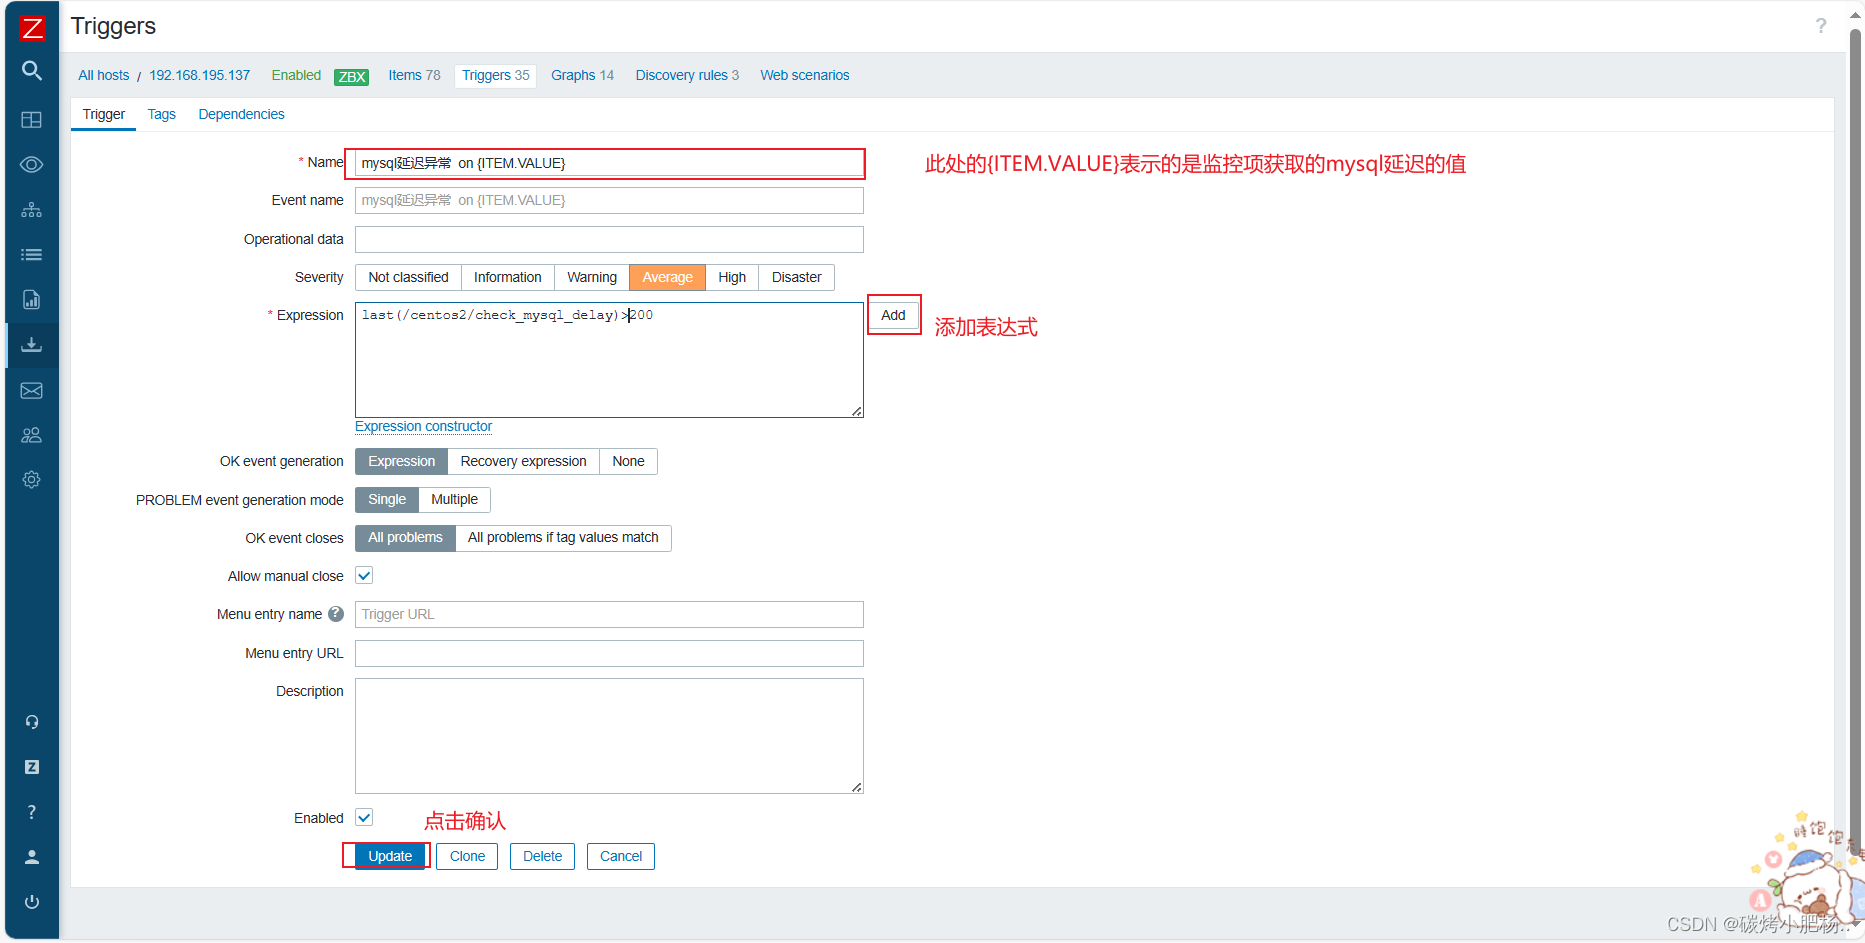
创建触发器
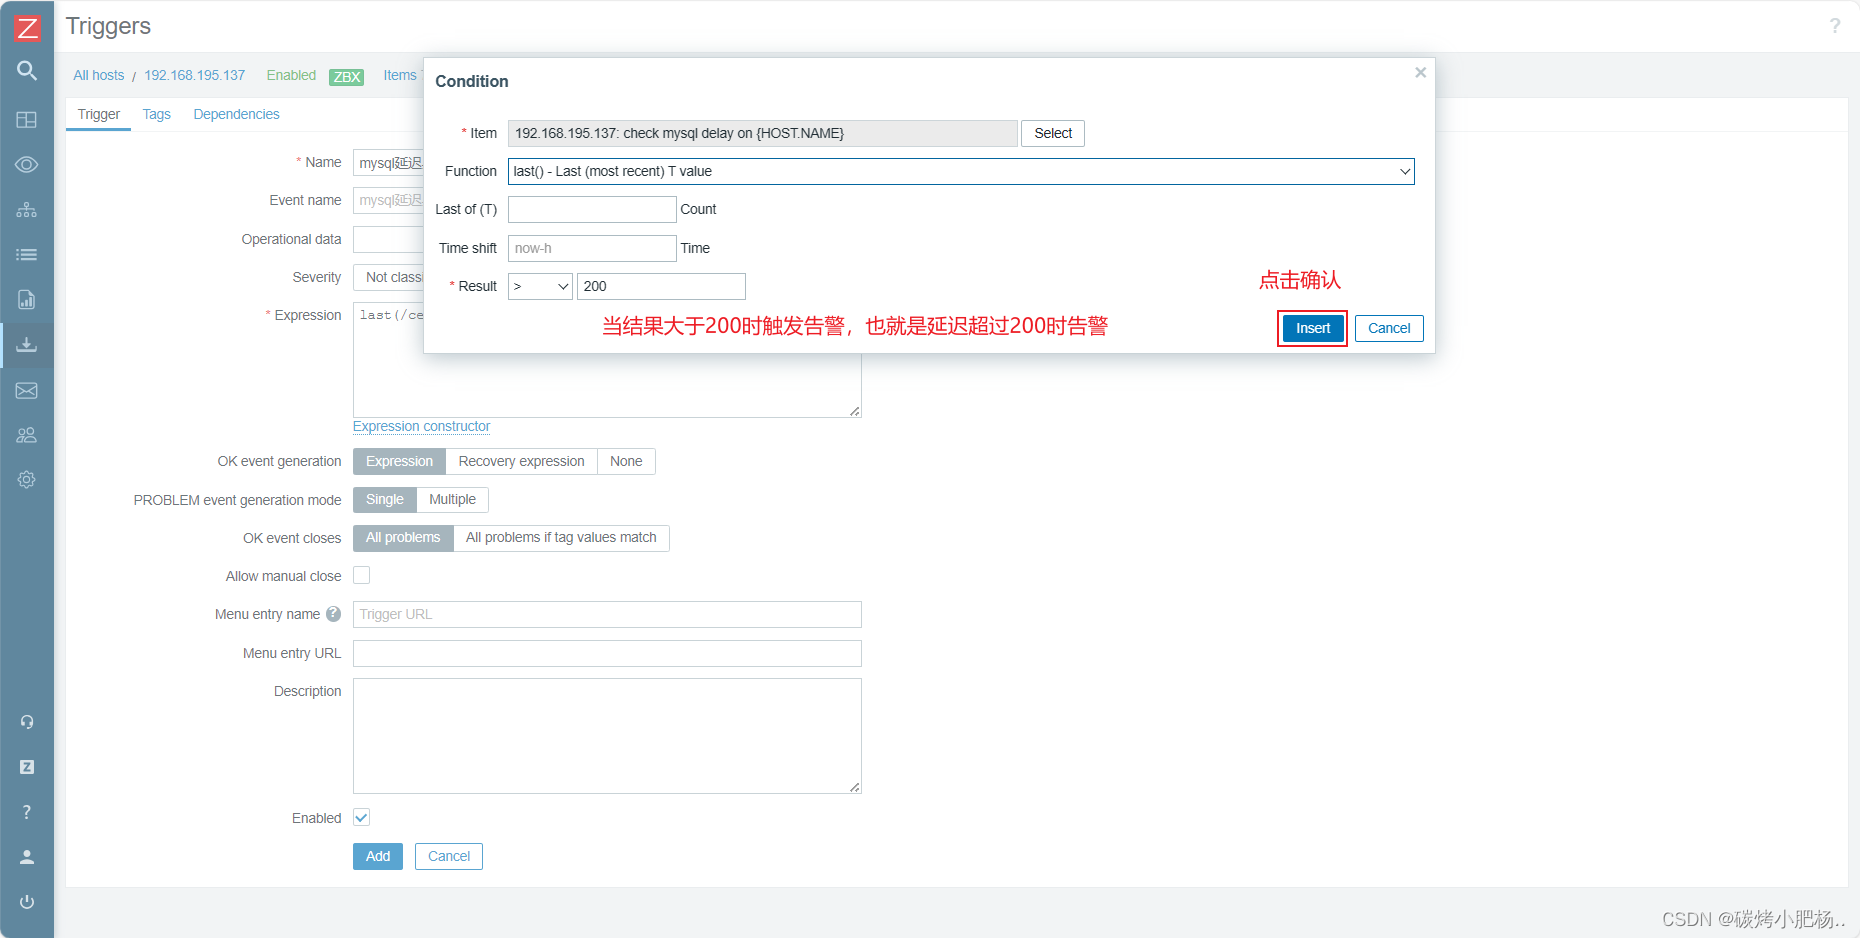
4.4测试
当我们的数据量过大导致mysql延迟达到200一下则会告警

错误排查报告
//出现此类问题,提示我们权限被拒绝
[root@client ~]# zabbix_get -s 192.168.195.137 -k check_logs['/tmp/test.log']
Traceback (most recent call last):
  File "/script/log.py", line 84, in <module>
    result = getResult(sys.argv[1],seekfile,tagkey)
  File "/script/log.py", line 73, in getResult
    with open(seekfile,'w') as sf:
PermissionError: [Errno 13] Permission denied: '/tmp/logseek'

出现此问题的原因可能是我们说用到的文件已经被创建,而且是以管理员的身份创建(或其他用户身份),而我们用于监控的用户时zabbix,所以导致无权访问。

//解决方法:
将我们的要监控的日志文件和会用到的文件修改权限,让我们的zabbix用户能够访问。


 1750
1750


 被折叠的 条评论
为什么被折叠?
被折叠的 条评论
为什么被折叠?
 到【灌水乐园】发言


