


💥💥💞💞欢迎来到本博客❤️❤️💥💥
🏆博主优势:🌞🌞🌞博客内容尽量做到思维缜密,逻辑清晰,为了方便读者。
⛳️座右铭:行百里者,半于九十。
📋📋📋本文目录如下:🎁🎁🎁
目录
💥1 概述
摘要
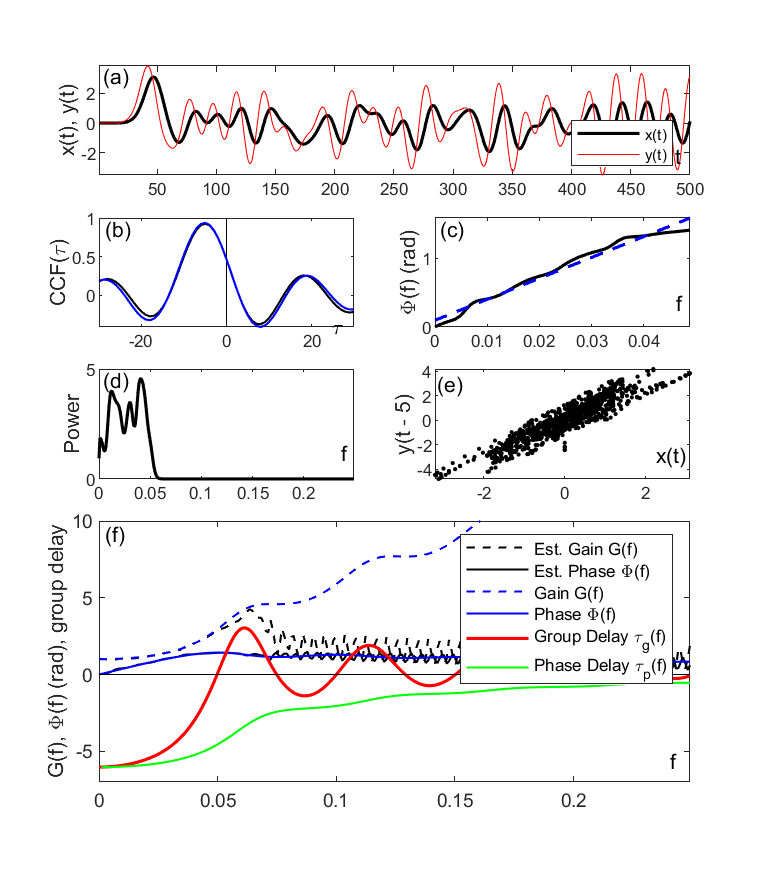
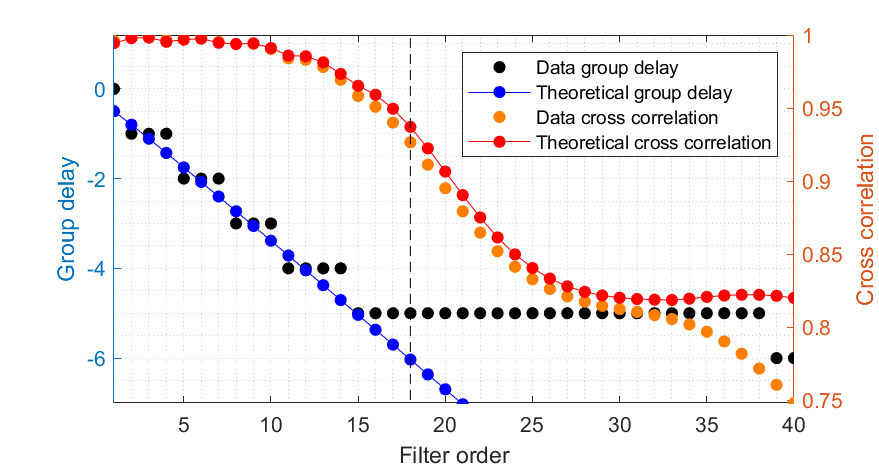
本文介绍了一种具有延迟反馈的滤波器,其具有负群延迟。该滤波器由多个延迟反馈项组成,导致基带频率下出现负群延迟。它可用于实时预测带限信号。该滤波器是通用的,因为它不依赖于信号的特定模型。具体而言,只要要预测的信号是带限的,并且具有已知的截止频率,该滤波器就可以在实时内预测信号,预测范围取决于截止频率。文章详细阐述了信号预测是如何由滤波器的负群延迟产生的。其性质,包括稳定性,是通过数值模拟进行推导和演示的。对于混沌系统,在可预测性高的阶段,该滤波器具有预测能力。
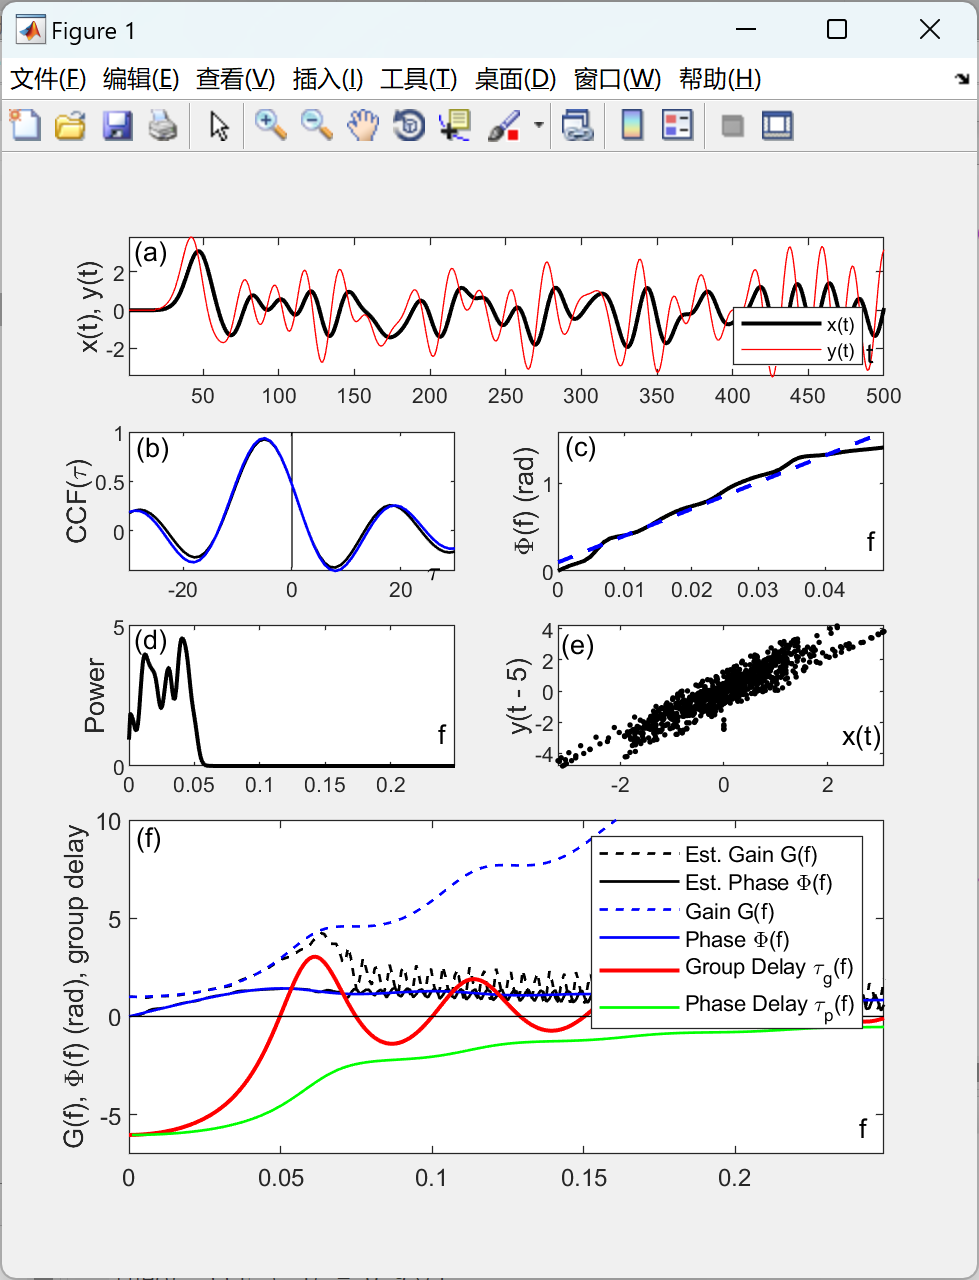
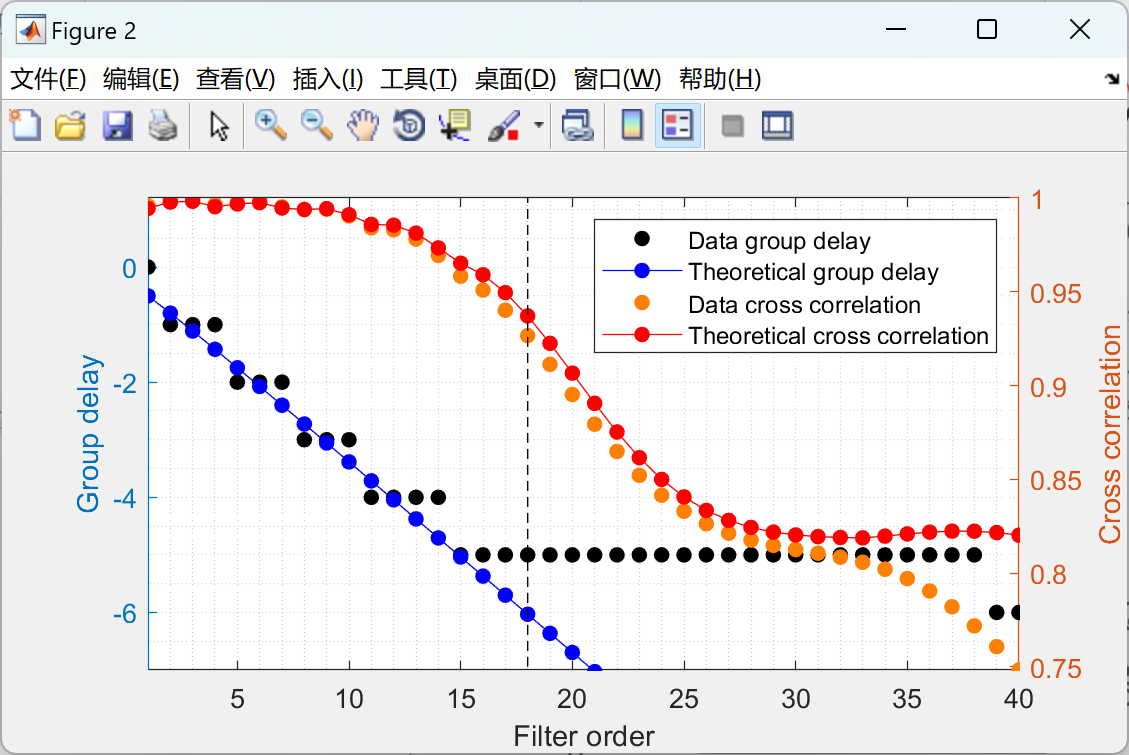
📚2 运行结果
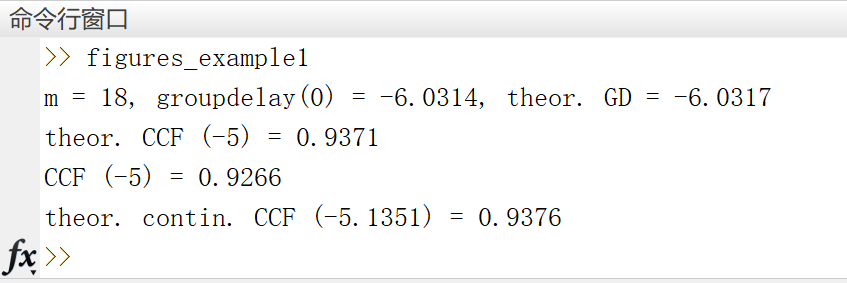
部分代码:
%% Systematic values
sys_GD(m)=-tau_c;
sys_CCF(m)=maxccf;
sys_theoGD(m)=theo_GD;
sys_theoCCF(m)=theoCCF_max;
%% Plotting everything for fixed m
if m==suggestedm
factor=.75;
figure1=figure('position',[0.,100.,factor*650,factor*750],'PaperOrientation','portrait');
subplot(5,2,[1,2])
plot(taxis(range),x(range),'k-','Linewidth',1.5);
axis tight;
hold on
plot(taxis(range),y(range),'r-','Linewidth',.5);
%plot(taxis(range),y(range)/sigma_y,'r','Linewidth',1.5);
axis tight;
legend('x(t)', 'y(t)', 'Location','southeast');
%legend('x(t)', 'y(t)', 'y(t)/\sigma_y', 'Location','southeast');
ylabel('x(t), y(t)','fontsize',10)
ylim([-.5,.5])
axis tight
hold off
%% Manifold
subplot(5,2,6)
laggedy=circshift(y,round(-lag));
plot(x,laggedy,'k.');
axis tight;
ylabel(['y(t - ' num2str(tau_c,2) ')'],'fontsize',10)
%xlim([-.5,.5]); ylim([-.5,.5])
%% Power spectra and frequence response
Pxx=cpsd(x,x,[],[],N);
Pyy=cpsd(y,y,[],[],N);
Pxy=cpsd(x,y,[],[],N);
Kxy=real(Pxy);
Qxy=imag(Pxy);
H_est=Pxy./Pxx;
Phase_est=-atan2(Qxy,Kxy); % correct for unconventional sign in cpsd function
%% Group delay fit
subplot(5,2,4)
[p,S] = polyfit(2*pi*f(fitinterval),Phase_est(fitinterval),1);
fit = polyval(p,2*pi*f(fitinterval));
tau_g=-p(1);
plot(f(fitinterval),Phase_est(fitinterval),'k','Linewidth',1.5)
hold on
plot(f(fitinterval),fit,'b--','Linewidth',1.5)
% legend('\Phi(f)',['Fit, \tau_g=' num2str(tau_g,2)],'Location','northeast')
ylabel('\Phi(f) (rad)','fontsize',10)
axis tight
hold off
%% Data power spectrum
subplot(5,2,5)
plot(f(interval),Pxx(interval),'k','linewidth',1.5)
%hold on; plot(f(interval),Pyy(interval),'r')
ylabel('Power','fontsize',10)
%legend('|P_x|', '|P_y|','Location','southwest');
axis tight
ylim([0,5])
%% Estimated frequency response function
Gain_est=abs(H_est);
subplot(5,2,[7,10])
plot(f(interval),Gain_est(interval),'k--','Linewidth',1);
hold on
plot(f(interval),Phase_est(interval),'k','Linewidth',1);
plot(f(interval),Gain(interval),'b--','Linewidth',1);
plot(f(interval),Phase(interval),'b','Linewidth',1);
plot(f(interval),groupdelay(interval),'r','Linewidth',1.5);
plot(f(interval),phasedelay(interval),'g','Linewidth',1);
plot(f(interval),0*Gain(interval),'k');
ylabel('G(f), \Phi(f) (rad), group delay','fontsize',10)
legend('Est. Gain G(f)','Est. Phase \Phi(f)','Gain G(f)','Phase \Phi(f)','Group Delay \tau_g(f)','Phase Delay \tau_p(f)','location','northeast')
axis tight
ylim([-m/3-1,10])
🎉3 参考文献
文章中一些内容引自网络,会注明出处或引用为参考文献,难免有未尽之处,如有不妥,请随时联系删除。
[1]Henning U. Voss (2017) Universal negative group delay (UNGD) filter.
https://xueshu.baidu.com/usercenter/paper/show?paperid=137d0xg03m1r02n0n25j00n0pg711224&site=xueshu_se&hitarticle=1A delayed-feedback filter with negative group delay - 百度学术


 被折叠的 条评论
为什么被折叠?
被折叠的 条评论
为什么被折叠?
 到【灌水乐园】发言


