


5.1.2.3 交并比
上面我们画出了以点(300,500)为中心,生成的三个锚框,我们可以看到锚框A1 与真实框 G1的重合度比较好。那么如何衡量这三个锚框跟真实框之间的关系呢?在检测任务中,使用交并比(Intersection of Union,IoU)作为衡量指标。这一概念来源于数学中的集合,用来描述两个集合A和B之间的关系,它等于两个集合的交集里面所包含的元素个数,除以它们的并集里面所包含的元素个数,具体计算公式如下:

我们将用这个概念来描述两个框之间的重合度。两个框可以看成是两个像素的集合,它们的交并比等于两个框重合部分的面积除以它们合并起来的面积。下图“交集”中青色区域是两个框的重合面积,图“并集”中蓝色区域是两个框的相并面积。用这两个面积相除即可得到它们之间的交并比,如图7所示。

图7:交并比
假设两个矩形框A和B的位置分别为:
A:[xa1,ya1,xa2,ya2]
B:[xb1,yb1,xb2,yb2]
假如位置关系如图8所示:
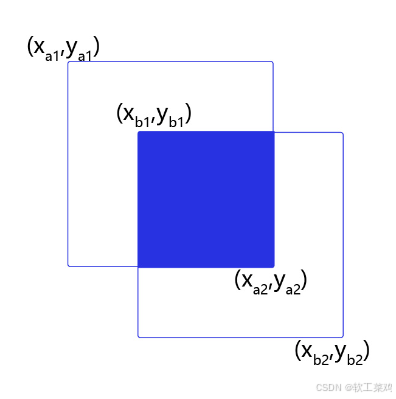
图8:计算交并比

思考:
两个矩形框之间的相对位置关系,除了上面的示意图之外,还有哪些可能,上面的公式能否覆盖所有的情形?
交并比计算程序如下:
In [11]
# 计算IoU,矩形框的坐标形式为xyxy,这个函数会被保存在box_utils.py文件中
def box_iou_xyxy(box1, box2):
    # 获取box1左上角和右下角的坐标
    x1min, y1min, x1max, y1max = box1[0], box1[1], box1[2], box1[3]
    # 计算box1的面积
    s1 = (y1max - y1min + 1.) * (x1max - x1min + 1.)
    # 获取box2左上角和右下角的坐标
    x2min, y2min, x2max, y2max = box2[0], box2[1], box2[2], box2[3]
    # 计算box2的面积
    s2 = (y2max - y2min + 1.) * (x2max - x2min + 1.)

    # 计算相交矩形框的坐标
    xmin = np.maximum(x1min, x2min)
    ymin = np.maximum(y1min, y2min)
    xmax = np.minimum(x1max, x2max)
    ymax = np.minimum(y1max, y2max)
    # 计算相交矩形行的高度、宽度、面积
    inter_h = np.maximum(ymax - ymin + 1., 0.)
    inter_w = np.maximum(xmax - xmin + 1., 0.)
    intersection = inter_h * inter_w
    # 计算相并面积
    union = s1 + s2 - intersection
    # 计算交并比
    iou = intersection / union
    return iou


bbox1 = [100., 100., 200., 200.]
bbox2 = [120., 120., 220., 220.]
iou = box_iou_xyxy(bbox1, bbox2)
print('IoU is {}'.format(iou))
IoU is 0.47402644317607107
In [12]
# 计算IoU,矩形框的坐标形式为xywh
def box_iou_xywh(box1, box2):
    x1min, y1min = box1[0] - box1[2]/2.0, box1[1] - box1[3]/2.0
    x1max, y1max = box1[0] + box1[2]/2.0, box1[1] + box1[3]/2.0
    s1 = box1[2] * box1[3]

    x2min, y2min = box2[0] - box2[2]/2.0, box2[1] - box2[3]/2.0
    x2max, y2max = box2[0] + box2[2]/2.0, box2[1] + box2[3]/2.0
    s2 = box2[2] * box2[3]

    xmin = np.maximum(x1min, x2min)
    ymin = np.maximum(y1min, y2min)
    xmax = np.minimum(x1max, x2max)
    ymax = np.minimum(y1max, y2max)
    inter_h = np.maximum(ymax - ymin, 0.)
    inter_w = np.maximum(xmax - xmin, 0.)
    intersection = inter_h * inter_w

    union = s1 + s2 - intersection
    iou = intersection / union
    return iou

bbox1 = [100., 100., 200., 200.]
bbox2 = [120., 120., 220., 220.]
iou = box_iou_xywh(bbox1, bbox2)
print('IoU is {}'.format(iou))
IoU is 0.6902485659655831
为了直观的展示交并比的大小跟重合程度之间的关系,图9示意了不同交并比下两个框之间的相对位置关系,从 IoU = 0.95 到 IoU = 0.

图9:不同交并比下两个框之间相对位置示意图
问题:
- 什么情况下两个矩形框的IoU等于1?
- 什么情况下两个矩形框的IoU等于0?
5.1.2.4 NMS
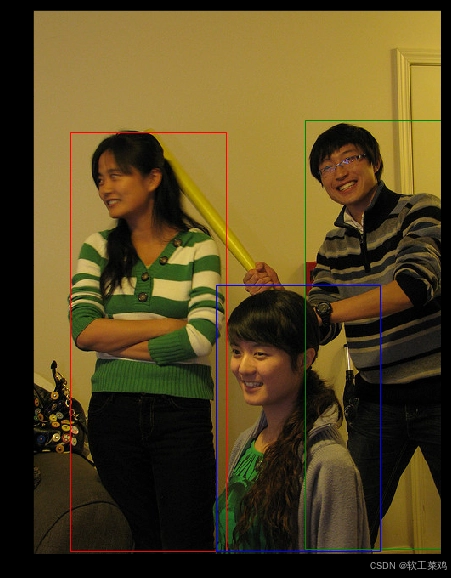
在目标检测过程中,网络对同一个目标可能会产生多个预测框。因此需要消除重叠较大的冗余预测框。具体的处理方法就是非极大值抑制(Non-maximum suppression,NMS)。假设使用模型对图片进行预测,一共输出了11个预测框及其得分,在图上画出预测框。在每个人像周围,都出现了多个预测框,需要消除冗余的预测框以得到最终的预测结果。
In [13]
# 画图展示目标物体边界框
import numpy as np
import matplotlib.pyplot as plt
import matplotlib.patches as patches
from matplotlib.image import imread
import math

# 定义画矩形框的程序
def draw_rectangle(currentAxis, bbox, edgecolor = 'k', facecolor = 'y', fill=False, linestyle='-'):
    # currentAxis,坐标轴,通过plt.gca()获取
    # bbox,边界框,包含四个数值的list, [x1, y1, x2, y2]
    # edgecolor,边框线条颜色
    # facecolor,填充颜色
    # fill, 是否填充
    # linestype,边框线型
    # patches.Rectangle需要传入左上角坐标、矩形区域的宽度、高度等参数
    rect=patches.Rectangle((bbox[0], bbox[1]), bbox[2]-bbox[0]+1, bbox[3]-bbox[1]+1, linewidth=1,
                           edgecolor=edgecolor,facecolor=facecolor,fill=fill, linestyle=linestyle)
    currentAxis.add_patch(rect)


plt.figure(figsize=(10, 10))

filename = '/home/aistudio/000000086956.jpg'
im = imread(filename)
plt.imshow(im)

currentAxis=plt.gca()

# 预测框位置
boxes = np.array([[4.21716537e+01, 1.28230896e+02, 2.26547668e+02, 6.00434631e+02],
       [3.18562988e+02, 1.23168472e+02, 4.79000000e+02, 6.05688416e+02],
       [2.62704697e+01, 1.39430557e+02, 2.20587097e+02, 6.38959656e+02],
       [4.24965363e+01, 1.42706665e+02, 2.25955185e+02, 6.35671204e+02],
       [2.37462646e+02, 1.35731537e+02, 4.79000000e+02, 6.31451294e+02],
       [3.19390472e+02, 1.29295090e+02, 4.79000000e+02, 6.33003845e+02],
       [3.28933838e+02, 1.22736115e+02, 4.79000000e+02, 6.39000000e+02],
       [4.44292603e+01, 1.70438187e+02, 2.26841858e+02, 6.39000000e+02],
       [2.17988785e+02, 3.02472412e+02, 4.06062927e+02, 6.29106628e+02],
       [2.00241089e+02, 3.23755096e+02, 3.96929321e+02, 6.36386108e+02],
       [2.14310303e+02, 3.23443665e+02, 4.06732849e+02, 6.35775269e+02]])

# 预测框得分
scores = np.array([0.5247661 , 0.51759845, 0.86075854, 0.9910175 , 0.39170712,
       0.9297706 , 0.5115228 , 0.270992  , 0.19087596, 0.64201415, 0.879036])

# 画出所有预测框
for box in boxes:
    draw_rectangle(currentAxis, box)

<Figure size 720x720 with 1 Axes>
NMS基本思想是,如果有多个预测框都对应同一个物体,则只选出得分最高的那个预测框,剩下的预测框被丢弃掉。
如何判断两个预测框对应的是同一个物体呢,标准该怎么设置?
如果两个预测框的类别一样,而且他们的位置重合度比较大,则可以认为他们是在预测同一个目标。非极大值抑制的做法是,选出某个类别得分最高的预测框,然后看哪些预测框跟它的IoU大于阈值,就把这些预测框给丢弃掉。这里IoU的阈值是超参数,需要提前设置,YOLOv3模型里面设置的是0.5。
比如在上面的程序中,boxes里面一共对应11个预测框,scores给出了它们预测"人"这一类别的得分。
- Step0:创建选中列表,keep_list = []
- Step1:对得分进行排序,remain_list = [ 3, 5, 10, 2, 9, 0, 1, 6, 4, 7, 8],
- Step2:选出boxes[3],此时keep_list为空,不需要计算IoU,直接将其放入keep_list,keep_list = [3], remain_list=[5, 10, 2, 9, 0, 1, 6, 4, 7, 8]
- Step3:选出boxes[5],此时keep_list中已经存在boxes[3],计算出IoU(boxes[3], boxes[5]) = 0.0,显然小于阈值,则keep_list=[3, 5], remain_list = [10, 2, 9, 0, 1, 6, 4, 7, 8]
- Step4:选出boxes[10],此时keep_list=[3, 5],计算IoU(boxes[3], boxes[10])=0.0268,IoU(boxes[5], boxes[10])=0.0268 = 0.24,都小于阈值,则keep_list = [3, 5, 10],remain_list=[2, 9, 0, 1, 6, 4, 7, 8]
- Step5:选出boxes[2],此时keep_list = [3, 5, 10],计算IoU(boxes[3], boxes[2]) = 0.88,超过了阈值,直接将boxes[2]丢弃,keep_list=[3, 5, 10],remain_list=[9, 0, 1, 6, 4, 7, 8]
- Step6:选出boxes[9],此时keep_list = [3, 5, 10],计算IoU(boxes[3], boxes[9]) = 0.0577,IoU(boxes[5], boxes[9]) = 0.205,IoU(boxes[10], boxes[9]) = 0.88,超过了阈值,将boxes[9]丢弃掉。keep_list=[3, 5, 10],remain_list=[0, 1, 6, 4, 7, 8]
- Step7:重复上述Step6直到remain_list为空。
最终得到keep_list=[3, 5, 10],也就是预测框3、5、10被最终挑选出来了,如下图所示。

In [14]
# 非极大值抑制
def nms(bboxes, scores, score_thresh, nms_thresh):
    """
    nms
    """
    inds = np.argsort(scores)
    inds = inds[::-1]
    keep_inds = []
    while(len(inds) > 0):
        cur_ind = inds[0]
        cur_score = scores[cur_ind]
        # if score of the box is less than score_thresh, just drop it
        if cur_score < score_thresh:
            break

        keep = True
        for ind in keep_inds:
            current_box = bboxes[cur_ind]
            remain_box = bboxes[ind]
            iou = box_iou_xyxy(current_box, remain_box)
            if iou > nms_thresh:
                keep = False
                break
        if keep:
            keep_inds.append(cur_ind)
        inds = inds[1:]

    return np.array(keep_inds)
In [21]
plt.figure(figsize=(10, 10))
plt.imshow(im)
currentAxis=plt.gca()
colors = ['r', 'g', 'b', 'k']

# 画出最终保留的预测框
inds = nms(boxes, scores, score_thresh=0.01, nms_thresh=0.5)
# 打印最终保留的预测框是哪几个
print(inds)
for i in range(len(inds)):
    box = boxes[inds[i]]
    draw_rectangle(currentAxis, box, edgecolor=colors[i])
[ 3 5 10]
<Figure size 720x720 with 1 Axes>


 7398
7398

 被折叠的 条评论
为什么被折叠?
被折叠的 条评论
为什么被折叠?
 到【灌水乐园】发言


