


一 数据标注与处理
(一)数据标注
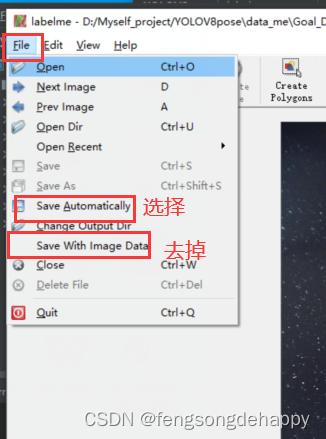
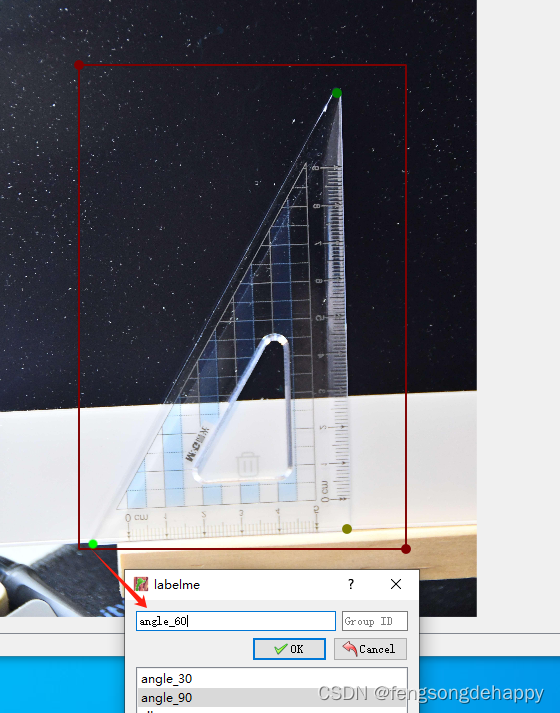
使用labelme标注数据
先标注框,把框标注完再标注关键点(关键点不要一张图片全部类别标完,现把所有图片的某一类关键点标注完,再回来标注另一类,依次类推。。。原因(快且不易错))
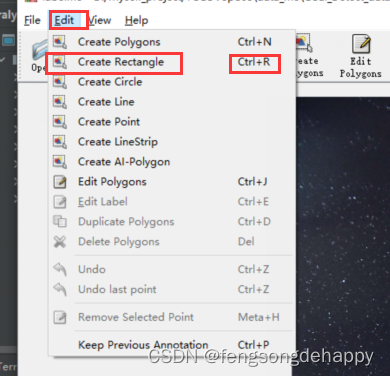
1.标注框
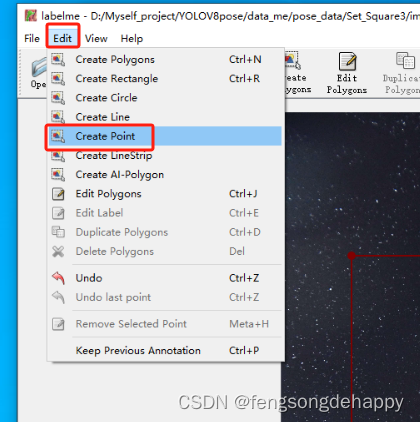
2.标注关键点
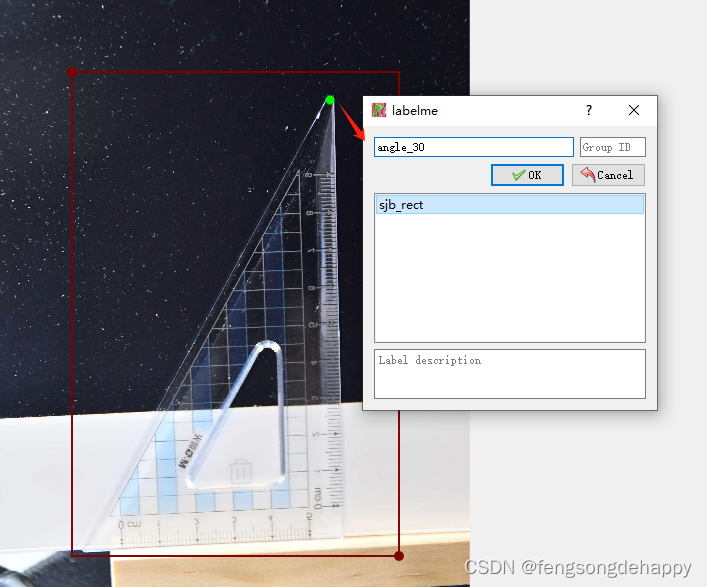
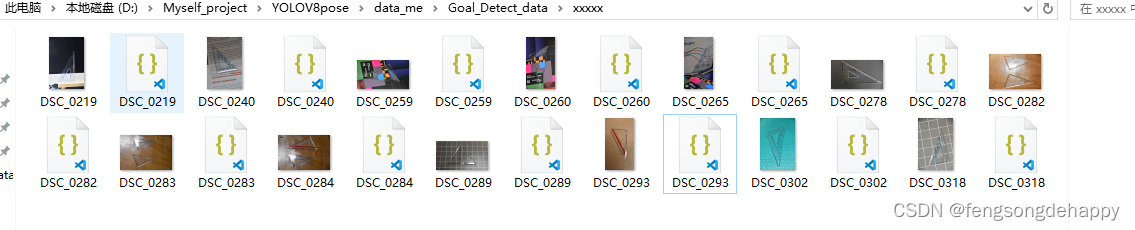
标注完后在图片文件夹李会有对应的json文件(如图)
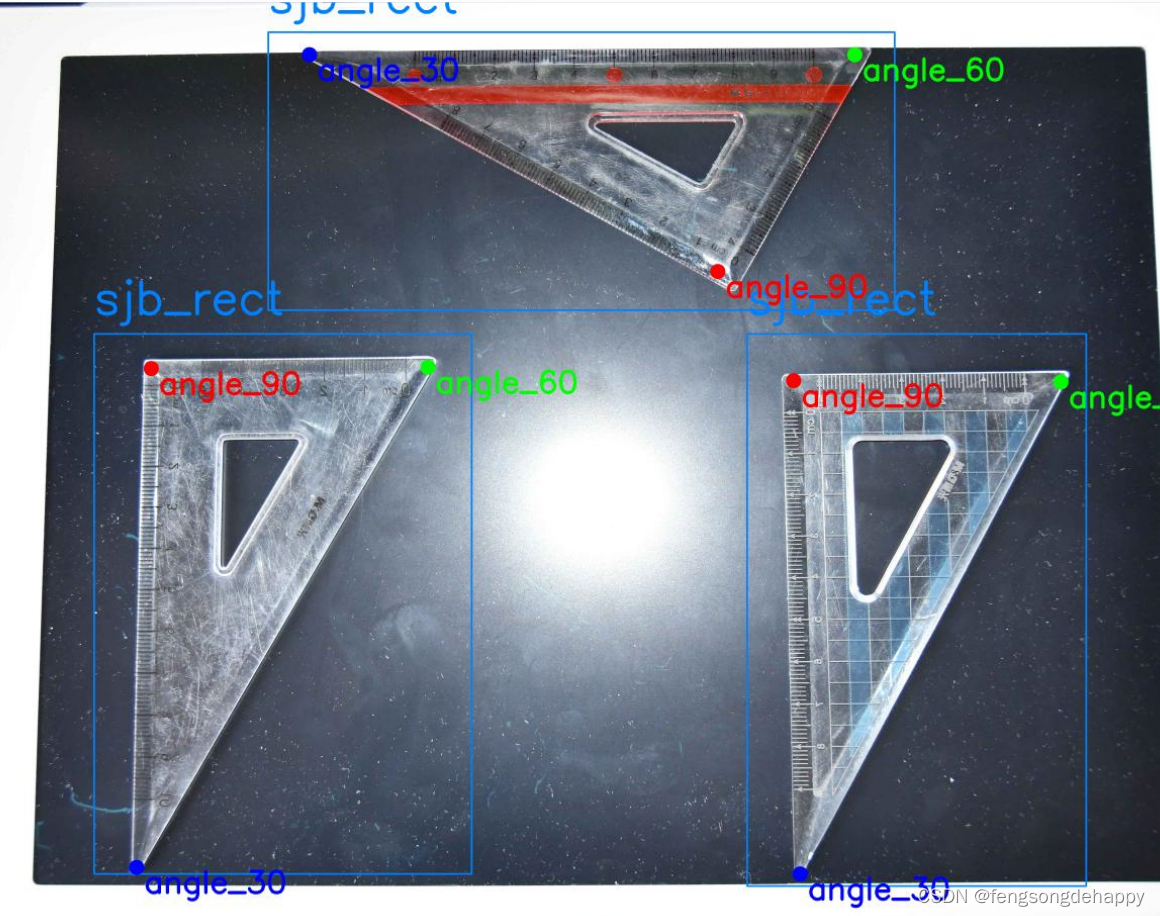
使用此代码可视化检查数据
# 导入工具包
import os
import cv2
import numpy as np
import json

import matplotlib.pyplot as plt

""""注意:把图片与标签(json)放在同一个文件夹里 """
"""使用:  只需要修改files_path路径 与 kpt_color_map就行。 kpt_color_map是关键点类别的配置,我的是三个关键点类别,分别叫angle_30, angle_60, angle_90
          你把这里改成自己的类别即可,如果类别小于3个就减少配置,如果大于3个就按照格式增加配置 """

num = 0
# 图片与标签json的文件夹路径
files_path = r"D:\Myself_project\YOLOV8pose\data_me\pose_data\Set_Square3\images"
for file in os.listdir(files_path):
    if file.endswith(".jpg"):
        img_path = os.path.join(files_path, file)
        img_bgr = cv2.imread(img_path)

        file_profix = os.path.splitext(file)[0]
        labelme_name = file_profix + '.json'                                  # DSC_0219.json
        labelme_path = os.path.join(files_path, labelme_name)
        # 载入labelme格式的json标注文件
        with open(labelme_path, 'r', encoding='utf-8') as f:
            labelme = json.load(f)

        # <<<<<<<<<<<<<<<<<<可视化框(rectangle)标注>>>>>>>>>>>>>>>>>>>>>
        # 框可视化配置
        bbox_color = (255, 129, 0)  # 框的颜色
        bbox_thickness = 5  # 框的线宽

        # 框类别文字
        bbox_labelstr = {
            'font_size': 6,  # 字体大小
            'font_thickness': 14,  # 字体粗细
            'offset_x': 0,  # X 方向,文字偏移距离,向右为正
            'offset_y': -80,  # Y 方向,文字偏移距离,向下为正
        }
        # 画框
        for each_ann in labelme['shapes']:  # 遍历每一个标注
            if each_ann['shape_type'] == 'rectangle':  # 筛选出框标注
                # 框的类别
                bbox_label = each_ann['label']
                # 框的两点坐标
                bbox_keypoints = each_ann['points']
                bbox_keypoint_A_xy = bbox_keypoints[0]
                bbox_keypoint_B_xy = bbox_keypoints[1]
                # 左上角坐标
                bbox_top_left_x = int(min(bbox_keypoint_A_xy[0], bbox_keypoint_B_xy[0]))
                bbox_top_left_y = int(min(bbox_keypoint_A_xy[1], bbox_keypoint_B_xy[1]))
                # 右下角坐标
                bbox_bottom_right_x = int(max(bbox_keypoint_A_xy[0], bbox_keypoint_B_xy[0]))
                bbox_bottom_right_y = int(max(bbox_keypoint_A_xy[1], bbox_keypoint_B_xy[1]))

                # 画矩形:画框
                img_bgr = cv2.rectangle(img_bgr, (bbox_top_left_x, bbox_top_left_y), (bbox_bottom_right_x, bbox_bottom_right_y),
                                        bbox_color, bbox_thickness)
                # 写框类别文字:图片,文字字符串,文字左上角坐标,字体,字体大小,颜色,字体粗细
                img_bgr = cv2.putText(img_bgr, bbox_label, (
                    bbox_top_left_x + bbox_labelstr['offset_x'],
                    bbox_top_left_y + bbox_labelstr['offset_y']),
                                      cv2.FONT_HERSHEY_SIMPLEX, bbox_labelstr['font_size'], bbox_color,
                                      bbox_labelstr['font_thickness'])
        # # 可视化
        # plt.imshow(img_bgr[:, :, ::-1])  # 将bgr通道转换成rgb通道
        # plt.show()

        # <<<<<<<<<<<<<<<<<<可视化关键点(keypoint)标注>>>>>>>>>>>>>>>>>>>>>
        # 关键点的可视化配置
        # 关键点配色
        kpt_color_map = {
            'angle_30': {'id': 0, 'color': [255, 0, 0], 'radius': 30, 'thickness': -1},
            'angle_60': {'id': 1, 'color': [0, 255, 0], 'radius': 30, 'thickness': -1},
            'angle_90': {'id': 2, 'color': [0, 0, 255], 'radius': 30, 'thickness': -1}
        }

        # 点类别文字
        kpt_labelstr = {
            'font_size': 4,  # 字体大小
            'font_thickness': 12,  # 字体粗细
            'offset_x': 30,  # X 方向,文字偏移距离,向右为正
            'offset_y': 100,  # Y 方向,文字偏移距离,向下为正
        }

        # 画点
        for each_ann in labelme['shapes']:  # 遍历每一个标注
            if each_ann['shape_type'] == 'point':  # 筛选出关键点标注
                kpt_label = each_ann['label']  # 该点的类别
                # 该点的 XY 坐标
                kpt_xy = each_ann['points'][0]
                kpt_x, kpt_y = int(kpt_xy[0]), int(kpt_xy[1])

                # 该点的可视化配置
                kpt_color = kpt_color_map[kpt_label]['color']  # 颜色
                kpt_radius = kpt_color_map[kpt_label]['radius']  # 半径
                kpt_thickness = kpt_color_map[kpt_label]['thickness']  # 线宽(-1代表填充)
                # 画圆:画该关键点
                img_bgr = cv2.circle(img_bgr, (kpt_x, kpt_y), kpt_radius, kpt_color, kpt_thickness)
                # 写该点类别文字:图片,文字字符串,文字左上角坐标,字体,字体大小,颜色,字体粗细
                img_bgr = cv2.putText(img_bgr, kpt_label, (kpt_x + kpt_labelstr['offset_x'], kpt_y + kpt_labelstr['offset_y']),
                                      cv2.FONT_HERSHEY_SIMPLEX, kpt_labelstr['font_size'], kpt_color,
                                      kpt_labelstr['font_thickness'])


        # 可视化
        # plt.imshow(img_bgr[:, :, ::-1])  # 将bgr通道转换成rgb通道
        # plt.show()
        # 当前目录下保存可视化结果
        cv2.imwrite(f'data_me/inspect_label_data/{num}.jpg', img_bgr)
        num += 1
print('=========================ok========================')
运行结果:
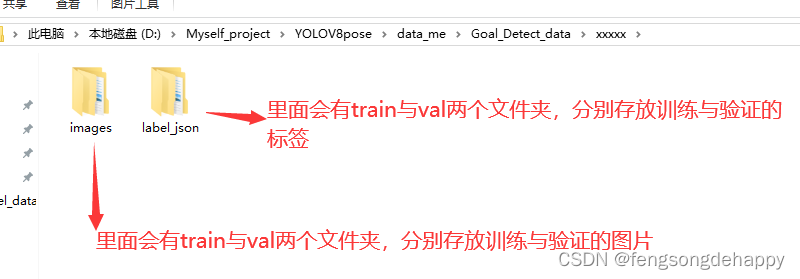
(二)数据处理
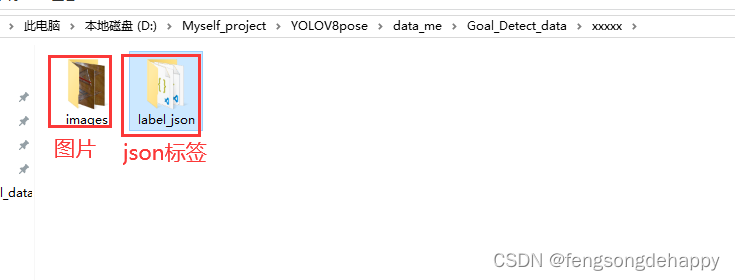
用下面代码把上面文件夹下的图片与json标签分开
import os
import shutil

# 图片与json标签的同一文件夹路径
source_folder = 'images'
# 分出后用来只存放图片的路径
out_img_folder = 'data_me/images'
# 分出后用来只存放json标签的路径
out_json_folder = "data_me/label_json"

# 确保目标文件夹存在,如果不存在则创建
os.makedirs(out_img_folder, exist_ok=True)
os.makedirs(out_json_folder, exist_ok=True)

for file_name in os.listdir(source_folder):
    source_file_path = os.path.join(source_folder, file_name)
    if file_name.endswith('.jpg'):
        source_img_file_path = os.path.join(source_folder, file_name)
        destination_img_file_path = os.path.join(out_img_folder, file_name)
        shutil.move(source_img_file_path, destination_img_file_path)

    elif file_name.endswith('.json'):
        source_json_file_path = os.path.join(source_folder, file_name)
        destination_json_file_path = os.path.join(out_json_folder, file_name)
        shutil.move(source_json_file_path, destination_json_file_path)
print("=======ok")
运行完成后得到如下:
使用以下代码划分数据集
import os
import shutil

from tqdm import tqdm
import random

""" 使用:只需要修改 1. Dataset_folde,
                  2. os.chdir(os.path.join(Dataset_folder, 'images'))里的 images,
                  3. val_scal = 0.2
                  4. os.chdir('../label_json')          label_json换成自己json标签文件夹名称   """


# 图片文件夹与json标签文件夹的根目录
Dataset_folder = r'D:\Myself_project\YOLOV8pose\data_me\Goal_Detect_data\xxxxx'

# 把当前工作目录改为指定路径
os.chdir(os.path.join(Dataset_folder, 'images'))   # images : 图片文件夹的名称
folder = '.'                  # 代表os.chdir(os.path.join(Dataset_folder, 'images'))这个路径
imgs_list = os.listdir(folder)

random.seed(123)              # 固定随机种子,防止运行时出现bug后再次运行导致imgs_list 里面的图片名称顺序不一致

random.shuffle(imgs_list)     # 打乱

val_scal = 0.2                # 验证集比列
val_number = int(len(imgs_list) * val_scal)
val_files = imgs_list[:val_number]
train_files = imgs_list[val_number:]

print('all_files:', len(imgs_list))
print('train_files:', len(train_files))
print('val_files:', len(val_files))


os.mkdir('train')
for each in tqdm(train_files):
    shutil.move(each, 'train')

os.mkdir('val')
for each in tqdm(val_files):
    shutil.move(each, 'val')

os.chdir('../label_json')

os.mkdir('train')
for each in tqdm(train_files):
    json_file = os.path.splitext(each)[0] + '.json'
    shutil.move(json_file, 'train')

os.mkdir('val')
for each in tqdm(val_files):
    json_file = os.path.splitext(each)[0] + '.json'
    shutil.move(json_file, 'val')

print('划分完成')
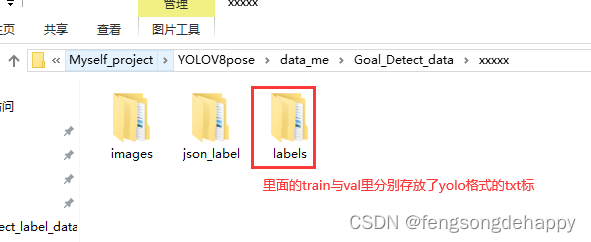
结果:
使用代码把json标签转yolo的txt格式
import os
import json
import shutil
import numpy as np
from tqdm import tqdm

""""#使用:1.改 bbox_class = {'sjb_rect': 0},我的框的类别是sjb_rect,赋值它为0,如你是dog则改成:bbox_cls = {'dog': 0}
          2.改 keypoint_class = ['angle_30', 'angle_60', 'angle_90'],我的关键点类别是三个,分别是'angle_30', 'angle_60', 'angle_90'
          3.改 Dataset_root 成你自己的图片与json文件的路径
          4.改 os.chdir('json_label/train')与os.chdir('json_label/val') 成你的json文件夹下的train与val文件夹 """


# 数据集根慕录(即图片文件夹与标签文件夹的上一级目录)
Dataset_root = 'D:\Myself_project\YOLOV8pose\data_me\pose_data\Set_Square3'

# 框的类别
bbox_class = {
    'sjb_rect':0
}

# 关键点的类别
keypoint_class = ['angle_30', 'angle_60', 'angle_90']   # 这里类别放的顺序对应关键点类别的标签 0,1,2

os.chdir(Dataset_root)

os.mkdir('labels')
os.mkdir('labels/train')
os.mkdir('labels/val')


def process_single_json(labelme_path, save_folder='../../labels/train'):
    with open(labelme_path, 'r', encoding='utf-8') as f:
        labelme = json.load(f)

    img_width = labelme['imageWidth']  # 图像宽度
    img_height = labelme['imageHeight']  # 图像高度

    # 生成 YOLO 格式的 txt 文件
    suffix = labelme_path.split('.')[-2]
    yolo_txt_path = suffix + '.txt'

    with open(yolo_txt_path, 'w', encoding='utf-8') as f:

        for each_ann in labelme['shapes']:  # 遍历每个标注

            if each_ann['shape_type'] == 'rectangle':  # 每个框,在 txt 里写一行

                yolo_str = ''

                ## 框的信息
                # 框的类别 ID
                bbox_class_id = bbox_class[each_ann['label']]
                yolo_str += '{} '.format(bbox_class_id)
                # 左上角和右下角的 XY 像素坐标
                bbox_top_left_x = int(min(each_ann['points'][0][0], each_ann['points'][1][0]))
                bbox_bottom_right_x = int(max(each_ann['points'][0][0], each_ann['points'][1][0]))
                bbox_top_left_y = int(min(each_ann['points'][0][1], each_ann['points'][1][1]))
                bbox_bottom_right_y = int(max(each_ann['points'][0][1], each_ann['points'][1][1]))
                # 框中心点的 XY 像素坐标
                bbox_center_x = int((bbox_top_left_x + bbox_bottom_right_x) / 2)
                bbox_center_y = int((bbox_top_left_y + bbox_bottom_right_y) / 2)
                # 框宽度
                bbox_width = bbox_bottom_right_x - bbox_top_left_x
                # 框高度
                bbox_height = bbox_bottom_right_y - bbox_top_left_y
                # 框中心点归一化坐标
                bbox_center_x_norm = bbox_center_x / img_width
                bbox_center_y_norm = bbox_center_y / img_height
                # 框归一化宽度
                bbox_width_norm = bbox_width / img_width
                # 框归一化高度
                bbox_height_norm = bbox_height / img_height

                yolo_str += '{:.5f} {:.5f} {:.5f} {:.5f} '.format(bbox_center_x_norm, bbox_center_y_norm,
                                                                  bbox_width_norm, bbox_height_norm)

                ## 找到该框中所有关键点,存在字典 bbox_keypoints_dict 中
                bbox_keypoints_dict = {}
                for each_ann in labelme['shapes']:  # 遍历所有标注
                    if each_ann['shape_type'] == 'point':  # 筛选出关键点标注
                        # 关键点XY坐标、类别
                        x = int(each_ann['points'][0][0])
                        y = int(each_ann['points'][0][1])
                        label = each_ann['label']
                        if (x > bbox_top_left_x) & (x < bbox_bottom_right_x) & (y < bbox_bottom_right_y) & (
                                y > bbox_top_left_y):  # 筛选出在该个体框中的关键点
                            bbox_keypoints_dict[label] = [x, y]

                ## 把关键点按顺序排好
                for each_class in keypoint_class:  # 遍历每一类关键点
                    if each_class in bbox_keypoints_dict:
                        keypoint_x_norm = bbox_keypoints_dict[each_class][0] / img_width
                        keypoint_y_norm = bbox_keypoints_dict[each_class][1] / img_height
                        yolo_str += '{:.5f} {:.5f} {} '.format(keypoint_x_norm, keypoint_y_norm,
                                                               2)  # 2-可见不遮挡 1-遮挡 0-没有点
                    else:  # 不存在的点,一律为0
                        yolo_str += '0 0 0 '
                # 写入 txt 文件中
                f.write(yolo_str + '\n')

    shutil.move(yolo_txt_path, save_folder)
    print('{} --> {} 转换完成'.format(labelme_path, yolo_txt_path))


os.chdir('label_json/train')

save_folder = '../../labels/train'
for labelme_path in os.listdir():
    try:
        process_single_json(labelme_path, save_folder=save_folder)
    except:
        print('******有误******', labelme_path)
print('YOLO格式的txt标注文件已保存至 ', save_folder)


os.chdir('../../')

os.chdir('label_json/val')


save_folder = '../../labels/val'
for labelme_path in os.listdir():
    try:
        process_single_json(labelme_path, save_folder=save_folder)
    except:
        print('******有误******', labelme_path)
print('YOLO格式的txt标注文件已保存至 ', save_folder)

os.chdir('../../')


os.chdir('../')
结果:
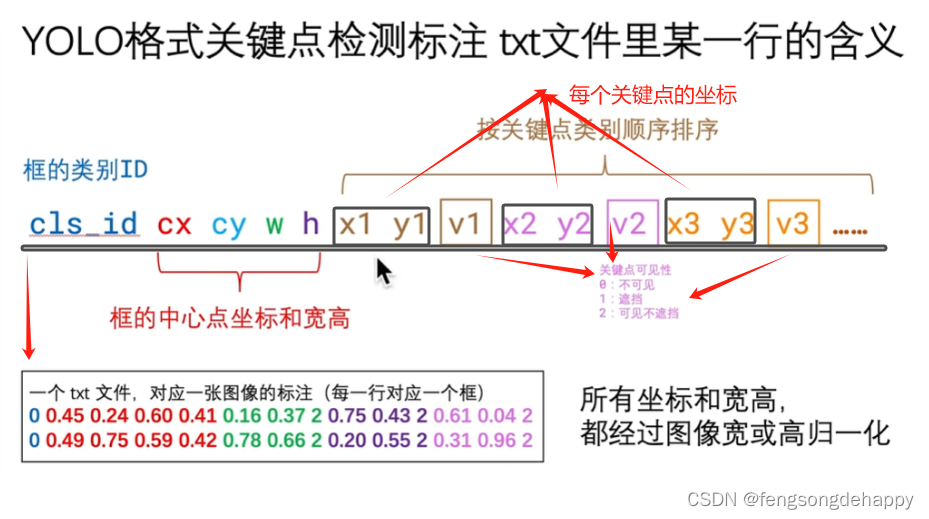
yolov8pose的txt标签解读:
此时数据已经全部处理好
二、环境配置与训练
假设conda已经安装,环境配置已完成
(一)、环境配置
cmd打开终端创建虚拟环境:
conda create -n yolo8 python==3.8激活虚拟环境:
conda activate yolo8
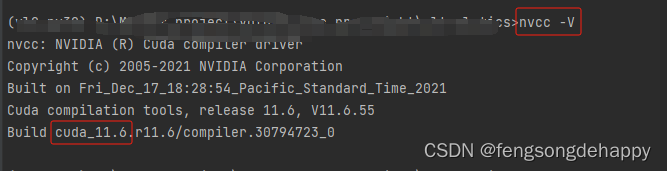
安装匹配cuda的torch(我这里是cuda11.6)
安装pytorch
pip install torch==1.12.1+cu116 torchvision==0.13.1+cu116 torchaudio==0.12.1 --extra-index-url https://download.pytorch.org/whl/cu116进入github仓库


使用命令克隆项目 或者直接 DownloadZip
git clone https://github.com/ultralytics/ultralytics.git在项目文件夹下创建一个yaml配置文件,内容如下
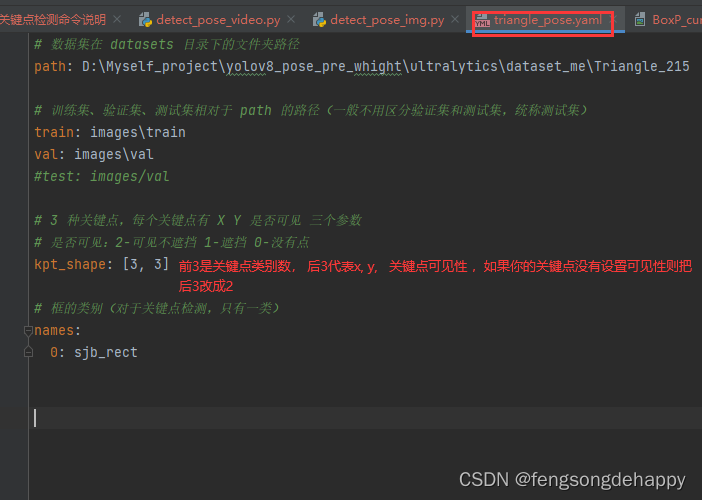
如果你的关键点有左右区别关系(比如眼睛)则参考下面的yaml格式:
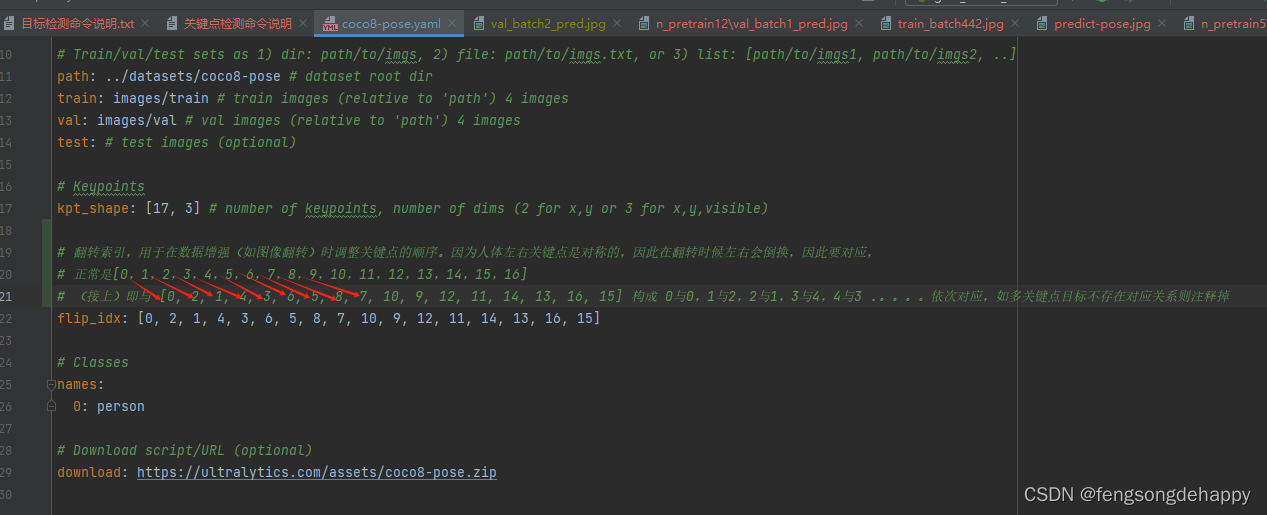
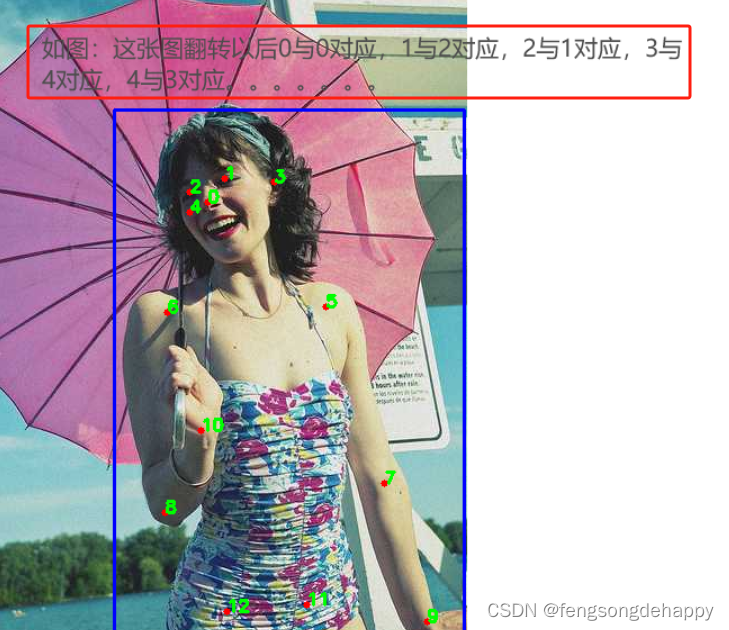
对于关键点有左右区别关系(比如眼睛)要在yaml中设置flip_idx的原因解释如图:
在终端安装 各种包:
pip install numpy opencv-python pillow pandas matplotlib seaborn tqdm wandb seedir emoji -i https://pypi.tuna.tsinghua.edu.cn/simple
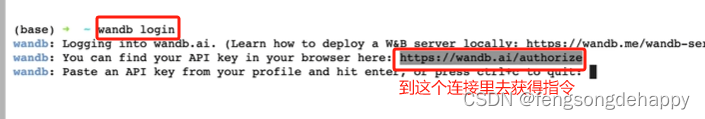
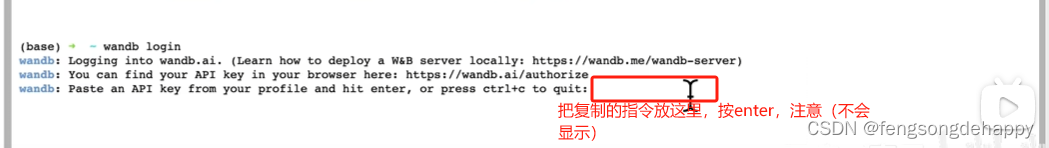
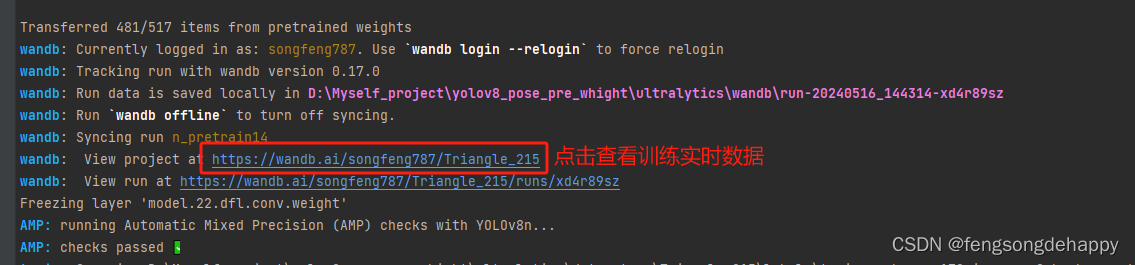
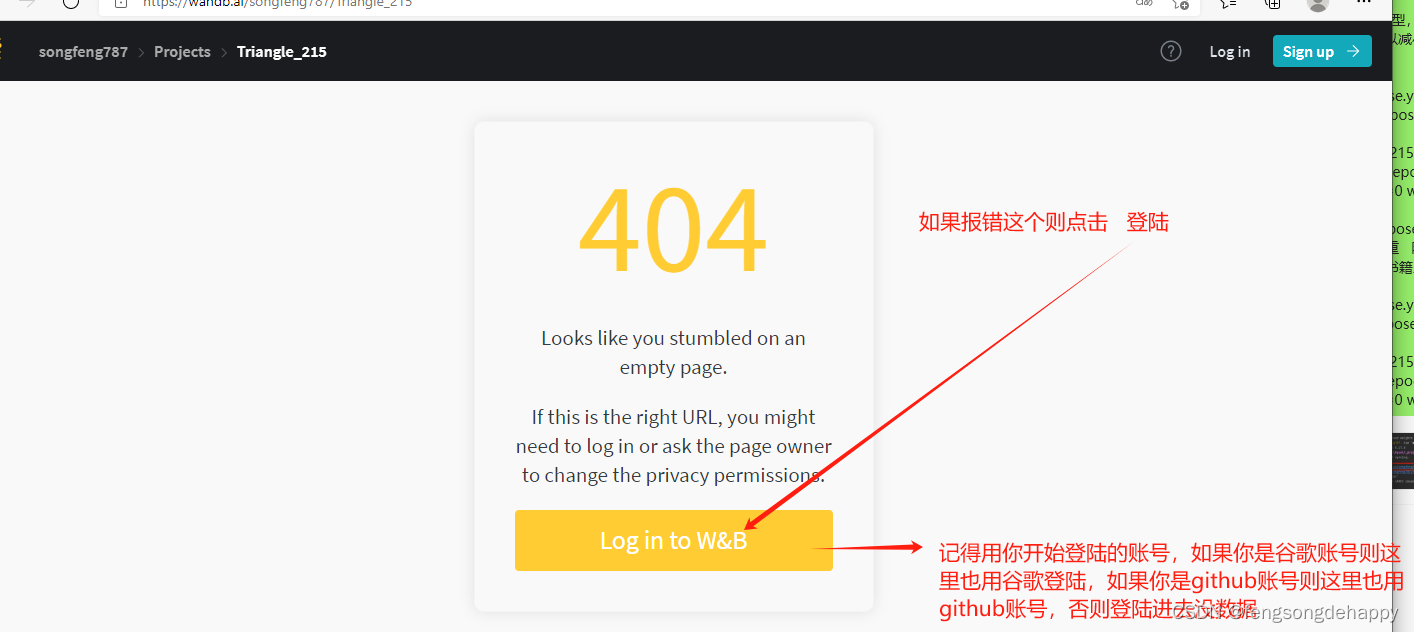
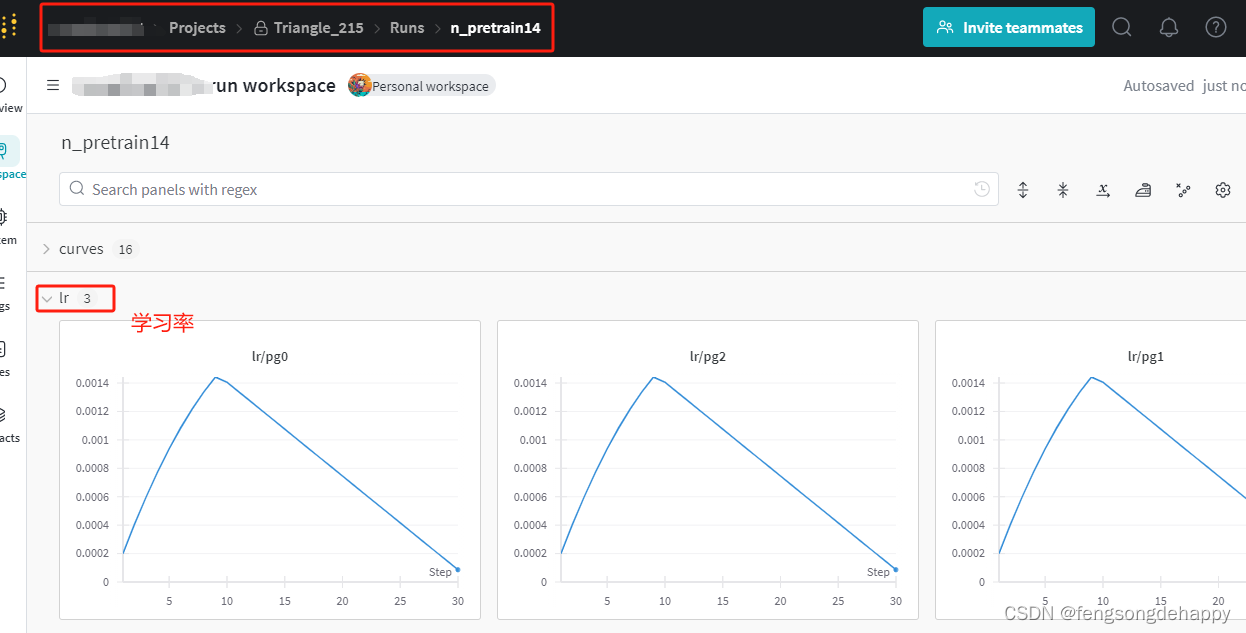
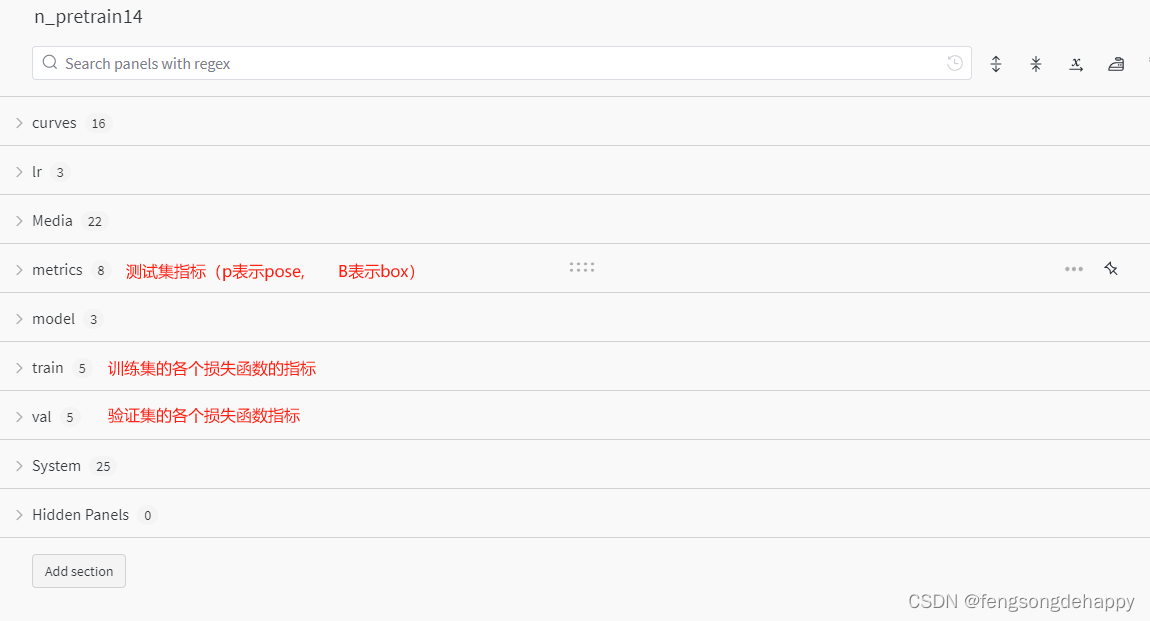
登陆wandb查看序列数据:
如果开始没用登陆则:在命令行中运行:wandb login 获取密钥登陆

训练:
####---------------------------- 训练 ---------------------------------------
# yolov8n-pose模型,迁移学习微调                                                                                                         # 报错页面太小可以减小batch与workers
yolo pose train data=triangle_pose.yaml model=yolov8m-pose.pt pretrained=True project=Triangle_215 name=n_pretrain epochs=30 batch=16 device=0 workers=4

# 只使用yolov8n-pose的模型结构,不使用它预训练的权重   随机初始权重,从头重新在我自己的书籍上学习训练
yolo pose train data=triangle_pose.yaml model=yolov8n-pose.pt pretrained=False project=Triangle_215 name=n_scratch epochs=50 batch=16 device=0 workers=2


####---------------------------- 验证 ---------------------------------------
yolo pose val model=yolov8n-pose.pt  # val official model
yolo pose val data=triangle_pose.yaml model=D:\Myself_project\yolov8_pose_pre_whight\ultralytics\Triangle_215\n_pretrain12\weights\best.pt  # val custom model


####---------------------------- 预测 ---------------------------------------
yolo pose predict model=D:\Myself_project\yolov8_pose_pre_whight\ultralytics\Triangle_215\n_pretrain12\weights\best.pt source=videos/triangle_pose/triangle_6.mp4  # predict with official model
yolo pose predict model=path/to/best.pt source=images/bus.jpg   # predict with custom model


##---------------------------训练命令的几个比较重要的训练参数----------------------------------
model YOLOV8模型       data 配置文件(.yaml格式)     pretrained 是否在预训练模型权重基础上迁移学习泛化微调,默认为true     epochs 训练轮次,默认100    batch batch-size,默认16   imgsz 输入图像宽高尺寸,默认640

device 计算设备(device=0 或 device=0,1,2,3 或 device=cpu)     project 项目名称,建议同一个数据集取同一个项目名称    name 实验名称,建议每一次训练对应一个实验名称    optimizer 梯度下降优化器,默认'SGD',备选:['SGD', 'Adam', 'AdamW', 'RMSProp']

close_mosaic 是否关闭马赛克图像扩增,默认为0,也就是开启马赛克图像扩增      cls 目标检测分类损失函数cls_loss权重,默认0.5     box 目标检测框定位损失函数box_loss权重,默认7.5    dfl 类别不均衡时Dual Focal Loss损失函数dfl_loss权重,默认1.5。

DFL损失函数论文:Generalized Focal Loss: Learning Qualified and Distributed Bounding Boxes for Dense Object Detection         DFL损失函数知乎博客:https://zhuanlan.zhihu.com/p/147691786

pose 关键点定位损失函数pose_loss权重,默认12.0(只在关键点检测训练时用到)         kobj 关键点置信度损失函数keypoint_loss权重,默认2.0(只在关键点检测训练时用到)


##---------------------------预测命令的几个比较重要的训练参数----------------------------------
conf  置信度         verbose  是否在命令输出每一帧的预测结果,默认False     show  是否在屏幕上显示结果      classes 只显示哪个或哪些类别的预测结果(class=0或 class=[0,2,3])
python自己写api侦测:
图片侦测
import cv2
import numpy as np
from ultralytics import YOLO
import matplotlib.pyplot as plt


"""  使用:1 .修改主函数下的图片路径与权重路径 。
          2. 如果你需要连线或者修改关键点颜色则对应修改:skeleton,kpt_color, limb_color 这三个参数里的值,把kpt_color里的元素个数改成你自己关键点的个数,我是17个关键点所以17个元素,
             对于limb_color 你要计算你自己的连接线是多少根,我的19根所以有19个元素
          3. 如果只需要绘制关键点,注释掉: ###----------> 连线 <----------下的内容     """

def hsv2bgr(h, s, v):
    h_i = int(h * 6)
    f = h * 6 - h_i
    p = v * (1 - s)
    q = v * (1 - f * s)
    t = v * (1 - (1 - f) * s)

    r, g, b = 0, 0, 0

    if h_i == 0:
        r, g, b = v, t, p
    elif h_i == 1:
        r, g, b = q, v, p
    elif h_i == 2:
        r, g, b = p, v, t
    elif h_i == 3:
        r, g, b = p, q, v
    elif h_i == 4:
        r, g, b = t, p, v
    elif h_i == 5:
        r, g, b = v, p, q

    return int(b * 255), int(g * 255), int(r * 255)


def random_color(id):
    h_plane = (((id << 2) ^ 0x937151) % 100) / 100.0
    s_plane = (((id << 3) ^ 0x315793) % 100) / 100.0
    return hsv2bgr(h_plane, s_plane, 1)

# 需要连接线的对应关键点:如 [16, 14]就是指:标签16与标签14连接   [14, 12]指标签14与标签12连接
skeleton = [[16, 14], [14, 12], [17, 15], [15, 13], [12, 13], [6, 12], [7, 13], [6, 7], [6, 8],
            [7, 9], [8, 10], [9, 11], [2, 3], [1, 2], [1, 3], [2, 4], [3, 5], [4, 6], [5, 7]]

pose_palette = np.array([[255, 128, 0], [255, 153, 51], [255, 178, 102], [230, 230, 0], [255, 153, 255],
                         [153, 204, 255], [255, 102, 255], [255, 51, 255], [102, 178, 255], [51, 153, 255],
                         [255, 153, 153], [255, 102, 102], [255, 51, 51], [153, 255, 153], [102, 255, 102],
                         [51, 255, 51], [0, 255, 0], [0, 0, 255], [255, 0, 0], [255, 255, 255]], dtype=np.uint8)

# 通过索引[16, 16, 16, ......] 对应取pose_palette里的颜色值并存储在列表[]中赋值给kpt_color
kpt_color = pose_palette[[16, 0, 9]]                     # 这里赋值关键点总共3种颜色
# kpt_color = pose_palette[[16, 15, 14, 13, 12, 0, 1, 2, 3, 4, 5, 6, 7, 8, 9, 10, 11]]                 # 这里赋值关键点总共17种颜色

# 通过索引[9, 9, 9, 9, ......] 对应取pose_palette里的颜色值并存储在列表[]中赋值给limb_color 既 既关键点连接线的颜色
limb_color = pose_palette[[9, 9, 9, 9, 7, 7, 7, 0, 0, 0, 0, 0, 16, 16, 16, 16, 16, 16, 16]]            # 这里赋值连接线段总共4种颜色
# limb_color = pose_palette[[16, 15, 14, 13, 12, 0, 1, 2, 3, 4, 5, 6, 7, 8, 9, 10, 11, 17, 18]]        # 这里赋值连接线段总共19种颜色

if __name__ == "__main__":

    model = YOLO(r"D:\Myself_project\yolov8_pose_pre_whight\ultralytics\Triangle_215\n_pretrain14\weights\best.pt")
    img_path = 'images/DSC_0245.jpg'
    img_path1 = 'images/one_people.png'
    img_path2 = 'images/multi-person.jpeg'
    img_path3 = 'images/3.jpg'
    img_path4 = 'images/1.png'
    img_path5 = 'images/2.png'

    results = model([img_path], save=False, show=False)
    # 循环拿到一张图片的结果
    for j in range(len(results)):
        result = results[j]
        names = result.names
        boxes = result.boxes.data.tolist()                      # 这张图片上所有框的[坐标、置信度、类别]  ---》 [[2815.0, 1043.0, 3546.0, 3374.0, 0.9234039783477783, 0.0], [1645.0, 771.0, 2537.0, 3371.0, 0.9227007031440735, 0.0]]
        # keypoints.data.shape -> n,17,3
        keypoints = result.keypoints.cpu().numpy()
        img = cv2.imread(result.path)                            # result.path : 模型里自动获取当前被处理的图片的路径

        ### -------------------->画关键点<-------------------------###
        # keypoint -> 每个人的关键点
        for keypoint in keypoints.data:
            for i, (x, y, conf) in enumerate(keypoint):
                color_k = [int(x) for x in kpt_color[i]]         # [0, 255, 0] 取颜色
                if conf < 0.5:
                    continue
                if x != 0 and y != 0:                            # 确保不在图像上标记无效或未检测到的关键点
                    cv2.circle(img, (int(x), int(y)), 10, color_k, -1, lineType=cv2.LINE_AA)

            ###-----------------> 连线 <------------------------
            # for i, sk in enumerate(skeleton):
            #     # pos1 和 pos2 这样的坐标, 会被用来在视觉输出上绘制线段(比如连接身体的两个关键点), sk[0] - 1: 这是获取第一个关键点坐标的索引。因为 sk 数组中的索引可能是从1开始的
            #     pos1 = (int(keypoint[(sk[0] - 1), 0]), int(keypoint[(sk[0] - 1), 1]))       # (3262, 3068)
            #     pos2 = (int(keypoint[(sk[1] - 1), 0]), int(keypoint[(sk[1] - 1), 1]))       # (3340, 2628)
            #
            #     # 获取 连接线需要的两个关键点的置信度
            #     conf1 = keypoint[(sk[0] - 1), 2]
            #     conf2 = keypoint[(sk[1] - 1), 2]
            #     if conf1 < 0.5 or conf2 < 0.5:
            #         continue
            #     if pos1[0] == 0 or pos1[1] == 0 or pos2[0] == 0 or pos2[1] == 0:
            #         continue
            #     cv2.line(img, pos1, pos2, [int(x) for x in limb_color[i]], thickness=10, lineType=cv2.LINE_AA)


        ### -------------------->画框写字<-------------------------###
        # 循环取出一个框
        for obj in boxes:
            left, top, right, bottom = int(obj[0]), int(obj[1]), int(obj[2]), int(obj[3])
            confidence = obj[4]
            label = int(obj[5])
            # 根据标签获得对应颜色
            color = random_color(label)
            cv2.rectangle(img, (left, top), (right, bottom), color=color, thickness=10, lineType=cv2.LINE_AA)
            # 根据标签拿到检测框的实际类别
            caption = f"{names[label]} {confidence:.2f}"
            w, h = cv2.getTextSize(caption, 0, 1, 2)[0]
            # 在检测框上设置一个矩形并填充写上类别的字
            cv2.rectangle(img, (left - 3, top - 33), (left + w + 10, top), color, -1)
            cv2.putText(img, caption, (left, top - 5), 0, 1, (0, 0, 0), 2, 16)

        plt.imshow(cv2.cvtColor(img, cv2.COLOR_BGR2RGB))
        plt.show()

        cv2.imwrite("predict-pose.jpg", img)
        print("save done")
视频与摄像头侦测:
import cv2
import numpy as np
from ultralytics import YOLO
import matplotlib.pyplot as plt
from tqdm import tqdm
import torch
import time

"""  使用:1 .修改权重路径与主函数下的图片路径。
          2. 如果你需要连线或者修改关键点颜色则对应修改:skeleton,kpt_color, limb_color 这三个参数里的值,把kpt_color里的元素个数改成你自己关键点的个数,我是17个关键点所以17个元素,
             对于limb_color 你要计算你自己的连接线是多少根,我的19根所以有19个元素
          3. 如果只需要绘制关键点,注释掉: ###----------> 连线 <----------下的内容     """


# 有 GPU 就用 GPU,没有就用 CPU
device = torch.device('cuda:0' if torch.cuda.is_available() else 'cpu')
print('device:', device)

# 载入模型
# model = YOLO('yolov8x-pose.pt')
model = YOLO(r'D:\Myself_project\yolov8_pose_pre_whight\ultralytics\Triangle_215\n_pretrain12\weights\best.pt')

# 切换计算设备
model.to(device)

def hsv2bgr(h, s, v):
    h_i = int(h * 6)
    f = h * 6 - h_i
    p = v * (1 - s)
    q = v * (1 - f * s)
    t = v * (1 - (1 - f) * s)

    r, g, b = 0, 0, 0

    if h_i == 0:
        r, g, b = v, t, p
    elif h_i == 1:
        r, g, b = q, v, p
    elif h_i == 2:
        r, g, b = p, v, t
    elif h_i == 3:
        r, g, b = p, q, v
    elif h_i == 4:
        r, g, b = t, p, v
    elif h_i == 5:
        r, g, b = v, p, q

    return int(b * 255), int(g * 255), int(r * 255)


def random_color(id):
    h_plane = (((id << 2) ^ 0x937151) % 100) / 100.0
    s_plane = (((id << 3) ^ 0x315793) % 100) / 100.0
    return hsv2bgr(h_plane, s_plane, 1)

# 需要连接线的对应关键点:如 [16, 14]就是指:标签16与标签14连接   [14, 12]指标签14与标签12连接
skeleton = [[16, 14], [14, 12], [17, 15], [15, 13], [12, 13], [6, 12], [7, 13], [6, 7], [6, 8],
            [7, 9], [8, 10], [9, 11], [2, 3], [1, 2], [1, 3], [2, 4], [3, 5], [4, 6], [5, 7]]

pose_palette = np.array([[255, 128, 0], [255, 153, 51], [255, 178, 102], [230, 230, 0], [255, 153, 255],
                         [153, 204, 255], [255, 102, 255], [255, 51, 255], [102, 178, 255], [51, 153, 255],
                         [255, 153, 153], [255, 102, 102], [255, 51, 51], [153, 255, 153], [102, 255, 102],
                         [51, 255, 51], [0, 255, 0], [0, 0, 255], [255, 0, 0], [255, 255, 255]], dtype=np.uint8)

# 通过索引[16, 16, 16, ......] 对应取pose_palette里的颜色值并存储在列表[]中赋值给kpt_color 既 既关键点的颜色
kpt_color = pose_palette[[16, 0, 9]]

# 通过索引[9, 9, 9, 9, ......] 对应取pose_palette里的颜色值并存储在列表[]中赋值给limb_color 既 既关键点连接线的颜色
limb_color = pose_palette[[9, 9, 9, 9, 7, 7, 7, 0, 0, 0, 0, 0, 16, 16, 16, 16, 16, 16, 16]]

# 逐帧处理图片的函数
def process_frame(img):
    start_time = time.time()
    results = model(img, save=False, show=False, verbose=False)    # verbose设置为False,不单独打印每一帧预测结果
    # 循环拿到一张图片的结果
    for j in range(len(results)):
        result = results[j]
        names = result.names
        boxes = result.boxes.data.tolist()  # 这张图片上所有框的[坐标、置信度、类别]  ---》 [[2815.0, 1043.0, 3546.0, 3374.0, 0.9234039783477783, 0.0], [1645.0, 771.0, 2537.0, 3371.0, 0.9227007031440735, 0.0]]
        # keypoints.data.shape -> n,17,3
        keypoints = result.keypoints.cpu().numpy()
        # img = cv2.imread(result.path)  # result.path : 模型里自动获取当前被处理的图片的路径(if传入的不是图片路径而是一张图片则这里需要注释掉)
        # keypoint -> 每个人的关键点
        for keypoint in keypoints.data:
            for i, (x, y, conf) in enumerate(keypoint):
                color_k = [int(x) for x in kpt_color[i]]  # [0, 255, 0] 取颜色
                if conf < 0.5:
                    continue
                if x != 0 and y != 0:  # 确保不在图像上标记无效或未检测到的关键点
                    cv2.circle(img, (int(x), int(y)), 5, color_k, -1, lineType=cv2.LINE_AA)

            # ###-----------------> 连线 <------------------------
            # for i, sk in enumerate(skeleton):
            #     # pos1 和 pos2 这样的坐标, 会被用来在视觉输出上绘制线段(比如连接身体的两个关键点), sk[0] - 1: 这是获取第一个关键点坐标的索引。因为 sk 数组中的索引可能是从1开始的
            #     pos1 = (int(keypoint[(sk[0] - 1), 0]), int(keypoint[(sk[0] - 1), 1]))  # (3262, 3068)
            #     pos2 = (int(keypoint[(sk[1] - 1), 0]), int(keypoint[(sk[1] - 1), 1]))  # (3340, 2628)
            #
            #     # 获取 连接线需要的两个关键点的置信度
            #     conf1 = keypoint[(sk[0] - 1), 2]
            #     conf2 = keypoint[(sk[1] - 1), 2]
            #     if conf1 < 0.5 or conf2 < 0.5:
            #         continue
            #     if pos1[0] == 0 or pos1[1] == 0 or pos2[0] == 0 or pos2[1] == 0:
            #         continue
            #     cv2.line(img, pos1, pos2, [int(x) for x in limb_color[i]], thickness=2, lineType=cv2.LINE_AA)

        # 循环取出一个框
        for obj in boxes:
            left, top, right, bottom = int(obj[0]), int(obj[1]), int(obj[2]), int(obj[3])
            confidence = obj[4]
            label = int(obj[5])
            # 根据标签获得对应颜色
            color = random_color(label)
            cv2.rectangle(img, (left, top), (right, bottom), color=color, thickness=2, lineType=cv2.LINE_AA)
            # 根据标签拿到检测框的实际类别
            caption = f"{names[label]} {confidence:.2f}"
            w, h = cv2.getTextSize(caption, 0, 1, 2)[0]
            # 在检测框上设置一个矩形并填充写上类别的字
            cv2.rectangle(img, (left - 3, top - 33), (left + w + 10, top), color, -1)
            cv2.putText(img, caption, (left, top - 5), 0, 1, (0, 0, 0), 2, 16)

        # plt.imshow(cv2.cvtColor(img, cv2.COLOR_BGR2RGB))
        # plt.show()

        # cv2.imwrite("predict-pose.jpg", img)
        # print("save done")

    end_time = time.time()
    # 计算处理一帧的时间
    processing_time = end_time - start_time

    # 计算帧率
    fps = 1 / processing_time

    FPS_string = 'FPS   ' + str(int(fps))
    img = cv2.putText(img, FPS_string, (25, 60), cv2.FONT_HERSHEY_SIMPLEX, 1.25, (255, 0, 255), 2)
    return img


def generate_video(input_path='videos/1.mp4'):
    filehead = input_path.split('/')[-1]
    output_path = "out-" + filehead

    print('视频开始处理', input_path)
    # 获取视频总帧数
    cap = cv2.VideoCapture(input_path)
    frame_count = 0
    while cap.isOpened():
        success, frame = cap.read()
        frame_count += 1
        if not success:
            break
    cap.release()
    print('视频总帧数为', frame_count)

    cap = cv2.VideoCapture(input_path)
    frame_size = (cap.get(cv2.CAP_PROP_FRAME_WIDTH), cap.get(cv2.CAP_PROP_FRAME_HEIGHT))

    # fourcc = int(cap.get(cv2.CAP_PROP_FOURCC))
    # fourcc = cv2.VideoWriter_fourcc(*'XVID')
    fourcc = cv2.VideoWriter_fourcc(*'mp4v')
    fps = cap.get(cv2.CAP_PROP_FPS)

    out = cv2.VideoWriter(output_path, fourcc, fps, (int(frame_size[0]), int(frame_size[1])))
    # 进度条绑定视频总帧数
    with tqdm(total=frame_count - 1) as pbar:
        try:
            while (cap.isOpened()):
                success, frame = cap.read()
                if not success:
                    print("Error: Failed to read frame.")
                    break

                # 处理帧
                # frame_path = './temp_frame.png'
                # cv2.imwrite(frame_path, frame)
                try:
                    frame = process_frame(frame)
                except:
                    print('process_frame函数出现:error')
                    pass

                if success == True:
                    cv2.imshow('Video Processing', frame)
                    out.write(frame)

                    # 进度条更新一帧
                    pbar.update(1)

                if cv2.waitKey(25) & 0xFF == ord('q'):
                    break
        except:
            print('中途中断')
            pass

    cv2.destroyAllWindows()
    out.release()
    cap.release()
    print('视频已保存', output_path)


def predict_camera(num):
    # 获取摄像头,0为电脑默认摄像头,1为外接摄像头
    cap = cv2.VideoCapture(num)
    # 打开cap
    cap.open(num)

    # 无限循环,直到break被触发
    while cap.isOpened():

        # 获取画面
        success, frame = cap.read()

        if not success:  # 如果获取画面不成功,则退出
            print('获取画面不成功,退出')
            break

        try:
            ## 逐帧处理
            frame = process_frame(frame)
        except:
            print('process_frame出现问题')


        # 展示处理后的三通道图像
        cv2.imshow('my_window', frame)

        key_pressed = cv2.waitKey(60)  # 每隔多少毫秒毫秒,获取键盘哪个键被按下
        # print('键盘上被按下的键:', key_pressed)

        if key_pressed in [ord('q'), 27]:  # 按键盘上的q或esc退出(在英文输入法下)
            break

    # 关闭摄像头
    cap.release()

    # 关闭图像窗口
    cv2.destroyAllWindows()


if __name__ == "__main__":
    # 视频预测
    generate_video(input_path='videos/triangle_pose/triangle_6.mp4')

    # ## 一张图片预测
    # img = cv2.imread('images/2.png')
    # img = process_frame(img)
    # plt.imshow(cv2.cvtColor(img, cv2.COLOR_BGR2RGB))
    # plt.show()

    # 摄像头预测
    # predict_camera(0)


 1873
1873


 被折叠的 条评论
为什么被折叠?
被折叠的 条评论
为什么被折叠?
 到【灌水乐园】发言


