


1. 需要的包
rm(list=ls())
library(dplyr)
library(table1)
2. 示例数据
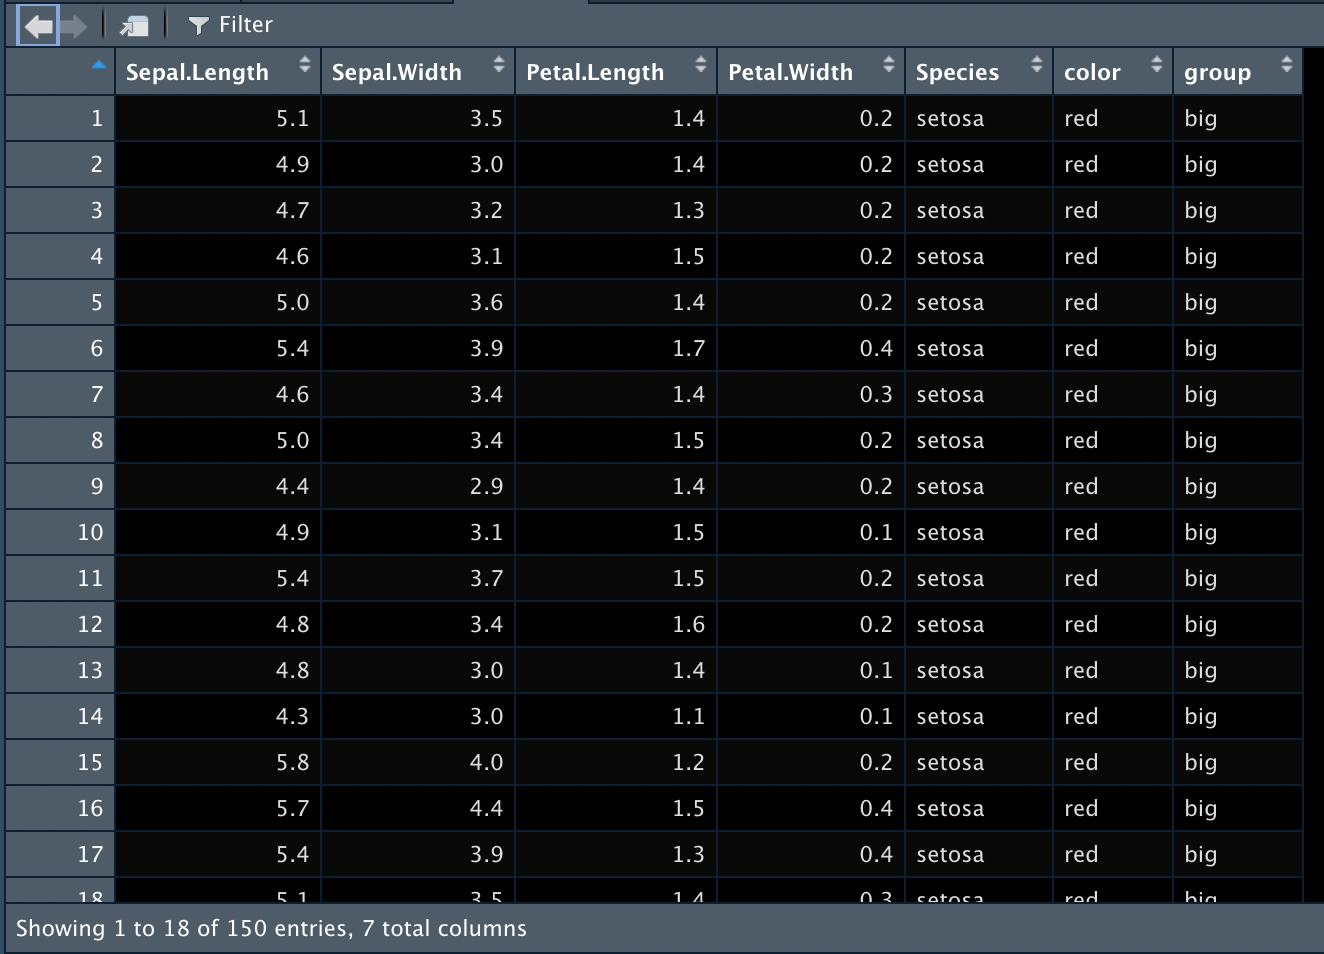
- 本次使用的是大名鼎鼎的iris,这里你可以替换成你的数据
dat <- iris %>%
  mutate(.,color = rep(c("red","blue","green"), each = 50)) %>%
  mutate(.,group = rep(c("big","small"), each = 75)) #在这里新增2列,后面会用到 (无中生有!,,Ծ‸Ծ,,)

view(dat) #数据不大, 这里就view一下吧~ ๐•ᴗ•๐
3. 给变量添加单位(可选)
- 这里以变量Sepal.Length和Sepal.Width为例,添加单位,将在三线表中显示。
units(dat$Sepal.Length)   <- "mm"
units(dat$Sepal.Width)    <- "mm"
4. 开始绘制三线表
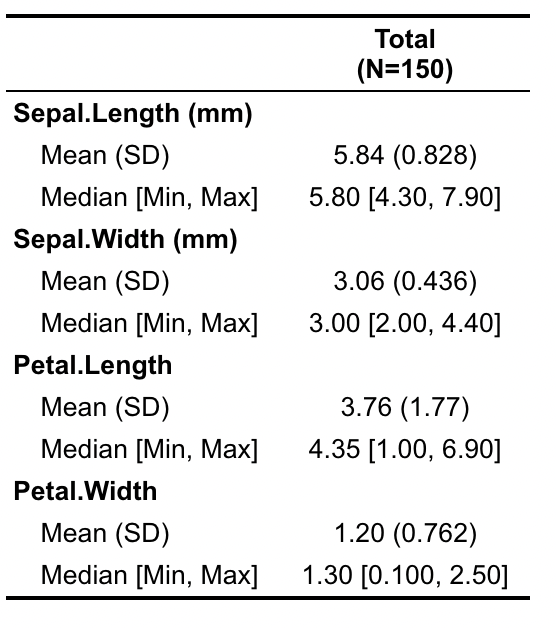
4.1 初步绘制
table1(~ Sepal.Length +
         Sepal.Width +
         Petal.Length +
         Petal.Width, # 以上均为变量
       data=dat,  # 你的数据
       overall = "Total")
4.2 分组绘制 (单变量分组)
- 以Species为分组变量进行统计
table1(~ Sepal.Length +
         Sepal.Width +
         Petal.Length +
         Petal.Width | Species, #Species为分组变量
       data=dat,  # 你的数据
       overall = "Total")

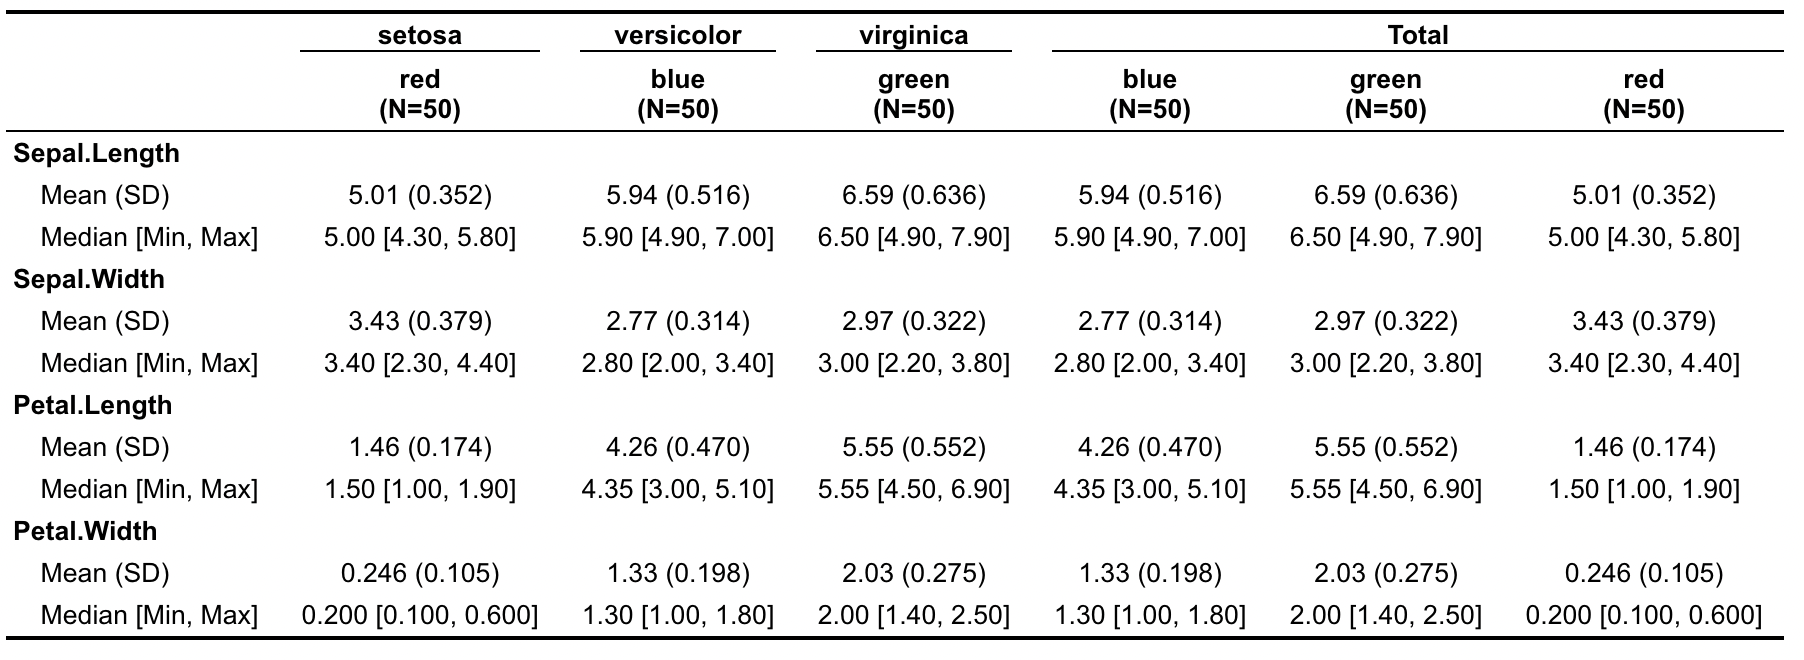
4.3 分组绘制 (双变量分组)
- 由于iris没有第二个分组变量,我们在之前新增了一列color作为分层变量
table1(~ Sepal.Length +
         Sepal.Width +
         Petal.Length +
         Petal.Width | Species*color, #Species为分组变量,color为分层变量
       data=dat,  # 你的数据
       overall = "Total")
- Note: 这里大家要注意var*var前后顺序,意义是不一样的,我们调换一下Species和color的顺序
table1(~ Sepal.Length +
         Sepal.Width +
         Petal.Length +
         Petal.Width | color*Species, #color为分组变量,Species为分层变量
       data=dat,  # 你的数据
       overall = "Total")

5. 填加统计值
5.1 自定义函数计算统计值
- 这个包美中不足的地方,没有统计值啊~,大家复制这段代码添加统计值
pvalue <- function(x, ...) {
# Construct vectors of data y, and groups (strata) g
y <- unlist(x)
g <- factor(rep(1:length(x), times=sapply(x, length)))
if (is.numeric(y)) {
# For numeric variables, perform a standard 2-sample t-test
p <- t.test(y ~ g)$p.value
} else {
# For categorical variables, perform a chi-squared test of independence
p <- chisq.test(table(y, g))$p.value
}
# Format the p-value, using an HTML entity for the less-than sign.
# The initial empty string places the output on the line below the variable label.
c("", sub("<", "<", format.pval(p, digits=3, eps=0.001)))
}
stats <- function(x, ...) {
y <- unlist(x)
g <- factor(rep(1:length(x), times=sapply(x, length)))
if (is.numeric(y)) {
s <- t.test(y ~ g)$statistic
} else {
s <- chisq.test(table(y, g))$statistic
}
c("", sprintf("%.4f", s))
}
5.2 绘制带统计值的三线表
table1(~ Sepal.Length +
           Sepal.Width +
           Petal.Length +
           Petal.Width | group,
         data=dat,
         overall = F,
         extra.col=list(`P-value`=pvalue, `statistic`=stats))


点个在看吧各位~ ✐.ɴɪᴄᴇ ᴅᴀʏ 〰


 被折叠的 条评论
为什么被折叠?
被折叠的 条评论
为什么被折叠?
 到【灌水乐园】发言


