


1写在前面
最近天天下雨,真是下得我没脾气啊,动不动就淋成狗。😭
下雨也就算了,还特别热。🤒
不知道是不是人到中年了,事情也特别的多,能静下心来思考的时间越来越少了。😞
也越来越明白,为什么大家会说希望家里人身体都健健康康的,这个真的是最重要的事情了。🥸
今天分享的是环形barplot,颜值还是蛮高的,大家试试吧!~🥳
配个BGM吧,Leonard Cohen的Hallelujah!~😘
2用到的包
rm(list = ls())
library(tidyverse)
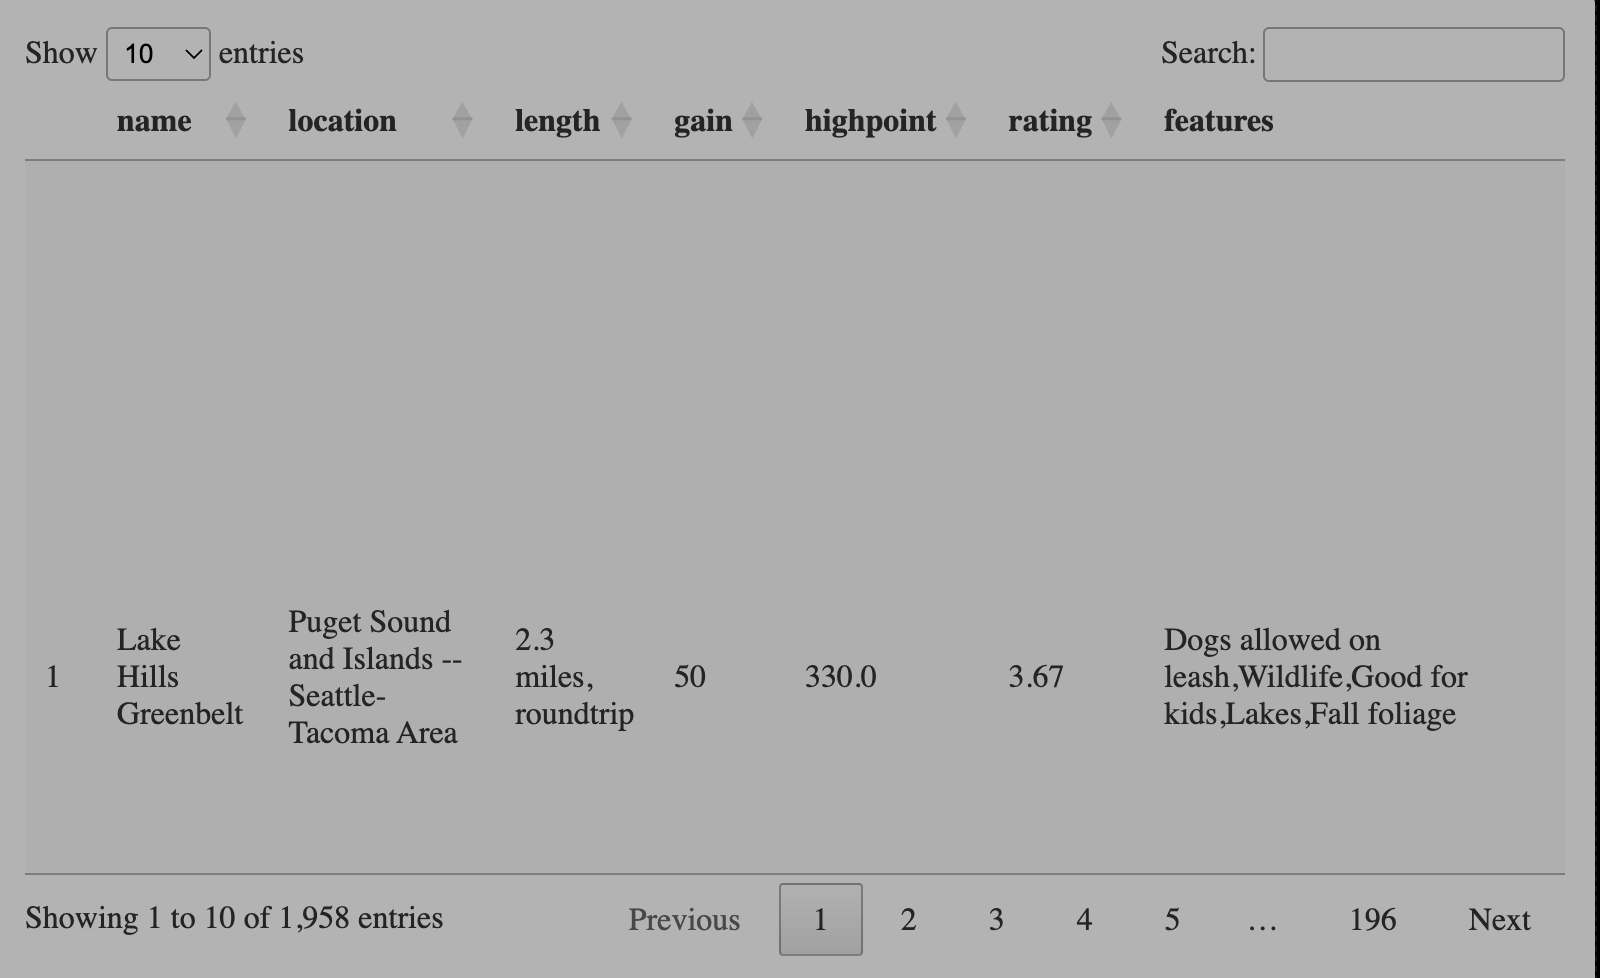
3示例数据
hike_data <- readr::read_rds("./hike_data.rds")

DT::datatable(hike_data)
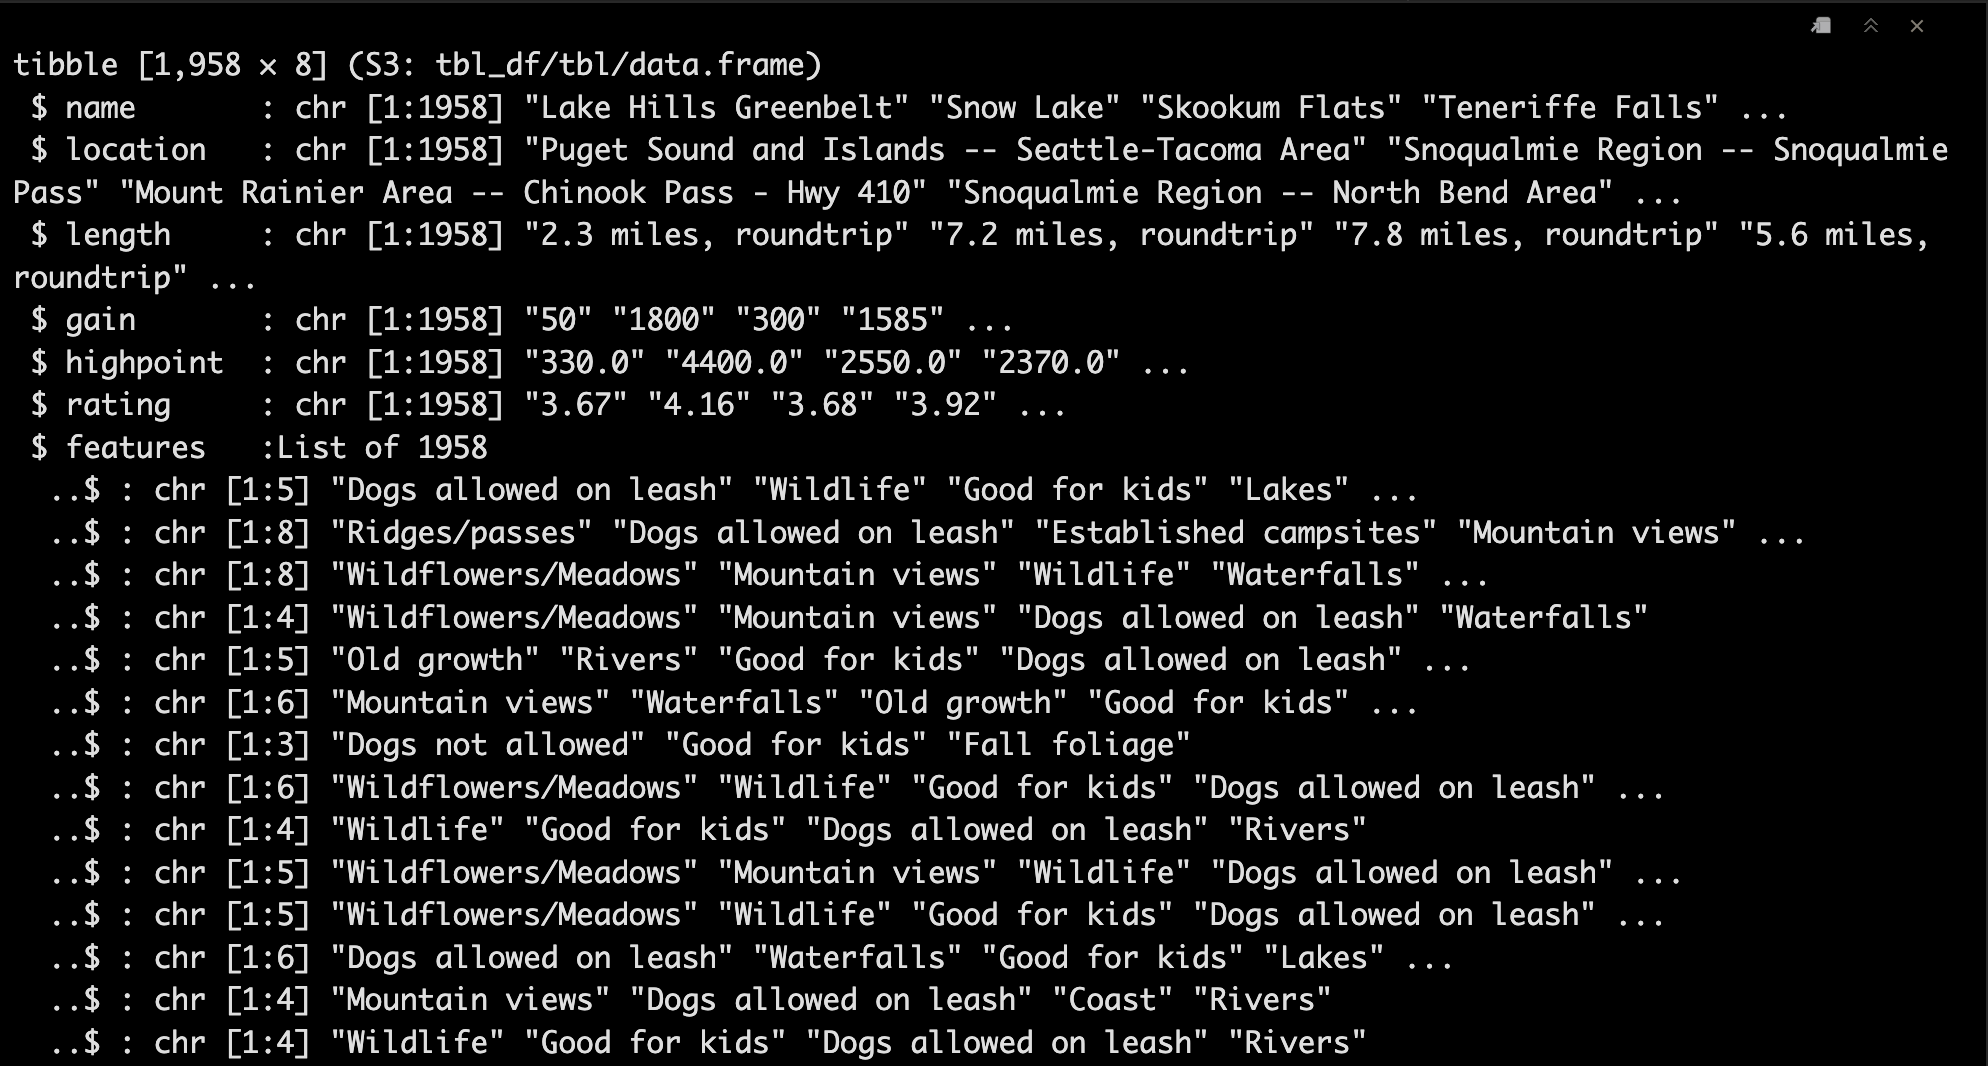
4查看数据特征
str(hike_data)
5清洗数据
5.1 提取region信息并因子化
hike_data$region <- as.factor(word(hike_data$location, 1, sep = " -- "))
5.2 提取number of miles
这里大家记得转成number格式,要不然后面会报错的。🤣
hike_data$length_num <- as.numeric(sapply(strsplit(hike_data$length, " "), "[[", 1))
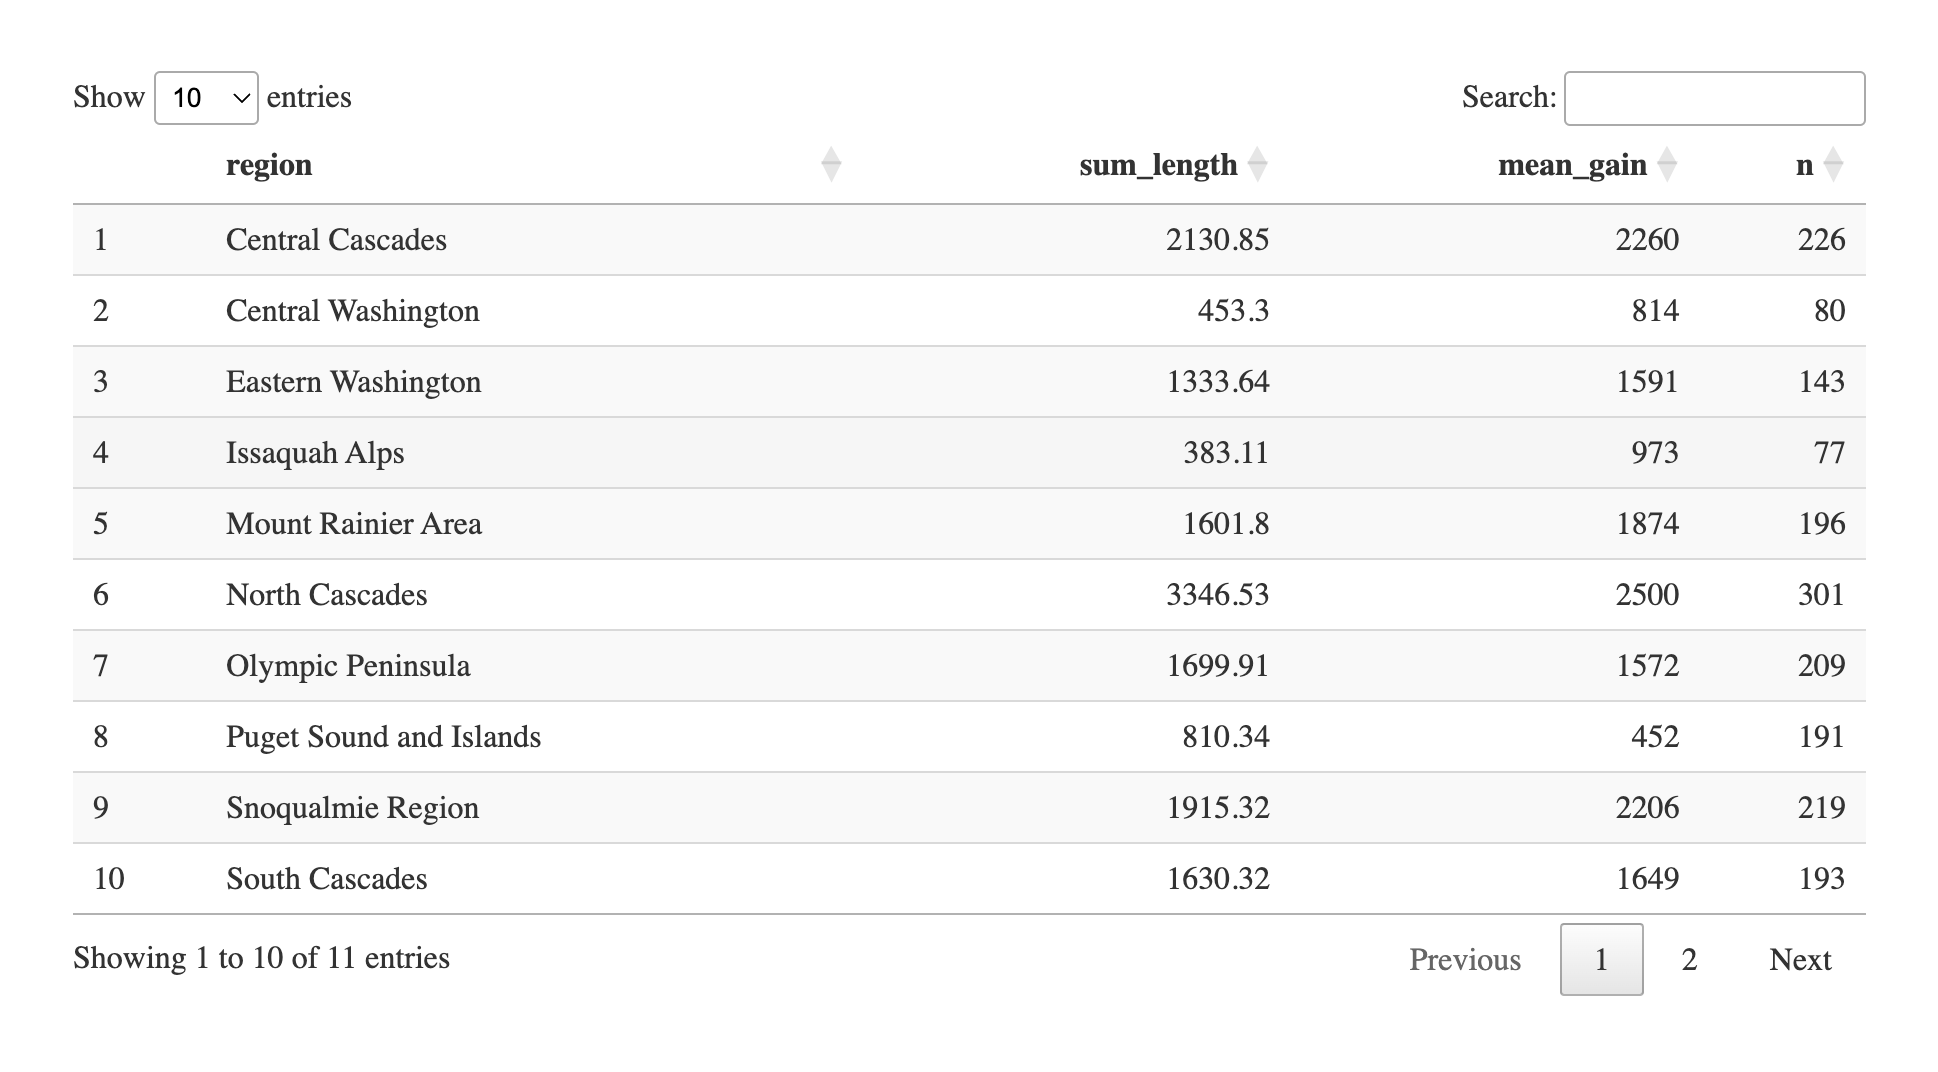
5.3 计算其他画图数据
接着,计算每个region的cumulative length和mean gain,并计算每个region的number of tracks。
plot_df <- hike_data %>%
  group_by(region) %>%
  summarise(
    sum_length = sum(length_num),
    mean_gain = mean(as.numeric(gain)),
    n = n()
  ) %>%
  mutate(mean_gain = round(mean_gain, digits = 0))

DT::datatable(plot_df)
6开始绘图
6.1 初步绘图
p <- ggplot(plot_df) +
  # Make custom panel grid
  geom_hline(
    aes(yintercept = y),
    data.frame(y = c(0:3) * 1000),
    color = "lightgrey"
  ) +
  geom_col(
    aes(
      x = reorder(str_wrap(region, 5), sum_length),
      y = sum_length,
      fill = n
    ),
    position = "dodge2",
    show.legend = T,
    alpha = .9
  ) +
  geom_point(
    aes(
      x = reorder(str_wrap(region, 5),sum_length),
      y = mean_gain
    ),
    size = 3,
    color = "gray12"
  ) +

  geom_segment(
    aes(
      x = reorder(str_wrap(region, 5), sum_length),
      y = 0,
      xend = reorder(str_wrap(region, 5), sum_length),
      yend = 3000
    ),
    linetype = "dashed",
    color = "gray12"
  ) +
  coord_polar()

p

6.2 添加注释并修改颜色
p <- p +
  annotate(
    x = 11,
    y = 1300,
    label = "Mean Elevation Gain\n[FASL]",
    geom = "text",
    angle = -67.5,
    color = "gray12",
    size = 2.5
  ) +
  annotate(
    x = 11,
    y = 3150,
    label = "Cummulative Length [FT]",
    geom = "text",
    angle = 23,
    color = "gray12",
    size = 2.5
  ) +
  annotate(
    x = 11.7,
    y = 1100,
    label = "1000",
    geom = "text",
    color = "gray12"
  ) +
  annotate(
    x = 11.7,
    y = 2100,
    label = "2000",
    geom = "text",
    color = "gray12"
  ) +
  annotate(
    x = 11.7,
    y =3100,
    label = "3000",
    geom = "text",
    color = "gray12"
  ) +
  scale_y_continuous(
    limits = c(-1500, 3500),
    expand = c(0, 0),
    breaks = c(0, 1000, 2000, 3000)
  ) +
  scale_fill_gradientn(
    "Amount of Tracks",
     colours = c( "#6C5B7B","#C06C84","#F67280","#F8B195")
  ) +
  guides(
    fill = guide_colorsteps(
      barwidth = 15, barheight = .5, title.position = "top", title.hjust = .5
    )
  ) +
  theme(
    axis.title = element_blank(),
    axis.ticks = element_blank(),
    axis.text.y = element_blank(),
    axis.text.x = element_text(color = "gray12", size = 12),
    legend.position = "bottom",
  )

p

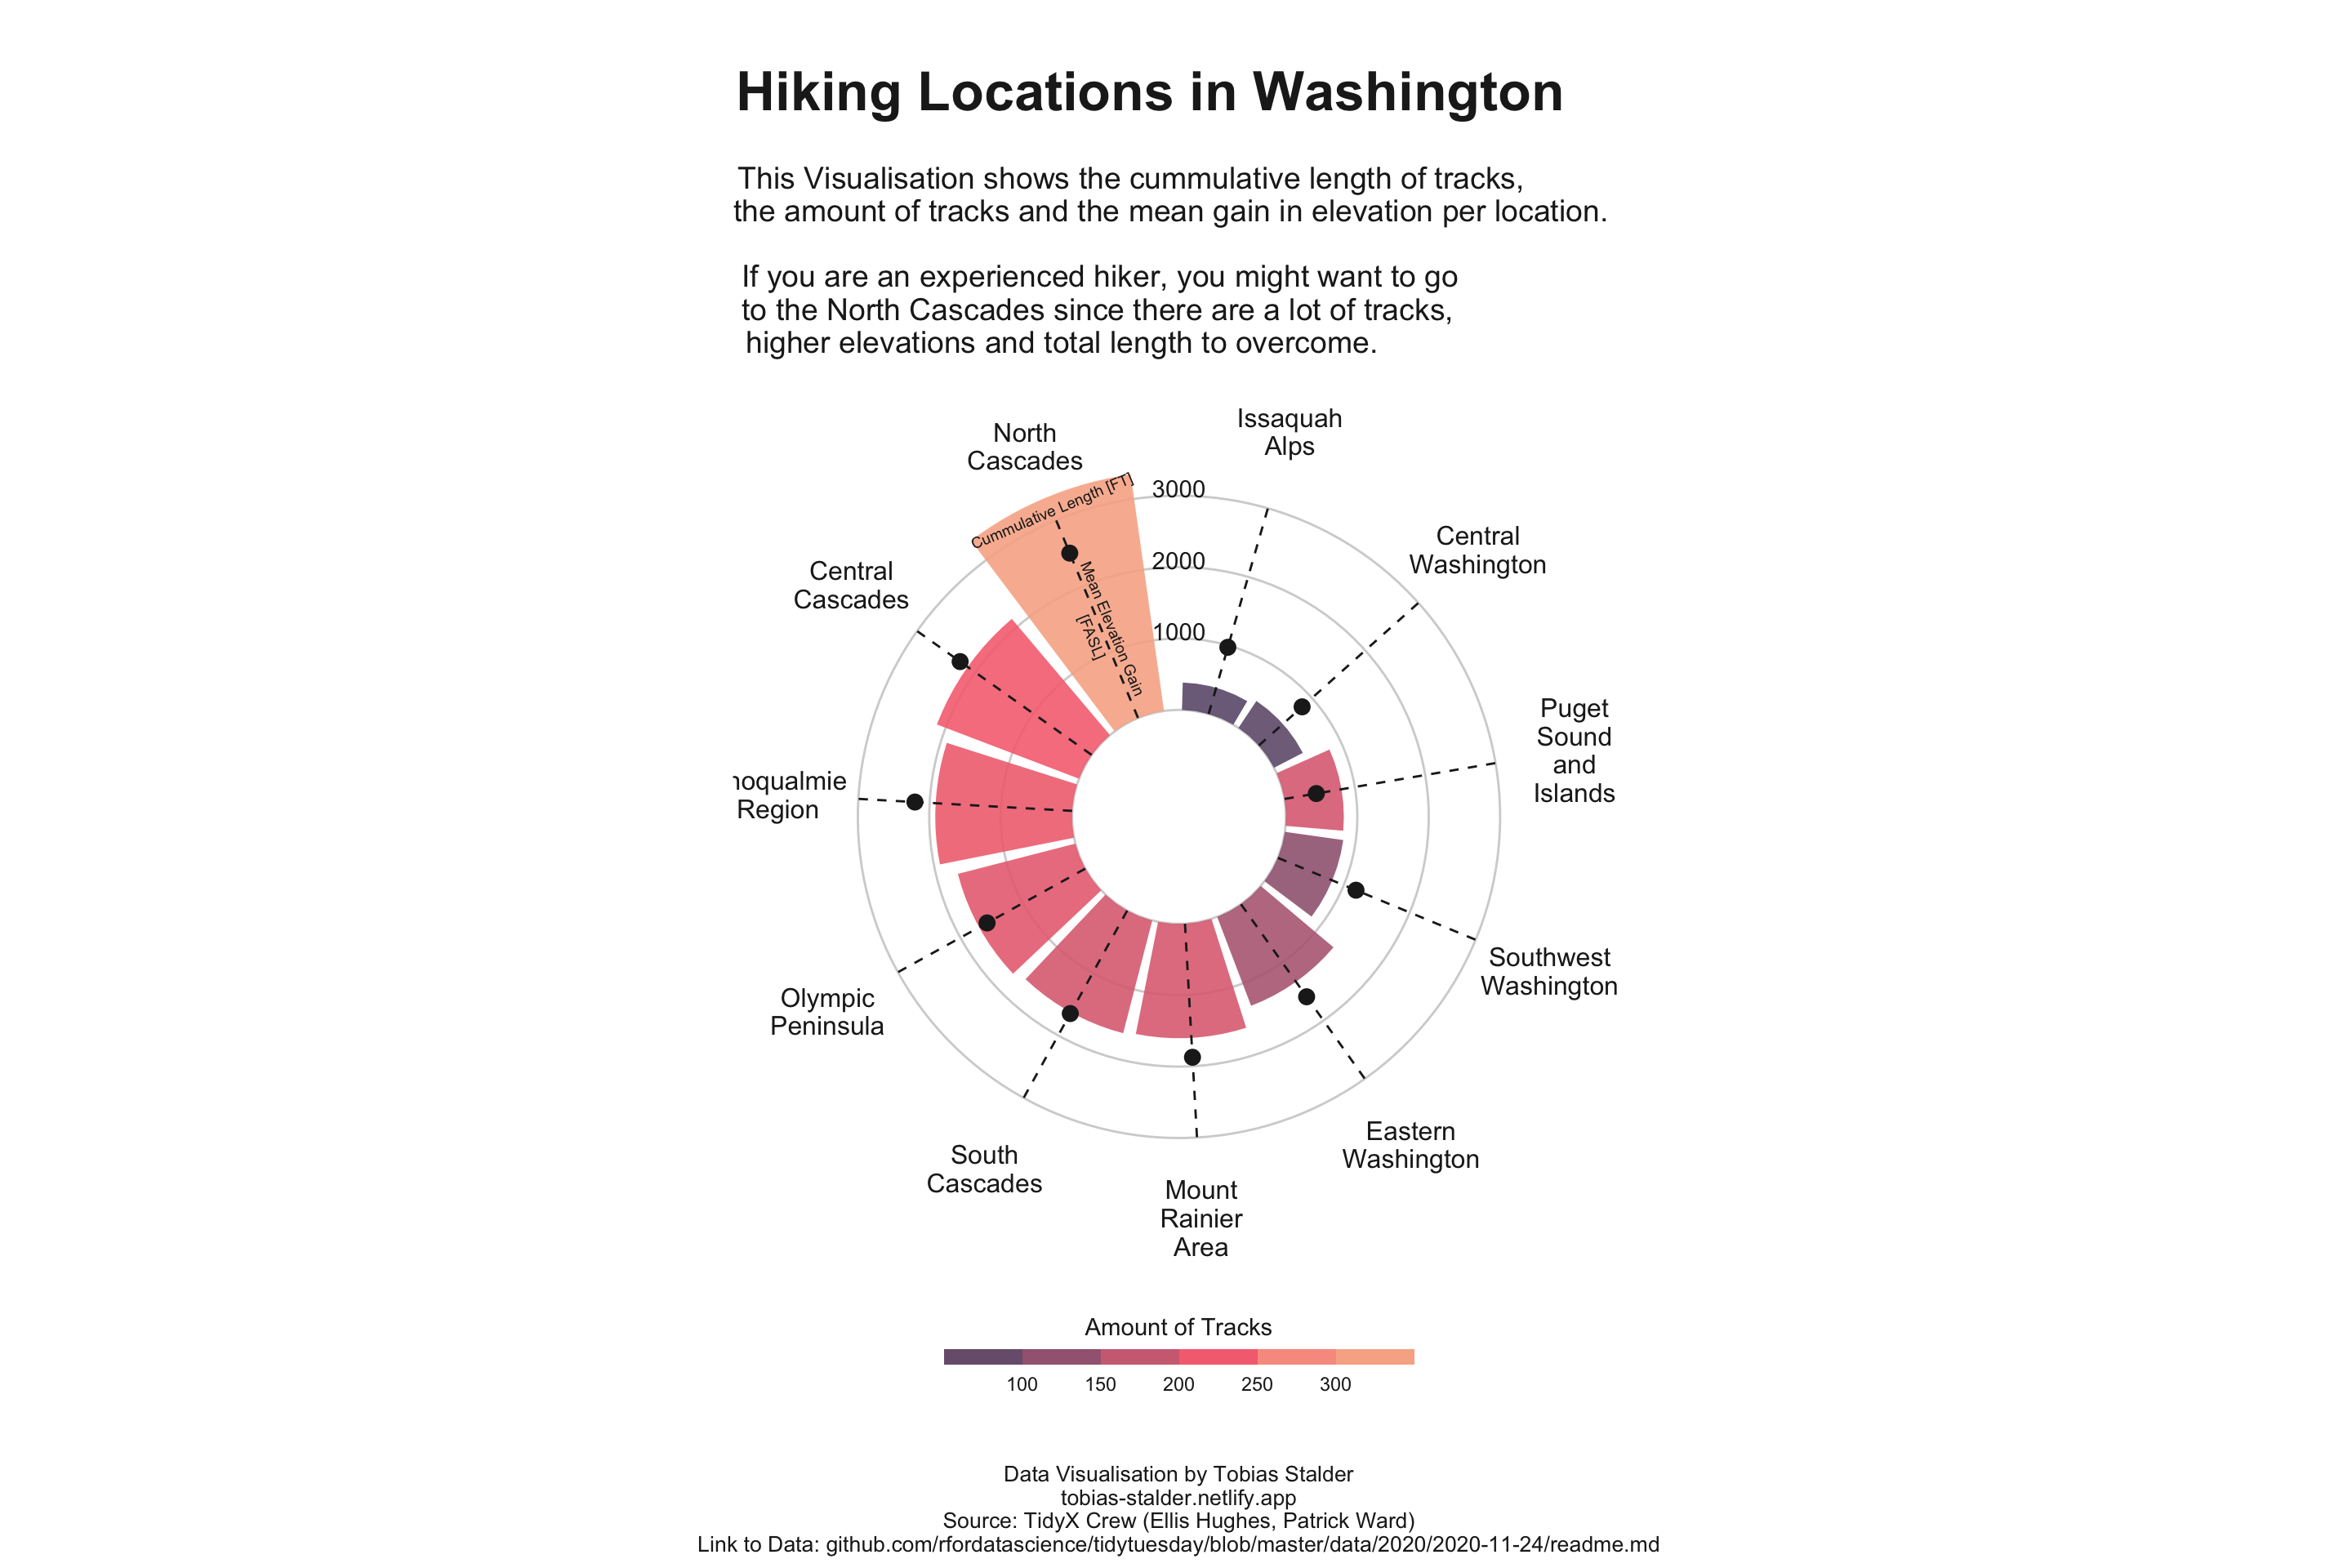
6.3 添加title和其他信息
p <- p +
  labs(
    title = "\nHiking Locations in Washington",
    subtitle = paste(
      "\nThis Visualisation shows the cummulative length of tracks,",
      "the amount of tracks and the mean gain in elevation per location.\n",
      "If you are an experienced hiker, you might want to go",
      "to the North Cascades since there are a lot of tracks,",
      "higher elevations and total length to overcome.",
      sep = "\n"
  ),
    caption = "\n\nData Visualisation by Tobias Stalder\ntobias-stalder.netlify.app\nSource: TidyX Crew (Ellis Hughes, Patrick Ward)\nLink to Data: github.com/rfordatascience/tidytuesday/blob/master/data/2020/2020-11-24/readme.md") +
  theme(
    text = element_text(color = "gray12"),
    plot.title = element_text(face = "bold", size = 25, hjust = 0.05),
    plot.subtitle = element_text(size = 14, hjust = 0.05),
    plot.caption = element_text(size = 10, hjust = .5),
    panel.background = element_rect(fill = "white", color = "white"),
    panel.grid = element_blank(),
    panel.grid.major.x = element_blank()
  )
p

点个在看吧各位~ ✐.ɴɪᴄᴇ ᴅᴀʏ 〰
📍 🤣 chatPDF | 别再自己读文献了!让chatGPT来帮你读吧!~
📍 🤩 WGCNA | 值得你深入学习的生信分析方法!~
📍 🤩 ComplexHeatmap | 颜狗写的高颜值热图代码!
📍 🤥 ComplexHeatmap | 你的热图注释还挤在一起看不清吗!?
📍 🤨 Google | 谷歌翻译崩了我们怎么办!?(附完美解决方案)
📍 🤩 scRNA-seq | 吐血整理的单细胞入门教程
📍 🤣 NetworkD3 | 让我们一起画个动态的桑基图吧~
📍 🤩 RColorBrewer | 再多的配色也能轻松搞定!~
📍 🧐 rms | 批量完成你的线性回归
📍 🤩 CMplot | 完美复刻Nature上的曼哈顿图
📍 🤠 Network | 高颜值动态网络可视化工具
📍 🤗 boxjitter | 完美复刻Nature上的高颜值统计图
📍 🤫 linkET | 完美解决ggcor安装失败方案(附教程)
📍 ......
本文由 mdnice 多平台发布


 3093
3093

 被折叠的 条评论
为什么被折叠?
被折叠的 条评论
为什么被折叠?
 到【灌水乐园】发言


