


reason:之前总是习惯用python来进行可视化,但遇到线性规划等问题时,matlab的优势还是很明显的,使用matlab进行可视化的效果也很不错。本文内容源于B站up主“数学建模老哥”,笔者在此做一下听课的笔记分享~~
1.二维图
%二维图
clear;clc;close all;
x = linspace(1,200,100);
y1 = log(x)+1;
y2 = log(x)+2;
figure;
plot(x, y1);
hold on
plot(x, y2, 'LineWidth',2);
hold off
legend('y1','y2');
%二维散点图
figure;
y3 = y1 + rand(1,100) - 0.5;
plot(x,y1,'LineWidth',2,'Color',[0.21,0.21,0.67]);
hold on
plot(x,y3,'o','LineWidth',2,'Color',[0.46,0.63,0.90],'MarkerFaceColor',[0.35,0.90,0.89],'MarkerEdgeColor',[0.18,0.62,0.17]);
hold off
%二维渐变图
x = linspace(0,3*pi,200);
y = cos(x) + rand(1,200);
sz = 25;%圆圈的大小
c = linspace(1,10,length(x));
scatter(x,y,sz,c,'filled')
%二维场图
[x,y] = meshgrid(0:0.1:1,0:0.1:1);
u = x;
v = -y;
startx = 0.1:0.1:0.9;
starty = ones(size(startx));
figure
quiver(x,y,u,v);
streamline(x,y,u,v,startx,starty);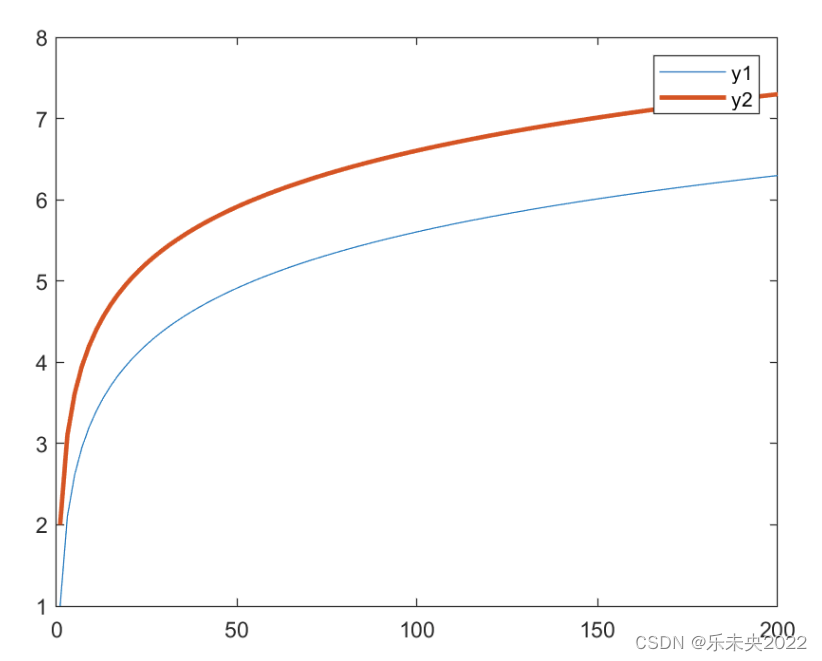
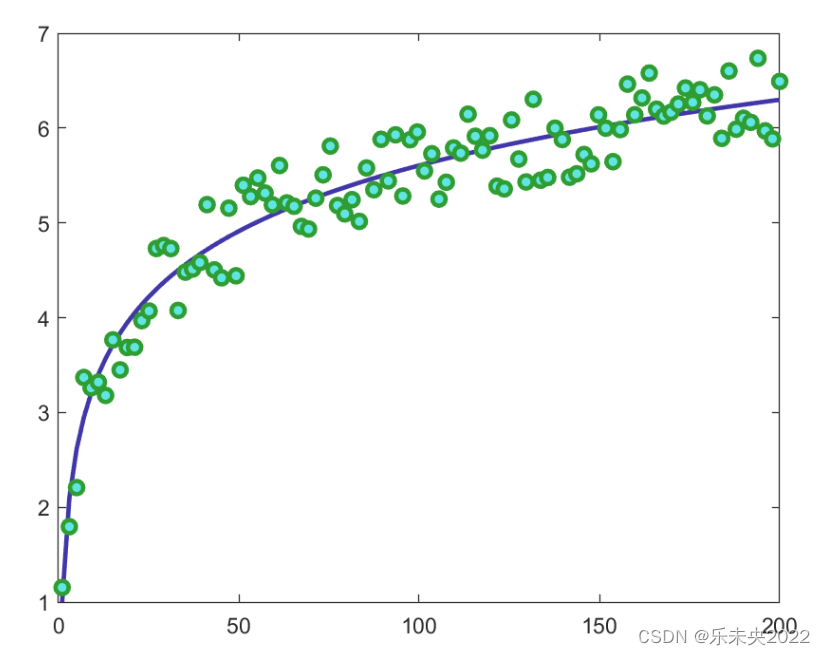
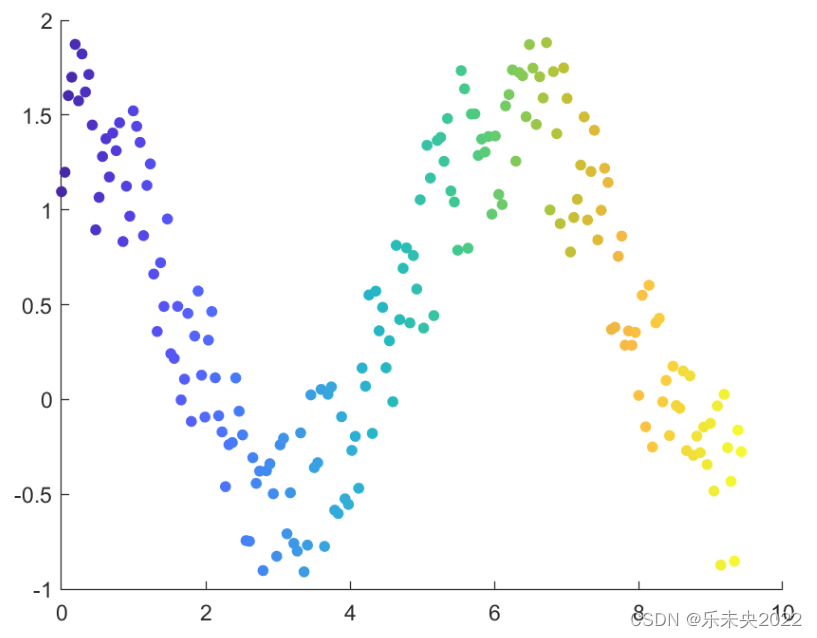
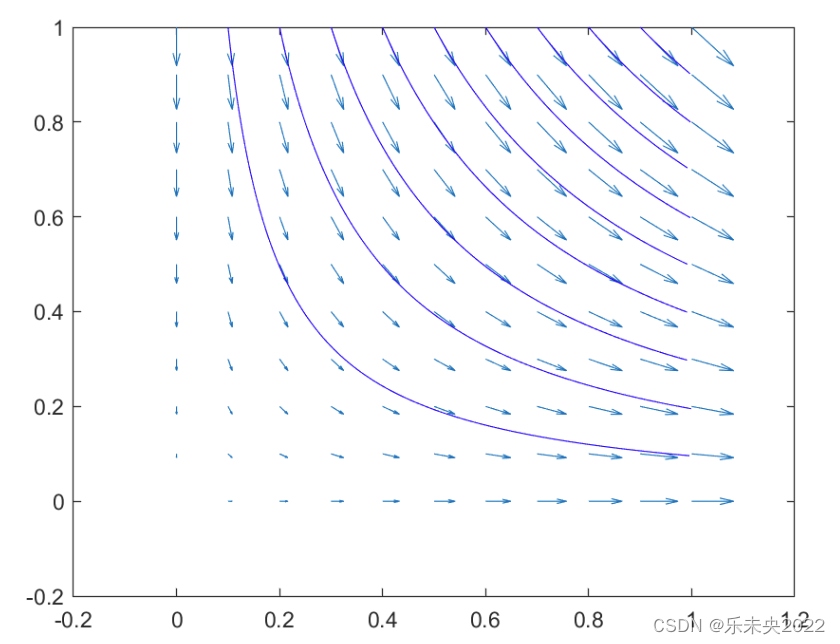
这种图还是比较简单的,只需要设置一下相关参数即可(散点图还可以设置圆圈内部和边缘的颜色)。
2.三维图
%三维图
[X, Y] = meshgrid(-8:.5:8);
R = sqrt(X.^2 + Y.^2) + eps;
Z = sin(R)./R;
mesh(X, Y, Z)
%三维曲线图
figure
t = 0:pi/20:10*pi;
xt = sin(t);
yt = cos(t);
plot3(xt,yt,t,'-o','Color','b','MarkerSize',10);
%三维散点图
x = linspace(1,200,100);
y1 = log(x)+1;
y2 = log(x)+2;
y3 = y1 + rand(1,100)-0.5;
figure;
scatter3(x,y2,y3,x,x,'filled');
%三维伪彩图
[x,y,z] = peaks(30);
figure;
plot1 = subplot(1,2,1);
surf(x,y,z);
plot2 = subplot(1,2,2);
surf(x,y,z);
colormap(hot);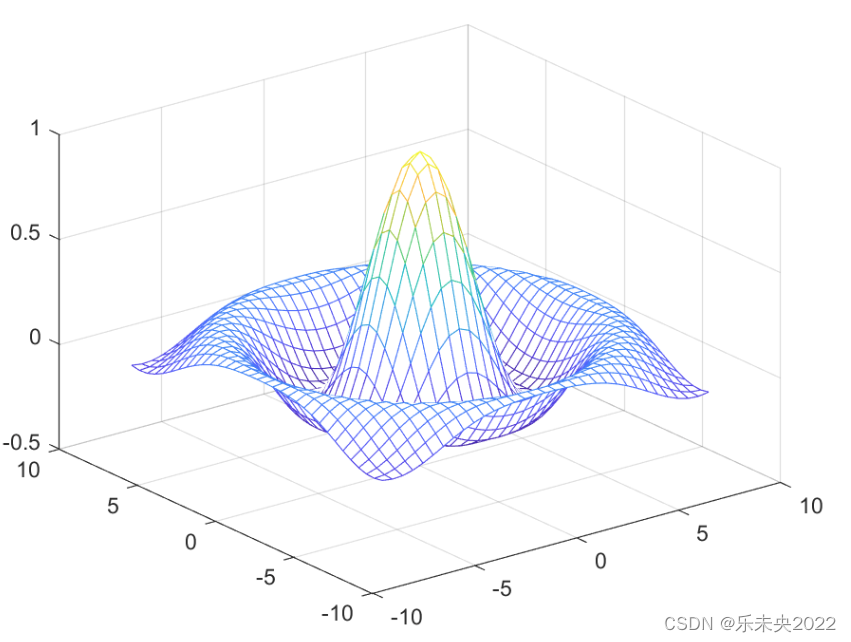
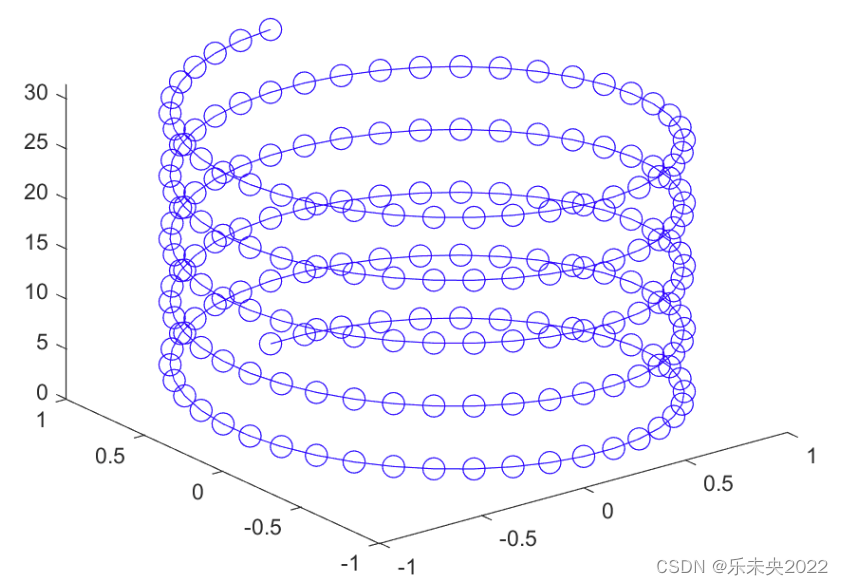
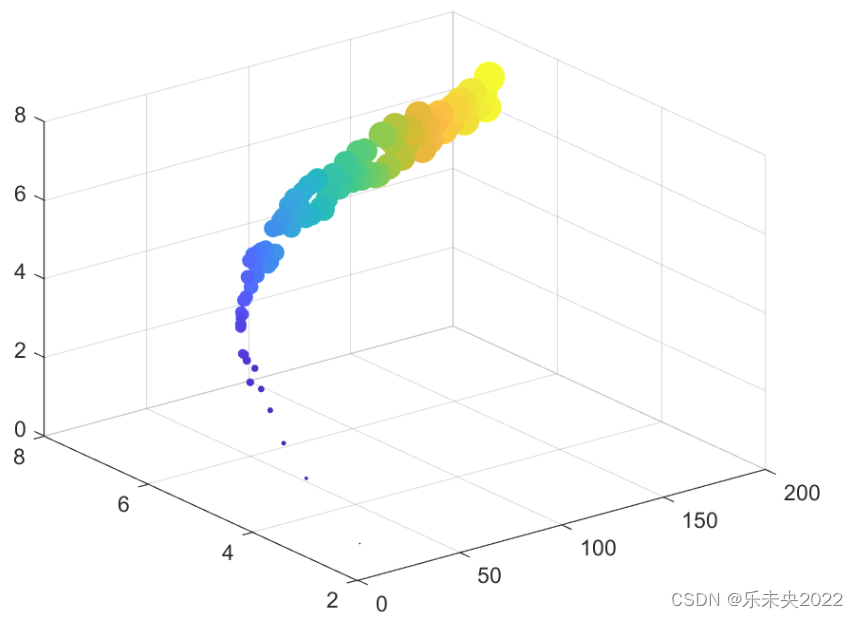
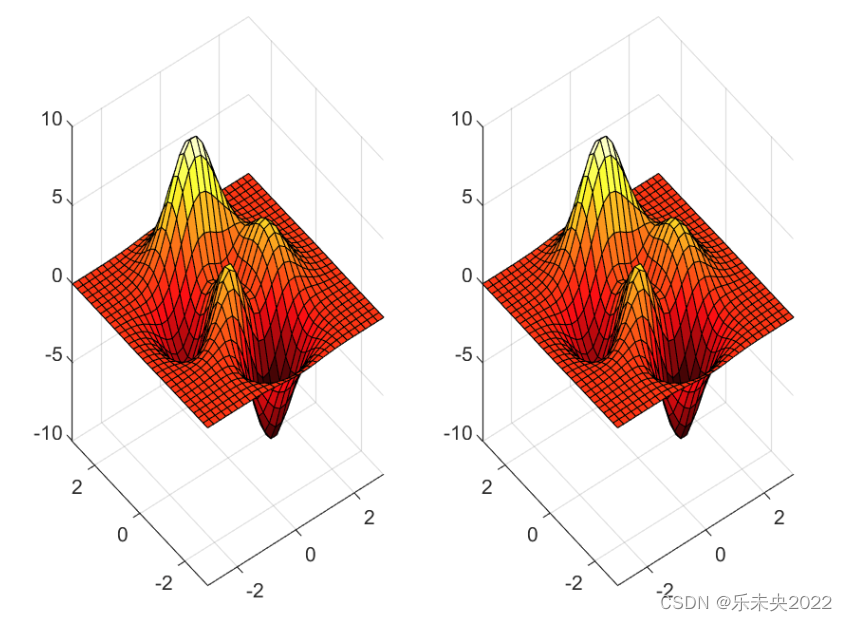
三维图相比于二维图,主要是多了一个维度,因此引用的函数也需要变化。
3.箭头图&棱柱
%箭头图
[x, y] = meshgrid(-2:.2:2);
z = x.*exp(-x.^2 - y.^2);
[dx, dy] = gradient(z, .2, .2);
figure
contour(x, y, z)
hold on
quiver(x, y, dx, dy)
hold off
%棱柱
cylinder(2,5)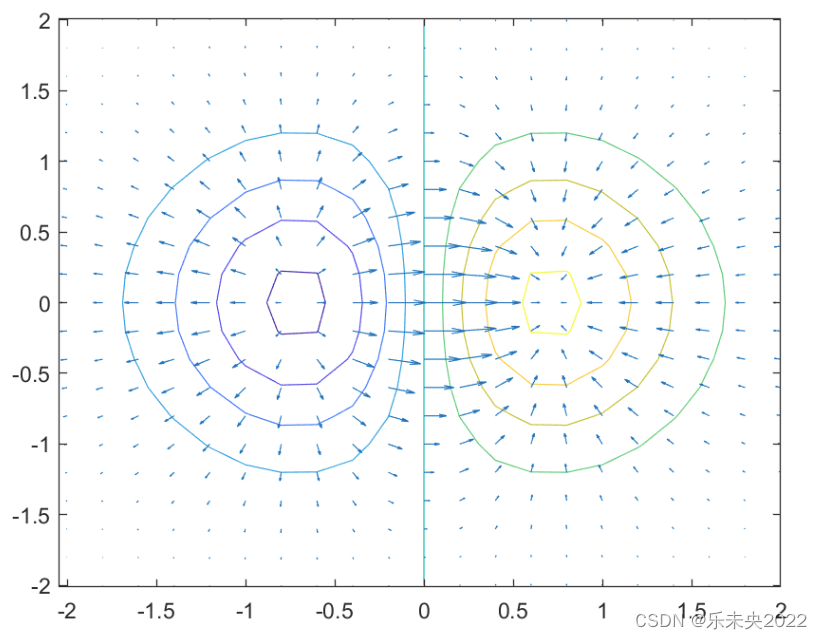
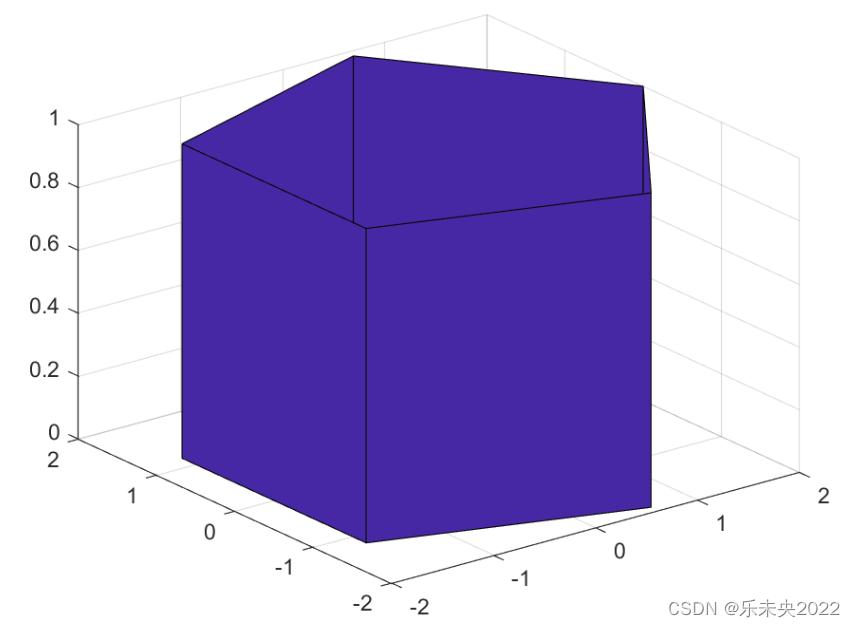
前者更多适用于物理型题目,后者则直接调用cylinder()函数。需要注意的是,圆柱的画法直接在棱柱的基础上修改数量即可,边缘上的点多了,其形状就更接近圆柱。
4.条形图&多y轴图
%条形图
A = [60.689;87.714;143.1;267.9515];
C = [127.5;160.4;231.9;400.2]
B = C - A;
D = [A,B,C];
bar1 = bar([2:5:17], A,'BarWidth',0.2,'FaceColor','k');
%多y轴图
figure
load('accidents.mat', "hwydata")
ind = 1:51;
drivers = hwydata(:,5);
yyaxis left
scatter(ind, drivers,'LineWidth',2);
title('HighWay Data');
xlabel('States');
ylabel('Licensed Drivers (thousands)');
pop = hwydata(:,7);
yyaxis right
scatter(ind, pop, 'LineWidth',2);
ylabel('Vehicle Miles Traveled(millions)');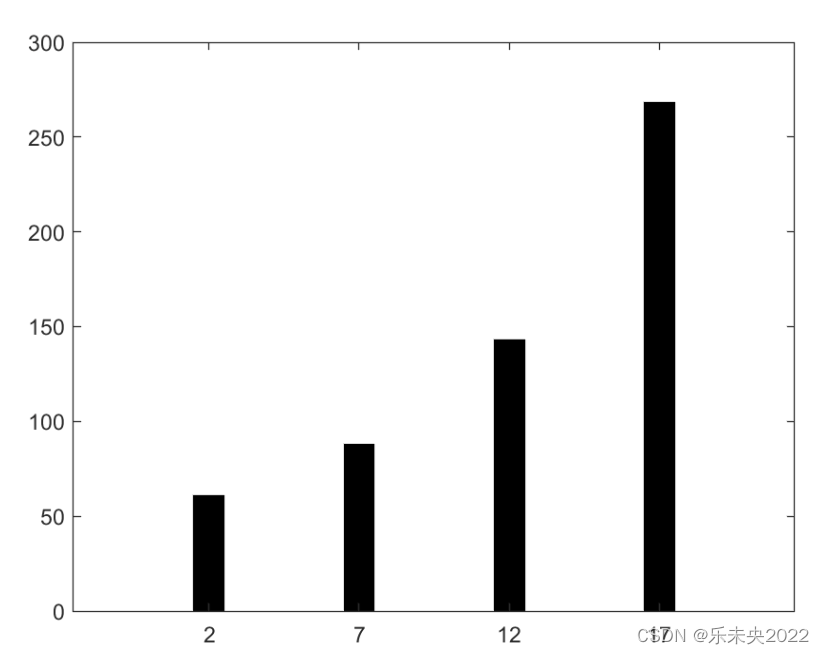
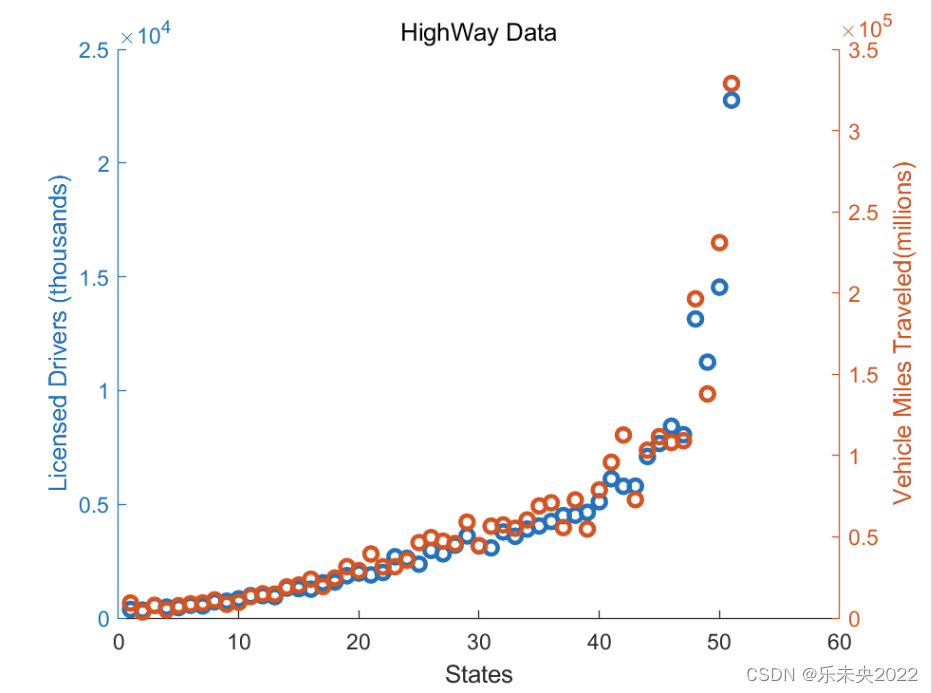
笔者认为,如果只是简单的条形图的话,直接用excel作图就很好了;而多y轴图则可在matlab上画,分为左右y轴,在一个画布上作图,效果比excel好一些。
5.填充图&等高线图
%填充图
x = 0.4:0.1:2*pi;
y1 = sin(2*x);
y2 = sin(x);
maxY = max([y1;y2]);
minY = min([y1;y2]);
xFill = [x, fliplr(x)];
yFill = [maxY,fliplr(minY)];
figure
fill(xFill, yFill, [0.21, 0.21, 0.67]);
hold on
plot(x, y1, 'k', 'LineWidth',2)
plot(x, y2, 'k', 'LineWidth',2)
hold off
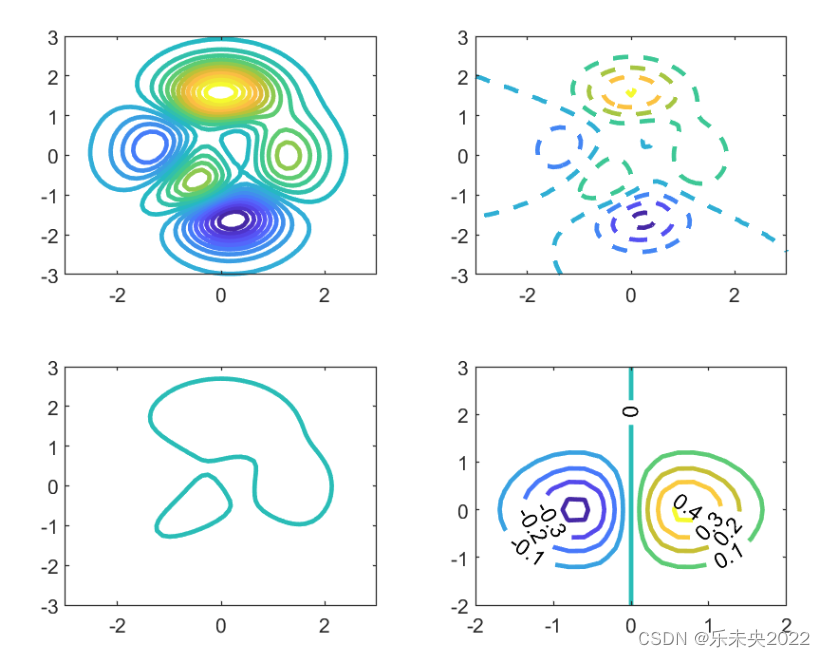
%等高线图
figure;
[X,Y,Z] = peaks;
subplot(2,2,1);
contour(X,Y,Z,20,'LineWidth',2);
subplot(2,2,2);
contour(X,Y,Z,'--','LineWidth',2)
subplot(2,2,3);
v = [1,1];
contour(X,Y,Z,v,'LineWidth',2);
x = -2:0.2:2;
y = -2:0.2:3;
[X,Y] = meshgrid(x,y);
Z = X.*exp(-X.^2-Y.^2);
subplot(2,2,4);
contour(X,Y,Z,'ShowText','on','LineWidth',2);
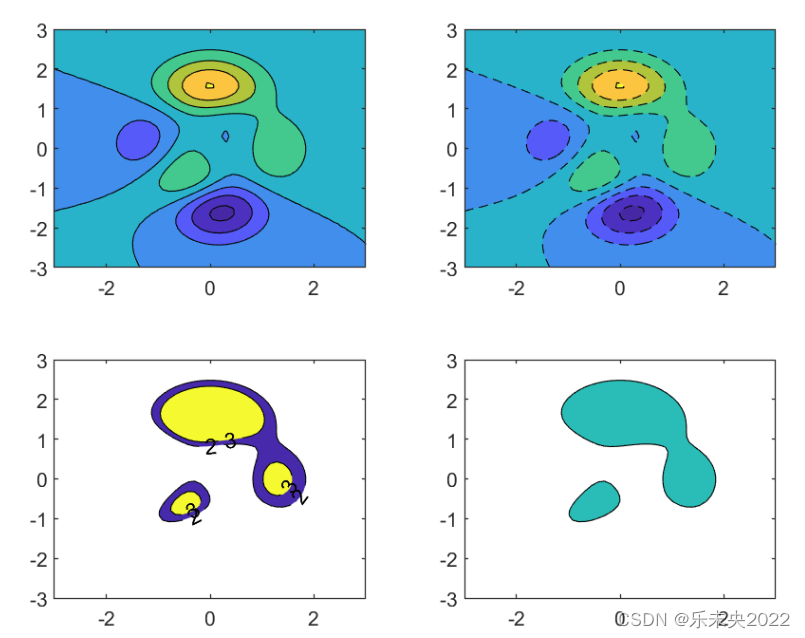
%等高线填充图
figure;
subplot(2,2,1);
[X,Y,Z] = peaks(50);
contourf(X,Y,Z);
subplot(2,2,2);
contourf(X,Y,Z,'--');
subplot(2,2,3);
contourf(X,Y,Z,[2 3],'ShowText','on');
subplot(2,2,4);
contourf(X,Y,Z,[2,2]); 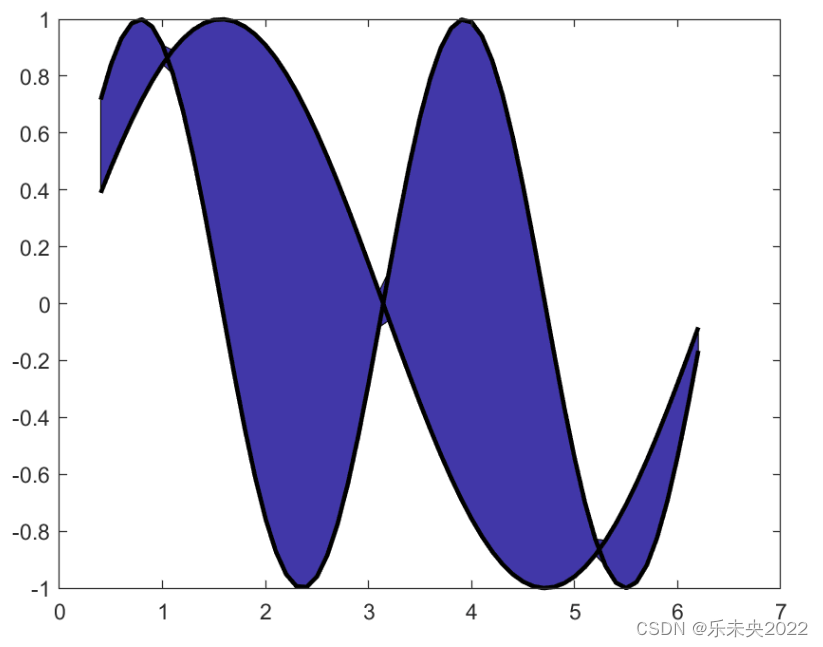
填充图有点类似于高数里面的求积分,需要找到填充区域的上下限,并按照从前往后、从后往前的顺序进行填充。
6.分子模型图&分形图
%分子模型图
[x,y,z]=sphere(100);
C = 10;
H = 5;
figure;
surf(C*x, C*y, C*z,'FaceColor','red','EdgeColor','none')
hold on
surf(H*x, H*y, H*z+10,'FaceColor','blue','EdgeColor','none');
surf(H*x+10, H*y, H*z-3,'FaceColor','blue','EdgeColor','none');
surf(H*x-4, H*y-10, H*z-3,'FaceColor','blue','EdgeColor','none');
surf(H*x-4, H*y+10, H*z-3,'FaceColor','blue','EdgeColor','none');
axis equal off
light
hold off
%分形图
a = 1.7;b = 1.7;c = 0.6; d = 1.2; %a = 1.5; b = -1.8;c = 1.6; d = 0.9;
x = 0;y = 0;
n = 100000;
kx = zeros(1,n);
ky = zeros(1,n);
for i = 1:n
    tempx = sin(a*y)+c*cos(a*x);
    tempy = sin(b*x)+d*cos(b*y);
    kx(i) = tempx;
    ky(i) = tempy;
    x = tempx;
        y = tempy;
end
scatter(kx,ky,0.1,'green');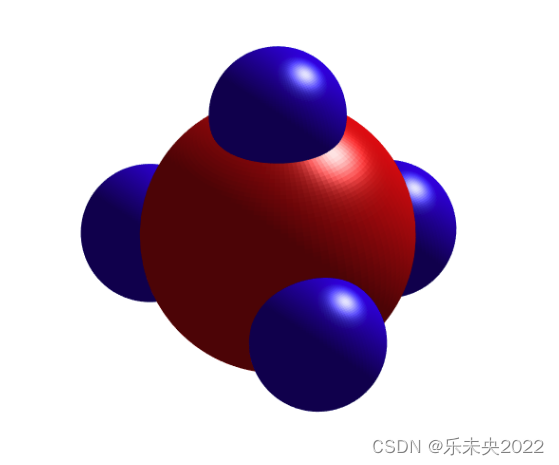
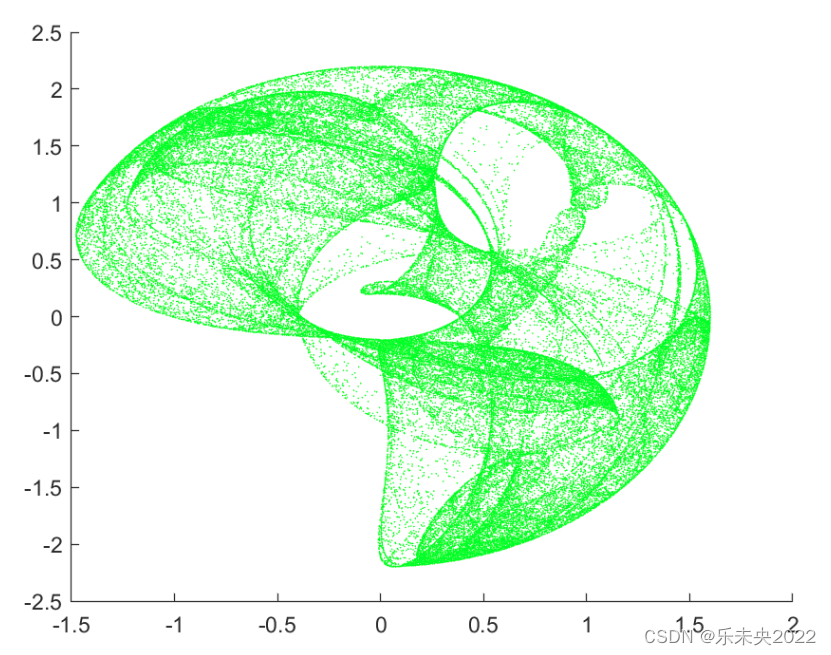
前者在涉及到化学分子的题目中用处较多,通过最后的打光步骤,使整个模型更立体和真实;后者属于累积的效果,有点类似于“线动成面”的思想。
今天的分享就到这儿啦,一起努力吧!


 1884
1884

 被折叠的 条评论
为什么被折叠?
被折叠的 条评论
为什么被折叠?
 到【灌水乐园】发言


