


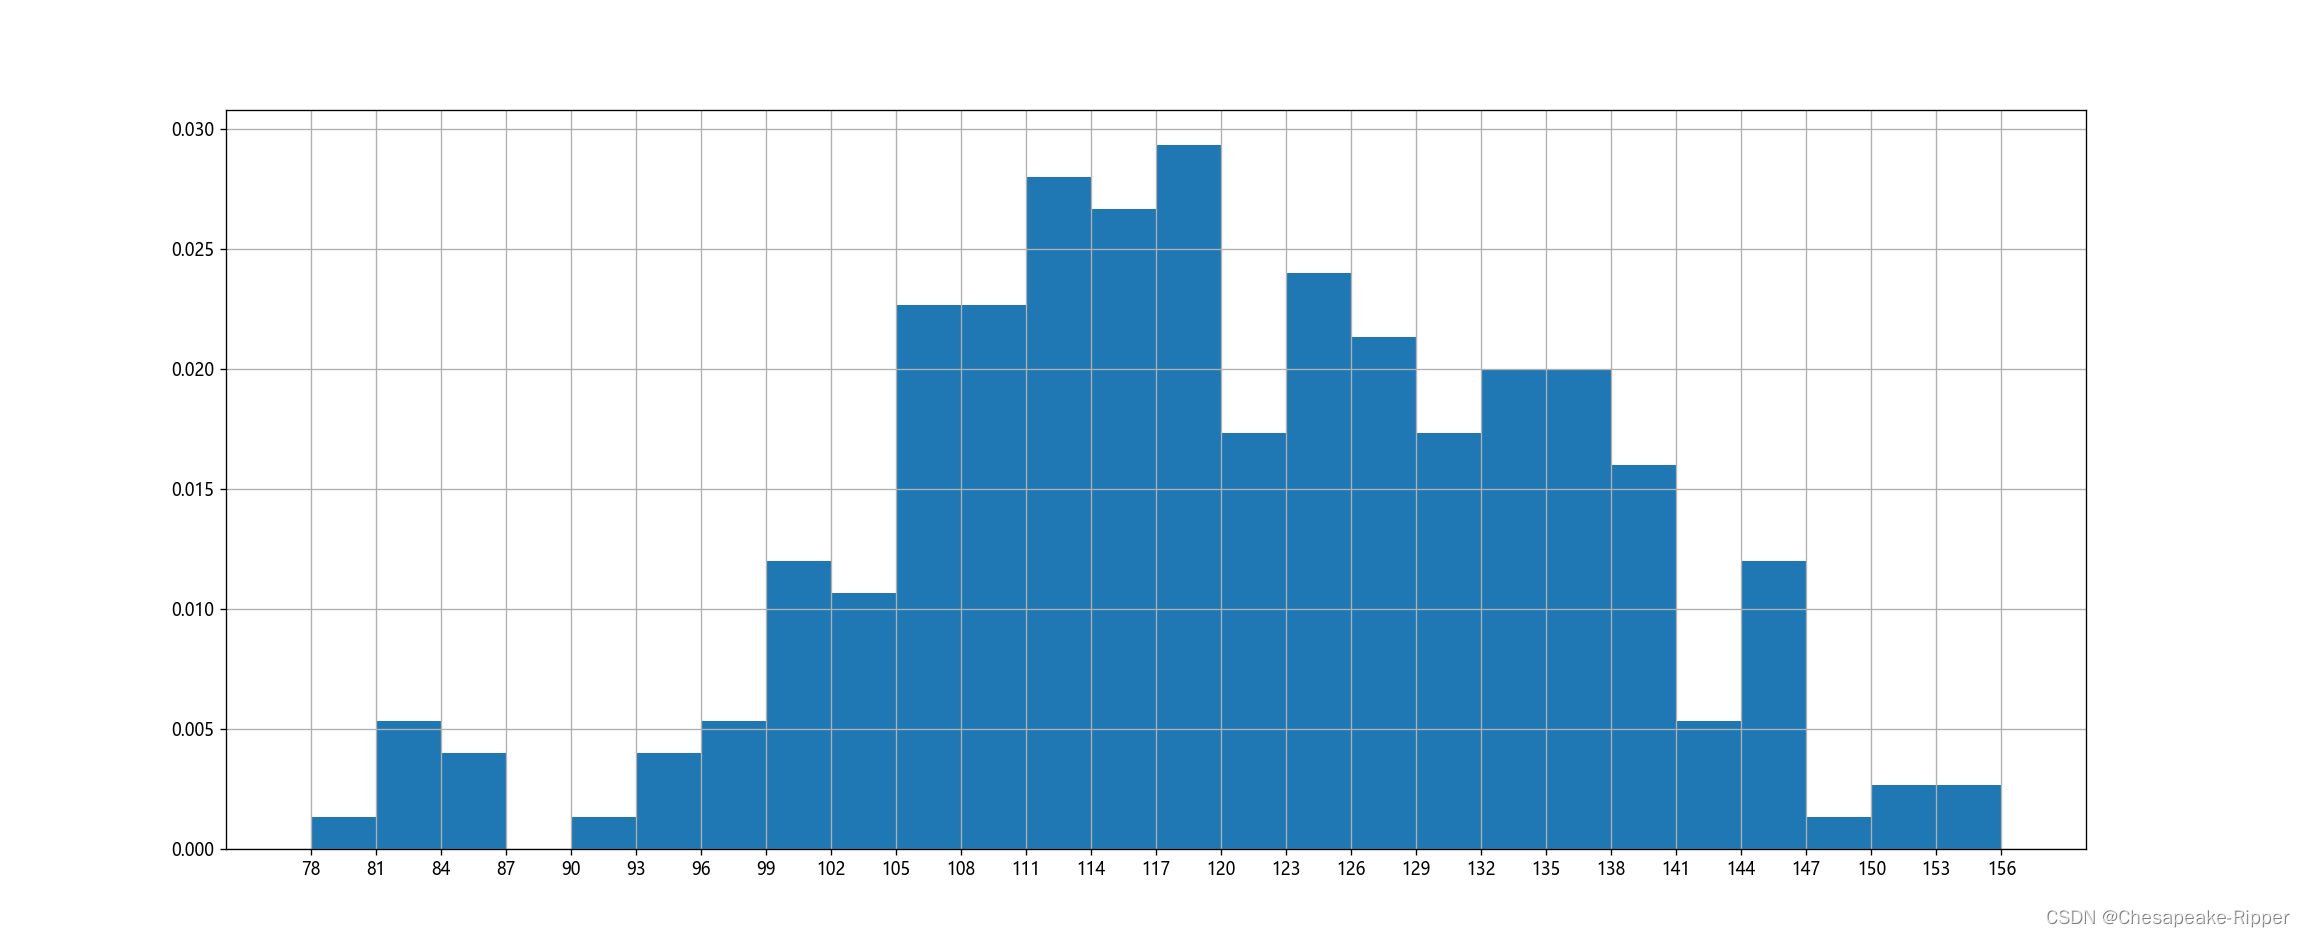
1:绘制直方图:
题目联系:假设你获取了250部电影的时长(列表a中),希望统计出这些电影时长的分布状态(比如时长为100分钟到120分钟电影的数量,出现的频率)等信息,你应该如何呈现这些数据?
a=[131, 98, 125, 131, 124, 139, 131, 117, 128, 108, 135, 138, 131, 102, 107, 114, 119, 128, 121, 142, 127, 130, 124, 101, 110, 116, 117, 110, 128, 128, 115, 99, 136, 126, 134, 95, 138, 117, 111,78, 132, 124, 113, 150, 110, 117, 86, 95, 144, 105, 126, 130,126, 130, 126, 116, 123, 106, 112, 138, 123, 86, 101, 99, 136,123, 117, 119, 105, 137, 123, 128, 125, 104, 109, 134, 125, 127,105, 120, 107, 129, 116, 108, 132, 103, 136, 118, 102, 120, 114,105, 115, 132, 145, 119, 121, 112, 139, 125, 138, 109, 132, 134,156, 106, 117, 127, 144, 139, 139, 119, 140, 83, 110, 102,123,107, 143, 115, 136, 118, 139, 123, 112, 118, 125, 109, 119, 133,112, 114, 122, 109, 106, 123, 116, 131, 127, 115, 118, 112, 135,115, 146, 137, 116, 103, 144, 83, 123, 111, 110, 111, 100, 154,136, 100, 118, 119, 133, 134, 106, 129, 126, 110, 111, 109, 141,120, 117, 106, 149, 122, 122, 110, 118, 127, 121, 114, 125, 126,114, 140, 103, 130, 141, 117, 106, 114, 121, 114, 133, 137, 92,121, 112, 146, 97, 137, 105, 98, 117, 112, 81, 97, 139, 113,134, 106, 144, 110, 137, 137, 111, 104, 117, 100, 111, 101, 110,105, 129, 137, 112, 120, 113, 133, 112, 83, 94, 146, 133, 101,131, 116, 111, 84, 137, 115, 122, 106, 144, 109, 123, 116, 111,111, 133, 150]
问题思考:
把数据分为多少组进行统计???
组数要适当,太少会有较大的统计误差,大多规律不明显


from matplotlib import pyplot as plt
import matplotlib

"""
只有没有统计过的数据才能绘制直方图,hits只能传入自然数据,然后hits自动分组

直方图绘制的原理 : 自动从最小值开始,从min到min+组距 在数据里面找符合这个大小的值
"""


matplotlib.rc("font", family='Microsoft YaHei')

a=[131,  98, 125, 131, 124, 139, 131, 117, 128, 108, 135, 138, 131, 102, 107, 114,
   119, 128, 121, 142, 127, 130, 124, 101, 110, 116, 117, 110, 128, 128, 115,  99, 136, 126,
   134,  95, 138, 117, 111,78, 132, 124, 113, 150, 110, 117,  86,  95, 144, 105, 126, 130,126,
   130, 126, 116, 123, 106, 112, 138, 123,  86, 101,  99, 136,123, 117, 119, 105, 137, 123, 128,
   125, 104, 109, 134, 125, 127,105, 120, 107, 129, 116, 108, 132, 103, 136, 118, 102, 120, 114,105,
   115, 132, 145, 119, 121, 112, 139, 125, 138, 109, 132, 134,156, 106, 117, 127, 144, 139, 139, 119,
   140,  83, 110, 102,123,107, 143, 115, 136, 118, 139, 123, 112, 118, 125, 109, 119, 133,112, 114, 122,
   109, 106, 123, 116, 131, 127, 115, 118, 112, 135,115, 146, 137, 116, 103, 144,  83, 123, 111, 110, 111,
   100, 154,136, 100, 118, 119, 133, 134, 106, 129, 126, 110, 111, 109, 141,120, 117, 106, 149, 122, 122, 110,
   118, 127, 121, 114, 125, 126,114, 140, 103, 130, 141, 117, 106, 114, 121, 114, 133, 137,  92,121, 112, 146,
   97, 137, 105,  98, 117, 112,  81,  97, 139, 113,134, 106, 144, 110, 137, 137, 111, 104, 117, 100, 111, 101, 110,105,
   129, 137, 112, 120, 113, 133, 112,  83,  94, 146, 133, 101,131, 116, 111,  84, 137, 115, 122, 106, 144, 109, 123, 116,
   111,111, 133, 150]

fig = plt.figure(figsize=(20,8),dpi=80)

d = 3  #  组距
num_bins =(max(a) - min(a))//d # num_bins是组数   ==   数据最大值减去最小值除以组距
print(num_bins)
print(max(a),min(a) , max(a) - min(a))

#!!!!当 max(a) - min(a) 可以整除 d组距的时候,不会偏离

plt.hist(a , num_bins , density = True)# num_bins是组数    density 代替 normed 表示是否把频数直方图转换为频率直方图

plt.xticks(range(min(a),max(a) +d ,d)) # +d  刻度可以取到最大值

plt.grid()
plt.show()
2:是否所有数据都能绘制成 直方图?
在美国2004年人口普查发现有124 million的人在离家相对较远的地方工作。根据他们从家到上班地点所需要的时间,通过抽样统计(最后一列)出了下表的数据,这些数据能够绘制成直方图么?

interval = [0,5,10,15,20,25,30,35,40,45,60,90]
width = [5,5,5,5,5,5,5,5,5,15,30,60]
quantity = [836,2737,3723,3926,3596,1438,3273,642,824,613,215,47]
数据来源:https://en.wikipedia.org/wiki/Histogram
普查报告地址:https://www.census.gov/prod/2004pubs/c2kbr-33.pdf
答案是否定的,因为这三组数据是统计好的,直方图要求数据只能是未处理的原数据!
只有没有统计过的数据才能绘制直方图,hits只能传入自然数据,然后hits自动分组 直方图绘制的原理 : 自动从最小值开始,从min到min+组距 在数据里面找符合这个大小的值
#!!!!当 max(a) - min(a) 可以整除 d组距的时候,不会偏离
# num_bins是组数 == 数据最大值减去最小值除以组距
# num_bins是组数 density 代替 normed 表示是否把频数直方图转换为频率直方图
# +d 刻度可以取到最大值
from matplotlib import pyplot as plt
import matplotlib
"""
只有没有统计过的数据才能绘制直方图,hits只能传入自然数据,然后hits自动分组
"""
matplotlib.rc("font", family='Microsoft YaHei')
fig = plt.figure(figsize=(20,8),dpi=80)

interval = [0,5,10,15,20,25,30,35,40,45,60,90]  # 时间段 , 组距, 每一组的人数
width = [5,5,5,5,5,5,5,5,5,15,30,60]
quantity = [836,2737,3723,3926,3596,1438,3273,642,824,613,215,47]


print(len(interval))
print(len(width))
print(len(quantity))


#plt.bar(range(len(a)) , b,width = 0.3)#width = 0.3柱形图宽度

plt.bar(range(12) , quantity , width = 1)#总共12个条形图

#设置x轴的刻度
_x = [ i-0.5  for i in range (13)]
_xtick_label = interval+[150]
plt.xticks(_x,_xtick_label)#人为规定调整刻度


plt.grid()
plt.show()
用条形图模拟直方图:
3:matplotlib常见问题总结
4:matplotlib使用的流程总结
5:matplotlib更多的图形样式
matplotlib支持的图形是非常多的,如果有其他的需求,我们
可以查看一下url地址:
http://matplotlib.org/gallery/index.html

5:更多的绘图工具:
plotly:可视化工具中的github,相比于matplotlib更加简单,图形更加漂亮,同时兼容matplotlib和pandas
使用用法:简单,照着文档写即可
文档地址: https://plot.ly/python/
6:numpy数组的基本原理:
1.什么是numpy
2:numpy创建数组(矩阵)

import numpy as np
from numpy import random

t1 = np.array([1,2,3])
print(t1)
#<class 'numpy.ndarray'>
print(type(t1))

#使用numpy生成数组 ,得到ndarray类型数据
t2 = np.array(range(10))
print(t2)
print(type(t2))

t3 = np.arange(10)
print(t3)
print(type(t3))
# dtype 指的是ndarray中所存放数据的类型
# int32 等于i4或者u4  , 4个字节 ,4*8=32
print(t3.dtype)

t4 = range(10)#:Python3 range() 返回的是一个可迭代对象(类型是对象),而不是列表类型
print(t4)
for i in range(len(t4)) :
    print(t4[i],end=' ')

print("")
print("-"*100)

#手动认为指定array数组的元素类型
t5 = np.array(range(1,4),dtype='i1')
print(t5)
print(t5.dtype)

t6 = np.array(range(1,4),dtype=bool)
print(t6)
print(t6.dtype)

#调整数据类型
t7 = t6.astype('int8')
print(t7)
print(t7.dtype)

#用random生成随机小数
t8=np.array([random.random() for i  in range(10)])
print(t8)
print(t8.dtype)

#numpy中的小数
t9 = np.round(t8,2)
#round(t8,2)  (数组,保留几位小数)
print(t9)
print(t9.dtype)numpy中常见的更多数据类型

数据类型的操作

#手动认为指定array数组的元素类型
t5 = np.array(range(1,4),dtype='i1')
print(t5)
print(t5.dtype)

t6 = np.array(range(1,4),dtype=bool)
print(t6)
print(t6.dtype)

#调整数据类型
t7 = t6.astype('int8')
print(t7)
print(t7.dtype)
数组的形状


import numpy as np

#总结 ps: (块 , 行  , 列)

t1 = np.arange(12)
print(t1)

print(t1.shape)

t2 = np.array([[1,2,3],[4,5,6]])
print(t2)
print(t2.shape)#(2, 3) shape中有几个值就是几维数组


# (2, 2, 3) 三维数组 个人理解 ,
# 第一一个数字表示, 最外围的数组有几个值,依次表示该维度有几个值
t3 = np.array([[[1,2,3,],
                [4,5,6]],

               [[7,8,9],
                [10,11,12]]])
print(t3)
print(t3.shape)

#修改数组的形状 reshape
t4= np.arange(24)
print(t4)

t5 =t4. reshape((3,8))
print(t5)

t5 =t4. reshape((2,3,4))
print(t5)
# ((2,3,4))
#2代表块数 , 3表示每一块有多少行 , 4表示有多少列
#reshape 不会改变本身

t6 = t4.reshape((4,6))
print(t6)

#原地操作
t6 = t6.reshape((4,6))
print(t6)

t6 = t6.reshape((24,))
print(t6)

t6 = t6.reshape((24,1))
print(t6)

t6 = t6.reshape((1,24,))
print(t6)


tt4  = t4.reshape((4,6))
print(tt4)

# tt4的行数 * tt4的列数
t6 = t6.reshape(   (tt4.shape[0]*tt4.shape[1],) )
print(t6)

#flatten 把二维数组展开一维数组
t6 = tt4.flatten()
print(t6)
数组和数的计算


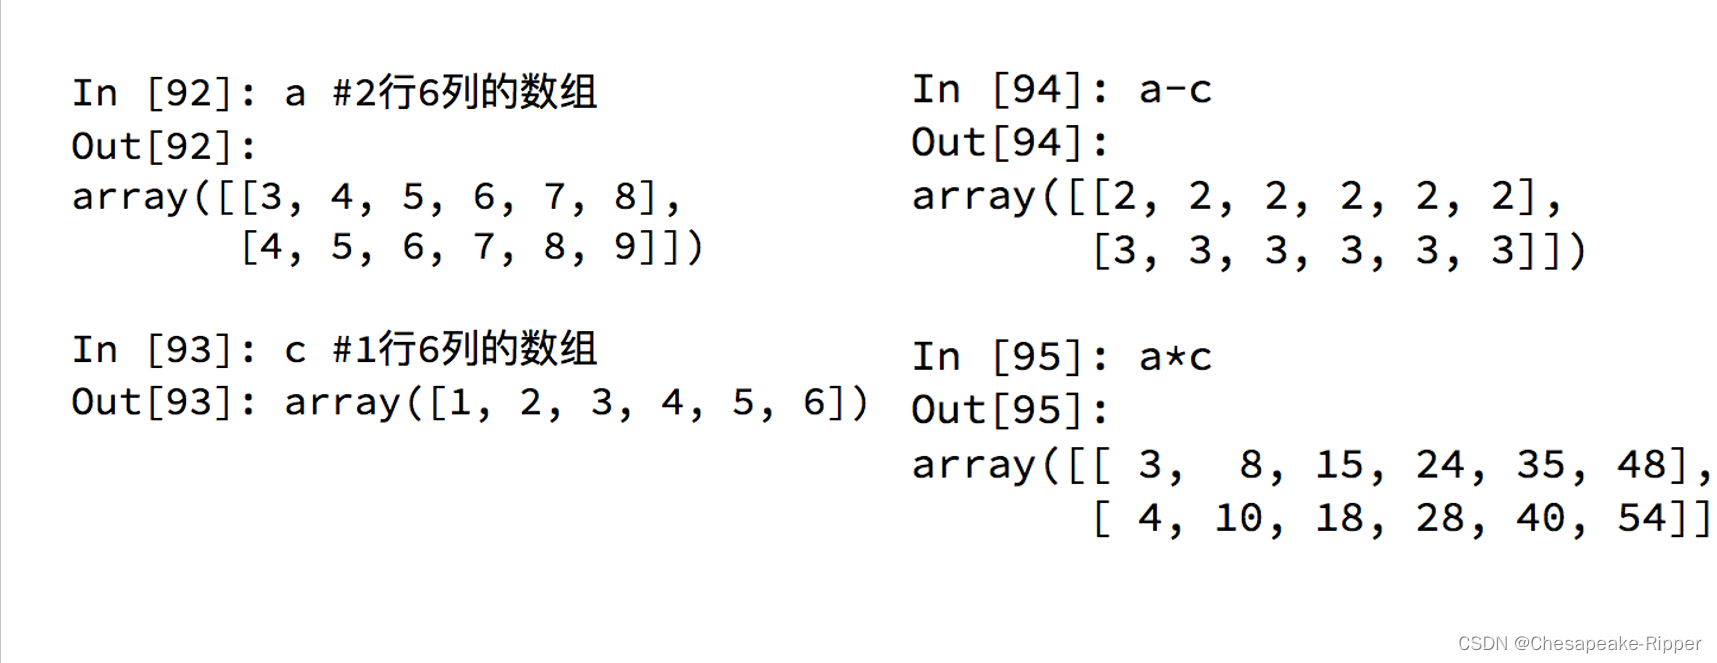
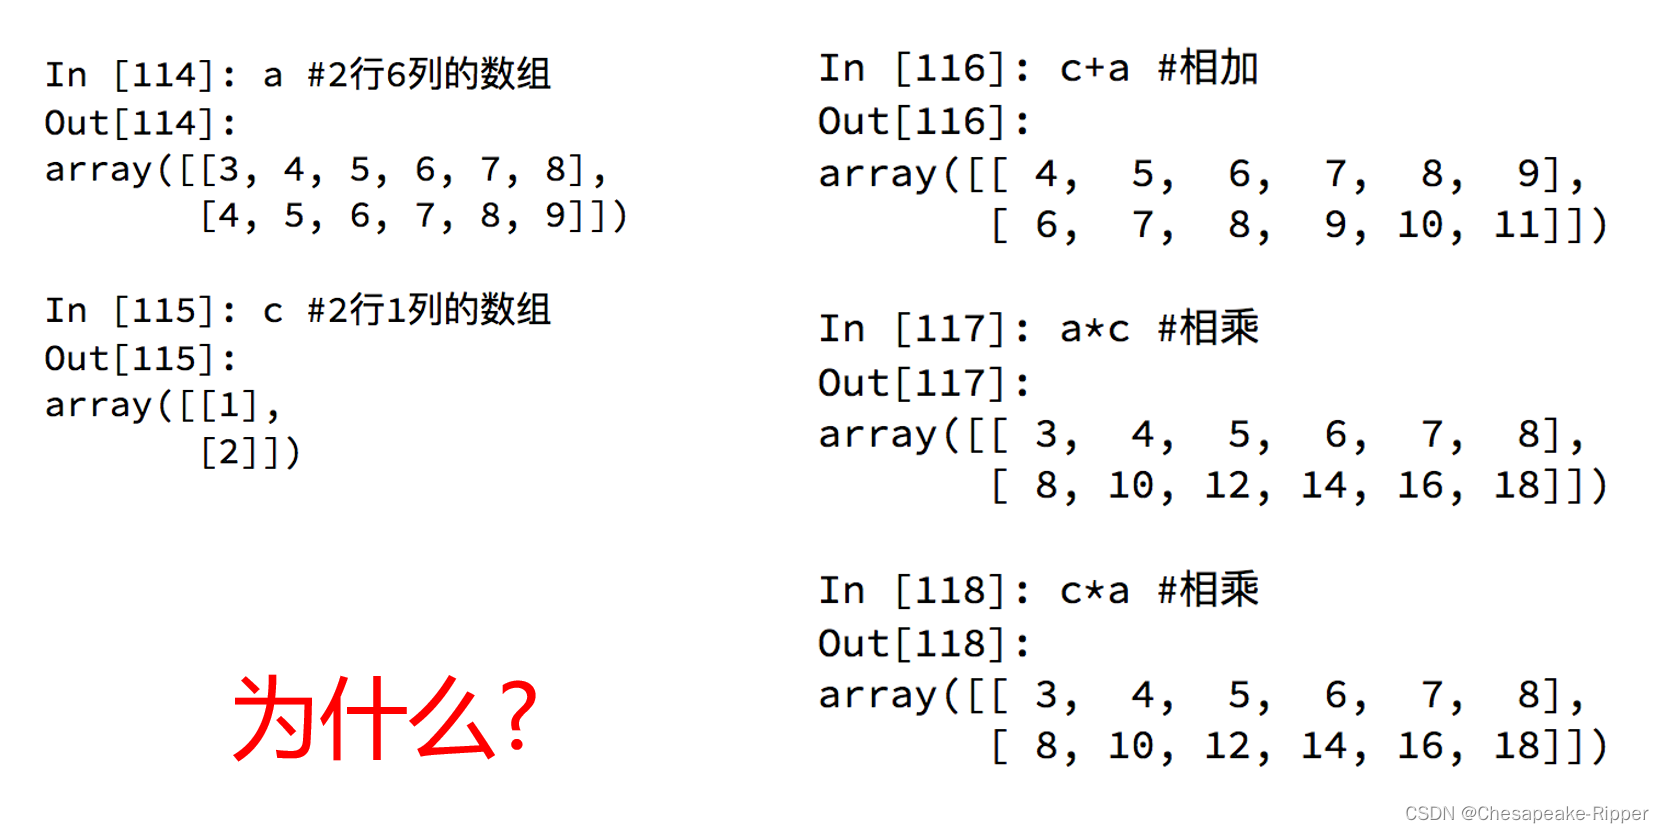
广播原则:

import numpy as np

#总结 ps: (块 , 行  , 列)

t1 = np.arange(12)
print(t1)

print(t1.shape)

t2 = np.array([[1,2,3],[4,5,6]])
print(t2)
print(t2.shape)#(2, 3) shape中有几个值就是几维数组


# (2, 2, 3) 三维数组 个人理解 ,
# 第一一个数字表示, 最外围的数组有几个值,依次表示该维度有几个值
t3 = np.array([[[1,2,3,],
                [4,5,6]],

               [[7,8,9],
                [10,11,12]]])
print(t3)
print(t3.shape)

#修改数组的形状 reshape
t4= np.arange(24)
print(t4)

t5 =t4. reshape((3,8))
print(t5)

t5 =t4. reshape((2,3,4))
print(t5)
# ((2,3,4))
#2代表块数 , 3表示每一块有多少行 , 4表示有多少列
#reshape 不会改变本身

t6 = t4.reshape((4,6))
print(t6)

#原地操作
t6 = t6.reshape((4,6))
print(t6)

t6 = t6.reshape((24,))
print(t6)

t6 = t6.reshape((24,1))
print(t6)

t6 = t6.reshape((1,24,))
print(t6)


tt4  = t4.reshape((4,6))
print(tt4)

# tt4的行数 * tt4的列数
t6 = t6.reshape(   (tt4.shape[0]*tt4.shape[1],) )
print(t6)

#flatten 把二维数组展开一维数组
t6 = tt4.flatten()
print(t6)


 2790
2790


 被折叠的 条评论
为什么被折叠?
被折叠的 条评论
为什么被折叠?
 到【灌水乐园】发言


