


✅作者简介:热爱科研的Matlab仿真开发者,修心和技术同步精进,matlab项目合作可私信。
🍎个人主页:Matlab科研工作室
🍊个人信条:格物致知。
⛄ 内容介绍
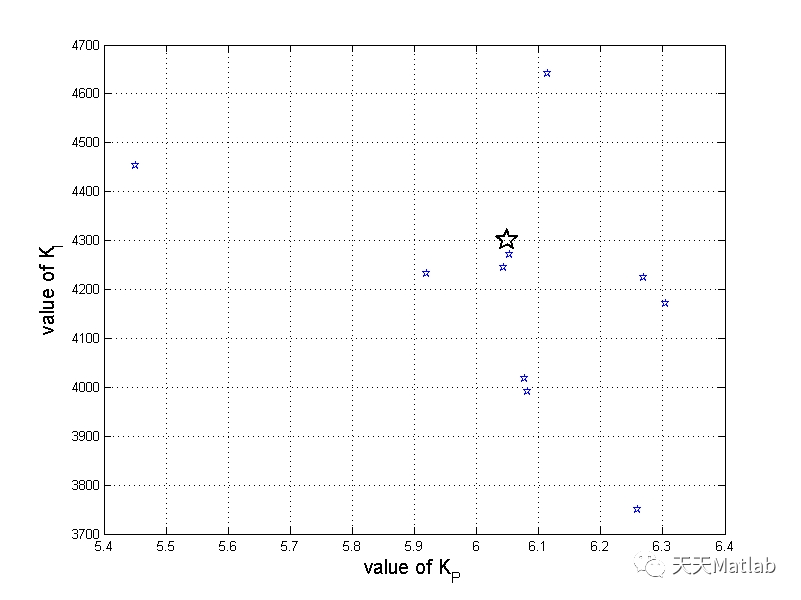
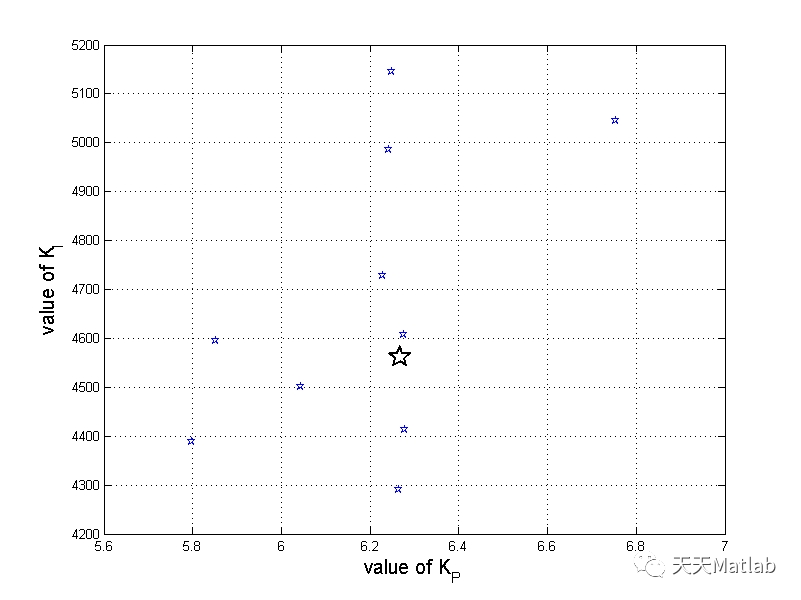
针对耦合和非线性的永磁同步电机(PMSM)控制器优化设计的难题,提出一种基于粒子群优化(PSO)算法的比例、积分和微分(PID)控制器的优化设计方法.综合考虑评价系统的各项性能指标,采用时域性能指标和绝对误差积分组成的适应度函数作为优化目标,给出了优化PID控制器的设计步骤.实验结果表明:优化得到的PID控制器速度响应快、超调量小,有效地提高了永磁同步电机控制系统的动态性能.
⛄ 部分代码
% Adaptive speed control in the PMSM drive for a non-stationary repetitive process using particle swarms
% Xiaoping WANG and Bartlomiej UFNALSKI 2016.04
% Institute of Control and Industrial Electronics, Warsaw University of Techonology
% Xiaoping WANG, xiaoping.wangx@xee.pw.edu.pl (you should
% remove both exes prior to sending me an email)
% Bartlomiej UFNALSKI, bartlomiej.ufnalskix@xee.pw.edu.pl (you should
% remove both exes prior to sending me an email)
% Keywords: repetitive control, dynamic optimization problem, PMSM control
% swarm(index, [location, velocity, best_position, best_value], [controller_gains])
%% Initialization
% parameters
clear mex
clear
clc
tic
evalfit = 1;
psovideo = VideoWriter('pso_pmsm.avi'); %%%%%%%%%%%%%%video record
open(psovideo); %%%%%%%%%%%%%%video record
% rng('shuffle');
simtime = 0.20; % simulation time
iter_max = 800; % maxium times of interations
nlocal = 1; %%%% calculate the repeatness of optimal value, to aviod local convergence, date 2013.04.10
localbest = 0; % local optimal value
br_index = 1; % index designed for break up if swarm tend to premature
% set initial constant
swarm_size = 10;
scale = 3; % scale of mean; for membership
no_vari = 2; % the number of variables, or the dimensions
evapor_cononline = 0.85; % when evapor_con0 = 1, the process is still
stilltolive = 1; % if stilltolive>iter, the process is still, otherwise it is live
change01 = 200; % when to change the interia J
change02 = 400;
change03 = 600;
multi01 = 3; % multiple of the change of J
multi02 = 5;
multi03 = 1;
history = zeros(iter_max,swarm_size,no_vari); %%%%%%%%%%%%%
quality = zeros(iter_max);
index = 1; % index of output data
scaleplot = 0.1;
plotcon = 10;
diversity_limit(1) = 0.1;
diversity_limit(2) = 50;
procent = 0.03;
for i = 1: no_vari
diversity_swarm(i) = 0;
dirv_swarm(i) = 0;
end
Ts = 1e-4;
J0 = 0.005066;
J = J0;
% set pass
pass = 0;
passa = pass;
for i = 1 : (simtime / Ts + 1)
pass(i) = passa;
pass = pass';
end
nnnout = 0;
% velocity clamping
scalev1 = 2;
scalev2 = 2000;
scalevlive1 = 2;
scalevlive2 = 2000;
v_clamp = [2 * scalev1 2 * scalev2];
% initial gbest
for i = 1 : no_vari
std_mean_best(i) = 1000000;
std_mean_worst(i) = 1000000;
end
for i = 1:swarm_size
for tt = 1 : (simtime / Ts + 1)
plotnnout(i,tt) = 0;
plotbest(i,tt) = 0;
plotworst(i,tt) = 0;
end
passn(i) = 0;
end
%% initialization
std_mean(1) = 5;
std_mean(2) = 2500;
KP = std_mean(1);
KI = std_mean(2);
KP0 = KP;
KI0 = KI;
tk = 1;
mk= 1;
arraykp = 0;
arrayki = 0;
arraytk = 0;
arrayJ = 0;
%%%
c_f = 2.05; % correction factor
K=2/abs(2-2*c_f-sqrt((2*c_f)^2-8*c_f));
%%%
%%%initialization 'save-state'
pidelay0_1 = 0; pidelay0_2 = 0; pidelay0_3 = 0; pidelay0_4 = 0;
minter0_1 = 0; minter0_2 = 0; minter0_3 = 0; minter0_4 = 0;
fdelay0_1 = 0;
pidelay_1 = 0; pidelay_2 = 0; pidelay_3 = 0; pidelay_4 = 0;
minter_1 = 0; minter_2 = 0; minter_3 = 0; minter_4 = 0;
fdelay_1 = 0;
% Noise
noise_level = 0.02;
Imax = 30; % to determine noise signal
erf_inverse = 2.3263;
noise_psd_I = (Imax*noise_level/erf_inverse)^2*Ts;
scale01 = std_mean(1);
scale02 = std_mean(2);%%%%%%%%%%%%%%%%%%%%%%
% initial swarm position
for id = 1:swarm_size
swarm(id, 1, 1) = scale01 * (1+ 2 * procent * (rand()-0.5));
swarm(id, 1, 2) = scale02 * (1+ 2 * procent * (rand()-0.5));
end
swarm(:, 4, 1) = 1000000; % best value so far for the swarm
swarm(:, 5, 1) = 0; % worst value so far for the swarm
val = 0;
val0 = 1000000;
swarm(:, 2, 1) = 2 * scalevlive1 * (rand(swarm_size,1)-0.5); % initial velocity
swarm(:, 2, 2) = 2 * scalevlive2 * (rand(swarm_size,1)-0.5);
figure(1)
plot3(zeros(1,swarm_size),swarm(:, 1, 1),swarm(:, 1, 2),'bo');hold on;
grid; hold on;
grid; hold on;
set(gca,'xdir', 'reverse');
xlabel('swarm iteration','fontsize',14);
ylabel('particles position y-axis','fontsize',14);
zlabel('particles position z-axis','fontsize',14);
set(gca,'FontSize',14);
grid on;
%% Iterations
for iter = 1 : iter_max
valpassb = 1000000; % reinitialization the best value for every iteration
valpassw = 0; % reinitialization the worst value for every iteration
disp(['Iterations: ' num2str(iter) ' from ' num2str(iter_max)]);
localbest = min(swarm(:, 4, 1));
if iter == change01
J = J0 * multi01;
end
if iter == change02
J = J0 * multi02;
end
if iter == change03
J = J0 * multi03;
end
%-- evaluating position & quality ---
for n = 1 : swarm_size
% seed
rand_seed_1 = round(rand*4294967295);
rand_seed_2 = round(rand*4294967295);
for m = 1 : no_vari
swarm(n, 2, m)= min(max(-v_clamp(m), swarm(n, 2, m)), v_clamp(m)); % velocity clamping
swarm(n, 1, m) = swarm(n, 1, m) + swarm(n, 2, m);
std_mean(m) = swarm(n, 1, m);
end
KP = std_mean(1);
KI = std_mean(2);
if evalfit==1
simout=sim('DPSOPMSM.slx', 'SaveOutput','on');
else
load kbest_fuzzypsopmsm
open DPSOPMSM.slx
sim('DPSOPMSM');
end
if iter >= stilltolive % make on-line mode
pidelay0_1 = pidelay_1;
pidelay0_2 = pidelay_2;
pidelay0_3 = pidelay_3;
pidelay0_4 = pidelay_4;
minter0_1 = minter_1;
minter0_2 = minter_2;
minter0_3 = minter_3;
minter0_4 = minter_4;
fdelay0_1 = fdelay_1;
evapor_con = evapor_cononline;
scalev1 = scalevlive1;
scalev2 = scalevlive2;
v_clamp = [2 * scalev1 2 * scalev2];
else % still mode
pidelay0_1 = 0;
pidelay0_2 = 0;
pidelay0_3 = 0;
pidelay0_4 = 0;
minter0_1 = 0;
minter0_2 = 0;
minter0_3 = 0;
minter0_4 = 0;
fdelay0_1 = 0;
evapor_con = 1;
end
if max(simout.get('tout')) >= simtime
Yout=simout.get('yout');
val = Yout(numel(Yout));
else
val = 1000000-max(simout.get('tout'));
end
disp(['Particle: ' num2str(n) '/' num2str(swarm_size) ' with fitness ' num2str(val) ' , position ( ' num2str(swarm(n, 1, :)) ' ) ' ' , (KP, KI) ( ' num2str(KP) ', ' num2str(KI) ' ) ' ]);
% detect the change of evironment. when there is no big change keep
% small evaporation constant, and if the evironment has been
% changed, use bigger constant
if val > swarm(n, 4, 1)*(1 + 0.05)
evapor_con = 0.85;
scalevlive1 = 2;
scalevlive2 = 2000;
elseif val < swarm(n, 4, 1)*(1 - 0.05)
evapor_con = 0.85;
scalevlive1 = 2;
scalevlive2 = 2000;
else
evapor_con = 0.999;
end
for i = 1 : no_vari
history(iter,n,i) = std_mean(i);
end
nout = simout.get('vout');
tnout = nout.get('Time');
tnout = tnout';
nnout = nout.get('Data');
nnout = nnout';
plotnnout(n,:) = nnout;
%val0 = val;
if val < swarm(n, 4, 1) / evapor_con % if new position is better
www=1;
for i = 1 : no_vari
swarm(n, 3, i) = swarm(n, 1, i); % update best position
end
swarm(n, 4, 1) = val; % best value
else
www=2;
swarm(n, 4, 1) = swarm(n, 4, 1) / evapor_con;
end
if val > swarm(n, 5, 1) * evapor_con % if new position is worse
ttt=1;
for i = 1 : no_vari
swarm(n, 6, i) = swarm(n, 1, i); % update worst position
end
swarm(n, 5, 1) = val; % best value
else
ttt=2;
swarm(n, 5, 1) = swarm(n, 5, 1) * evapor_con;
end
% find the best and worst particle in every iteration
if val < valpassb
nbest = n;
plotbest(n,:) = nnout;
valpassb = val;
end
if val > valpassw
nworst = n;
plotworst(n,:) = nnout;
valpassw = val;
end
arraykp(mk) = KP;
arrayki(mk) = KI;
arraytk(mk) = tk;
arrayJ(mk) = J;
tk = tk +1;
mk = mk+1;
[temp, gbest] = min(swarm(:, 4, 1)); % value of global best position
[temp1, gworst] = max(swarm(:, 5, 1)); % value of global best position
for i = 1 : no_vari
std_mean_best(i) = swarm(gbest, 3, i);
std_mean_worst(i) = swarm(gworst, 6, i);
end
std_mean_best;
std_mean_worst;
quality(iter) = temp;
end
pass = pass+swarm_size;
% polt KP, KI along the pass
figure(15)
[ax1, h1, h2 ] = plotyy(arraytk/swarm_size, arraykp, arraytk/swarm_size, arrayJ);
set(h1,'linestyle','.','marker','.','color','b');
set(h2,'linestyle','.','marker','.','color','r');
set(ax1(2),'yLim',[0 0.1]);
set(ax1(2),'yTick',[0:0.05:0.1]);
grid on;
figure(16)
[ax2, h3, h4 ] = plotyy(arraytk/swarm_size,arrayki, arraytk/swarm_size, arrayJ);
set(h3,'linestyle','.','marker','.','color','b');
set(h4,'linestyle','.','marker','.','color','r');
set(ax2(2),'yLim',[0 0.1]);
set(ax2(2),'yTick',[0:0.05:0.1]);
grid on;
if iter==1 || mod(iter,2*plotcon)==0
figure(5)
plot3((pass+1)/swarm_size, tnout, plotnnout(5,:), 'b' , 'LineWidth', 2 );
set(gca,'xdir', 'reverse', 'ydir', 'reverse');
axis([0 iter_max 0 simtime 0 50]);
grid on
hold on
end
% draw best every iteration
if iter < change01
if iter==1 || mod(iter,plotcon)==0
figure(7)
plot3((pass+1)/swarm_size, tnout, plotbest(nbest,:), 'm' , 'LineWidth', 2 );
set(gca,'xdir', 'reverse', 'ydir', 'reverse');
axis([0 change01 0 simtime 0 50]);
grid on
hold on
end
elseif iter < change02
if iter==1 || mod(iter,plotcon)==0
figure(8)
plot3((pass+1)/swarm_size, tnout, plotbest(nbest,:), 'm' , 'LineWidth', 2 );
set(gca,'xdir', 'reverse', 'ydir', 'reverse');
axis([change01 change02 0 simtime 0 50]);
grid on
hold on
end
elseif iter < change03
if iter==1 || mod(iter,plotcon)==0
figure(9)
plot3((pass+1)/swarm_size, tnout, plotbest(nbest,:), 'm' , 'LineWidth', 2 );
set(gca,'xdir', 'reverse', 'ydir', 'reverse');
axis([change02 change03 0 simtime 0 50]);
grid on
hold on
end
else
if iter==1 || mod(iter,plotcon)==0
figure(10)
plot3((pass+1)/swarm_size, tnout, plotbest(nbest,:), 'm' , 'LineWidth', 2 );
set(gca,'xdir', 'reverse', 'ydir', 'reverse');
axis([change03 iter_max 0 simtime 0 50]);
grid on
hold on
end
end
%draw worst every iteration
if iter < change01
if iter==1 || mod(iter,plotcon)==0
figure(11)
plot3((pass+1)/swarm_size, tnout, plotworst(nworst,:), 'b' , 'LineWidth', 2 );
set(gca,'xdir', 'reverse', 'ydir', 'reverse');
axis([0 change01 0 simtime 0 50]);
grid on
hold on
end
elseif iter < change02
if iter==1 || mod(iter,plotcon)==0
figure(12)
plot3((pass+1)/swarm_size, tnout, plotworst(nworst,:), 'b' , 'LineWidth', 2 );
set(gca,'xdir', 'reverse', 'ydir', 'reverse');
axis([change01 change02 0 simtime 0 50]);
grid on
hold on
end
elseif iter < change03
if iter==1 || mod(iter,plotcon)==0
figure(13)
hold on;
figure(25)
xlabel('time [s]','FontSize',14);
ylabel('speed response of the worst particle [rad/s]','FontSize',14);
h = legend('\omega_{m}','\omega_{m}^{ref}');
set(h,'FontSize',14);
delete(get(gca,'title'));
set(gca,'FontSize',14);
hold on;
figure(26)
xlabel('time [s]','FontSize',14);
ylabel('speed response of the worst particle [rad/s]','FontSize',14);
h = legend('\omega_{m}','\omega_{m}^{ref}');
set(h,'FontSize',14);
delete(get(gca,'title'));
set(gca,'FontSize',14);
hold on;
figure(27)
xlabel('time [s]','FontSize',14);
ylabel('speed response of the worst particle [rad/s]','FontSize',14);
h = legend('\omega_{m}','\omega_{m}^{ref}');
set(h,'FontSize',14);
delete(get(gca,'title'));
set(gca,'FontSize',14);
hold on;
figure(15)
xlabel('swarm iteration','FontSize',14);
h = legend('K_p','J');
hh1=get(ax1(1),'Ylabel');
set(hh1,'String','value of K_p','FontSize',14);
set(hh1,'color','b');
hh2=get(ax1(2),'Ylabel');
set(hh2,'String','moment of inertia','FontSize',14);
set(hh2,'color','r');
set(ax1(1),'XColor','k','YColor','b','FontSize',14);
set(ax1(2),'XColor','k','YColor','r','FontSize',14);
set(h,'FontSize',14);
set(gca,'FontSize',14);
hold on;
figure(16)
xlabel('swarm iteration','FontSize',14);
h = legend('K_i','J');
hh3=get(ax2(1),'Ylabel');
set(hh3,'String','value of K_i','FontSize',14);
set(hh3,'color','b');
hh4=get(ax2(2),'Ylabel');
set(hh4,'String','moment of inertia','FontSize',14);
set(hh4,'color','r');
set(ax2(1),'XColor','k','YColor','b','FontSize',14);
set(ax2(2),'XColor','k','YColor','r','FontSize',14);
set(h,'FontSize',14);
set(gca,'FontSize',14);
hold on;
figure(28)
xlabel('time [s]','FontSize',14);
ylabel('speed response of the worst particle [rad/s]','FontSize',14);
h = legend('\omega_{m}','\omega_{m}^{ref}');
set(h,'FontSize',14);
delete(get(gca,'title'));
set(gca,'FontSize',14);
hold on;
figure(29)
xlabel('time [s]','FontSize',14);
ylabel('speed response of the worst particle [rad/s]','FontSize',14);
h = legend('\omega_{m}','\omega_{m}^{ref}');
set(h,'FontSize',14);
delete(get(gca,'title'));
set(gca,'FontSize',14);
hold on;
figure(30)
xlabel('time [s]','FontSize',14);
ylabel('speed response of the worst particle [rad/s]','FontSize',14);
h = legend('\omega_{m}','\omega_{m}^{ref}');
set(h,'FontSize',14);
delete(get(gca,'title'));
set(gca,'FontSize',14);
hold on;
%% 'Value lg(KPq)' 'Value lg(KIq)' 'Best Value'};
% save the best values of every interation to excel
title = {'Iteration' 'Best position KP' 'Best position KI' 'Best Value' 'Worst position KP' 'Worst position KI' 'Worst Value'};
xlswrite('Bestworstposition', title, 'sheet1');
xlswrite('Bestworstposition', bestworstposition,'sheet1','A2');
evalfit=0;
if evalfit==1
simout = sim('DPSOPMSM.slx', ...
'SaveTime','on','TimeSaveName','tout', ...
'SaveOutput','on','OutputSaveName','yout');
else
load kbest_fuzzypsopmsm
open DPSOPMSM.slx
sim('DPSOPMSM');
end
disp('-------------------END-------------------');
toc
⛄ 运行结果

⛄ 参考文献
[1]任志斌, 谢阳萍, 肖宇连. 基于粒子群算法的永磁同步电机控制系统研制[J]. 微电机, 2013, 46(12):4.
⛄ 完整代码
❤️部分理论引用网络文献,若有侵权联系博主删除
❤️ 关注我领取海量matlab电子书和数学建模资料


 214
214


 被折叠的 条评论
为什么被折叠?
被折叠的 条评论
为什么被折叠?
 到【灌水乐园】发言


