


一、简介
基于matlab病虫害识别系统,你需要收集具有不同虫害程度的叶片图像作为训练样本。这些样本应该包括正常叶片和不同虫害程度的叶片,如轻度虫害、中度虫害和严重虫害。你可以通过在农田中采集受虫害影响的叶片样本,并使用数码相机或智能手机进行拍摄来获取这些图像。
二、部分源码
clear all
clc
A=imread('E:\病虫害识别\图像检索\18.jpg');
[M,N,O] = size(A);
[h,s,v] = rgb2hsv(A);
H = h; S = s; V = v;
h = h*360;
%将hsv空间非等间隔量化:
% h量化成16级;
% s量化成4级;
% v量化成4级;
for i = 1:M
for j = 1:N
if h(i,j)<=15||h(i,j)>345
H(i,j) = 0;
end
if h(i,j)<=25&&h(i,j)>15
H(i,j) = 1;
end
if h(i,j)<=45&&h(i,j)>25
H(i,j) = 2;
end
if h(i,j)<=55&&h(i,j)>45
H(i,j) = 3;
end
if h(i,j)<=80&&h(i,j)>55
H(i,j) = 4;
end
if h(i,j)<=108&&h(i,j)>80
H(i,j) = 5;
end
if h(i,j)<=140&&h(i,j)>108
H(i,j) = 6;
end
if h(i,j)<=165&&h(i,j)>140
H(i,j) = 7;
end
if h(i,j)<=190&&h(i,j)>165
H(i,j) = 8;
end
if h(i,j)<=220&&h(i,j)>190
H(i,j) = 9;
end
if h(i,j)<=255&&h(i,j)>220
H(i,j) = 10;
end
if h(i,j)<=275&&h(i,j)>255
H(i,j) = 11;
end
if h(i,j)<=290&&h(i,j)>275
H(i,j) = 12;
end
if h(i,j)<=316&&h(i,j)>290
H(i,j) = 13;
end
if h(i,j)<=330&&h(i,j)>316
H(i,j) = 14;
end
if h(i,j)<=345&&h(i,j)>330
H(i,j) = 15;
end
end
end
for i = 1:M
for j = 1:N
if s(i,j)<=0.15&&s(i,j)>0
S(i,j) = 1;
end
if s(i,j)<=0.4&&s(i,j)>0.15
S(i,j) = 2;
end
if s(i,j)<=0.75&&s(i,j)>0.4
S(i,j) = 3;
end
if s(i,j)<=1&&s(i,j)>0.75
S(i,j) = 4;
end
end
end
for i = 1:M
for j = 1:N
if v(i,j)<=0.15&&v(i,j)>0
V(i,j) = 1;
end
if v(i,j)<=0.4&&v(i,j)>0.15
V(i,j) = 2;
end
if v(i,j)<=0.75&&v(i,j)>0.4
V(i,j) = 3;
end
if v(i,j)<=1&&v(i,j)>0.75
V(i,j) = 4;
end
end
end
% 构建4*16二维数组存放H-S数据
Hist = zeros(16,4);
for i = 1:M
for j = 1:N
for k = 1:16
for l = 1:4
if l==S(i,j)&& k==H(i,j)+1
Hist(k,l) = Hist(k,l)+1;
end
end
end
end
end
for k = 1:16
for l =1:4
His((k-1)*4+l) = Hist(k,l);%转化为一维数组
end
end
His = His/sum(His)*1000;
% 手工绘制彩色图像直方图
% hist_h
m=0;
for j = 1:300
if rem(j,16)==1 && m<16
for k = 0:15
for i = 1:200
hist_h(i,j+k) = m;
end
end
m = m+1;
end
end
% hist_s
m=0;
for j = 1:300
if rem(j,4) == 1 && m<64
n = rem(m,4);
for k = 0:3
for i =1:200
hist_s(i,j+k) = n+1;
end
end
m = m+1;
end
end
% hist_v
for j = 1:256
for i = 1:200
hist_v(i,j) = 0.98;
end
end
% 把His赋值给hist_v
for k = 1:64
for j = 1:256
if floor((j-1)/4) == k
for i = 1:200
if i<200-His(k+1)%i>His(k+1)%
hist_v(i,j) = 0;
end
end
end
end
end
% 将h、s、v分量图合并转化为RGB模式
I_rgb = hsv2rgb(H/16,S/4,V/4);
I_H = hsv2rgb(hist_h/16,hist_s/4,hist_v);
% 画图显示
figure;
subplot(3,2,1),imshow(A),title('原图');
subplot(3,2,2),imshow(H,[]),title('H分量图');
subplot(3,2,3),imshow(S,[]),title('S分量图');
subplot(3,2,4),imshow(V,[]),title('V分量图');
subplot(3,2,5),imshow(I_rgb,[]),title('色彩量化后的RGB图像');
subplot(3,2,6),imshow(I_H,[]),title('H-S直方图');
figure,imshow(I_H);
%%=======================================
GG = lianghua_hsv(A);
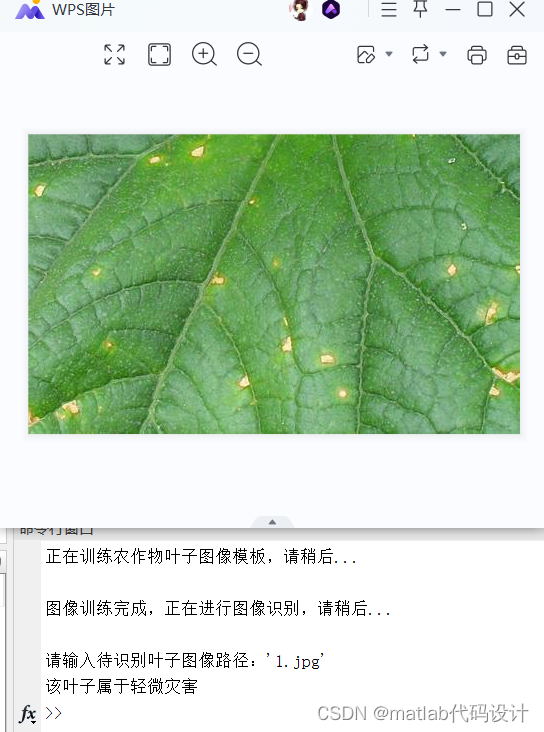
三、运行结果
四、matlab版本
MATLAB R2019a
五、学习与交流
文中不足之处请大家多多指教,学习与交流可以联系企鹅:3752243968
文中部分源码仅供参考,若需要全部代码可以私信


 958
958

 被折叠的 条评论
为什么被折叠?
被折叠的 条评论
为什么被折叠?
 到【灌水乐园】发言


