


概述
xscale和yscale函数的作用都是设置坐标轴的缩放类型。其中
xscale函数作用是设置x轴的缩放类型。yscale函数作用是设置y轴的缩放类型。
两者参数相同,仅功能稍有不同。
xscale函数的签名为:matplotlib.pyplot.xscale(value, **kwargs)
yscale函数的签名为:matplotlib.pyplot.yscale(value, **kwargs)
xscale函数
xscale函数的签名为:matplotlib.pyplot.xscale(value, **kwargs)
默认的坐标轴缩放类型为:"linear"
参数说明如下:
value:X轴的缩放类型。字符串,取值范围为{"linear", "log", "symlog", "logit", ...}或ScaleBase对象,自定义的缩放类型需要使用matplotlib.scale.register_scale注册。必备参数。**kwargs:不同缩放类型接受的关键字参数不同。具体查看相关类:matplotlib.scale.LinearScalematplotlib.scale.LogScalematplotlib.scale.SymmetricalLogScalematplotlib.scale.LogitScalematplotlib.scale.FuncScale
xscale函数的返回值为(locs, labels)元组。其中locs为X轴刻度位置列表,labels为X轴刻度标签列表
案例
import matplotlib.pyplot as plt
import numpy as np
np.random.seed(19880801)
# 构造数据,要求数据都在0-1之间,否则不能设置logit缩放类型
y = np.random.normal(loc=0.5, scale=0.4, size=1000)
y = y[(y > 0) & (y < 1)]
y.sort()
x = np.arange(len(y))
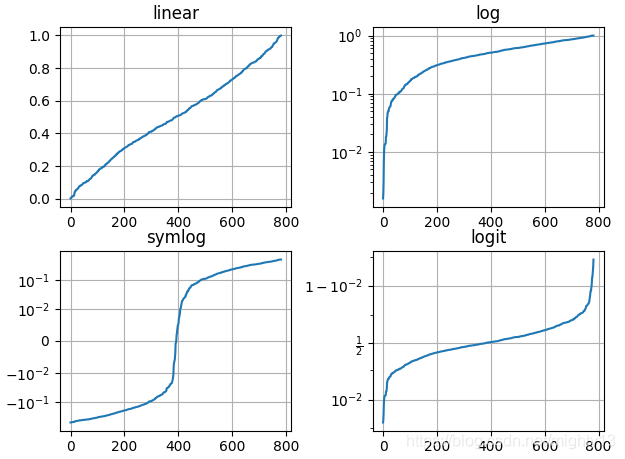
# linear,默认缩放类型
plt.subplot(221)
plt.plot(x, y)
plt.yscale('linear')
plt.title('linear')
plt.grid(True)
# log
plt.subplot(222)
plt.plot(x, y)
plt.yscale('log')
plt.title('log')
plt.grid(True)
# symmetric log
plt.subplot(223)
plt.plot(x, y - y.mean())
plt.yscale('symlog', linthresh=0.01)
plt.title('symlog')
plt.grid(True)
# logit
plt.subplot(224)
plt.plot(x, y)
plt.yscale('logit')
plt.title('logit')
plt.grid(True)
plt.subplots_adjust(top=0.92, bottom=0.08, left=0.10, right=0.95, hspace=0.25,
wspace=0.35)
plt.show()


 3286
3286

 被折叠的 条评论
为什么被折叠?
被折叠的 条评论
为什么被折叠?
 到【灌水乐园】发言


