第七章 缺失数据
缺失值的统计和删除
缺失信息的统计
df = pd.read_csv('data/learn_pandas.csv',usecols=['Grade', 'Name', 'Gender', 'Height','Weight', 'Transfer'])
df.isna().head()
| Grade | Name | Gender | Height | Weight | Transfer |
|---|
| 0 | False | False | False | False | False | False |
|---|
| 1 | False | False | False | False | False | False |
|---|
| 2 | False | False | False | False | False | False |
|---|
| 3 | False | False | False | True | False | False |
|---|
| 4 | False | False | False | False | False | False |
|---|
df.isna().mean()
Grade       0.000
Name        0.000
Gender      0.000
Height      0.085
Weight      0.055
Transfer    0.060
dtype: float64
df[df.Height.isna()].head()
| Grade | Name | Gender | Height | Weight | Transfer |
|---|
| 3 | Sophomore | Xiaojuan Sun | Female | NaN | 41.0 | N |
|---|
| 12 | Senior | Peng You | Female | NaN | 48.0 | NaN |
|---|
| 26 | Junior | Yanli You | Female | NaN | 48.0 | N |
|---|
| 36 | Freshman | Xiaojuan Qin | Male | NaN | 79.0 | Y |
|---|
| 60 | Freshman | Yanpeng Lv | Male | NaN | 65.0 | N |
|---|
sub_set = df[['Height', 'Weight', 'Transfer']]
df[sub_set.isna().all(1)]
| Grade | Name | Gender | Height | Weight | Transfer |
|---|
| 102 | Junior | Chengli Zhao | Male | NaN | NaN | NaN |
|---|
df[sub_set.isna().any(1)].head()
| Grade | Name | Gender | Height | Weight | Transfer |
|---|
| 3 | Sophomore | Xiaojuan Sun | Female | NaN | 41.0 | N |
|---|
| 9 | Junior | Juan Xu | Female | 164.8 | NaN | N |
|---|
| 12 | Senior | Peng You | Female | NaN | 48.0 | NaN |
|---|
| 21 | Senior | Xiaopeng Shen | Male | 166.0 | 62.0 | NaN |
|---|
| 26 | Junior | Yanli You | Female | NaN | 48.0 | N |
|---|
df[sub_set.notna().all(1)].head()
| Grade | Name | Gender | Height | Weight | Transfer |
|---|
| 0 | Freshman | Gaopeng Yang | Female | 158.9 | 46.0 | N |
|---|
| 1 | Freshman | Changqiang You | Male | 166.5 | 70.0 | N |
|---|
| 2 | Senior | Mei Sun | Male | 188.9 | 89.0 | N |
|---|
| 4 | Sophomore | Gaojuan You | Male | 174.0 | 74.0 | N |
|---|
| 5 | Freshman | Xiaoli Qian | Female | 158.0 | 51.0 | N |
|---|
缺失信息的删除
dropna()
axis 轴方向,默认0,即删除行how 删除方式,有any/all两种选择thresh 删除的非缺失值个数阈值,非缺失值没有达到这个数量的相应维度会被删除subset 备选的删除子集
res = df.dropna(how='any', subset=['Height','Weight'])
res.shape
res = df.loc[df[['Height', 'Weight']].notna().all(1)]
res.head()
| Grade | Name | Gender | Height | Weight | Transfer |
|---|
| 0 | Freshman | Gaopeng Yang | Female | 158.9 | 46.0 | N |
|---|
| 1 | Freshman | Changqiang You | Male | 166.5 | 70.0 | N |
|---|
| 2 | Senior | Mei Sun | Male | 188.9 | 89.0 | N |
|---|
| 4 | Sophomore | Gaojuan You | Male | 174.0 | 74.0 | N |
|---|
| 5 | Freshman | Xiaoli Qian | Female | 158.0 | 51.0 | N |
|---|
res = df.dropna(1, thresh=df.shape[0]-15)
res.head()
res = df.loc[:, ~(df.isna().sum()>15)]
| Grade | Name | Gender | Weight | Transfer |
|---|
| 0 | Freshman | Gaopeng Yang | Female | 46.0 | N |
|---|
| 1 | Freshman | Changqiang You | Male | 70.0 | N |
|---|
| 2 | Senior | Mei Sun | Male | 89.0 | N |
|---|
| 3 | Sophomore | Xiaojuan Sun | Female | 41.0 | N |
|---|
| 4 | Sophomore | Gaojuan You | Male | 74.0 | N |
|---|
缺失值的填充和插值
利用fillna填充
fillna()
value 填充值,可以是标量,也可以是索引到元素的字典映射method 填充方法,ffill 用前面的元素填充,bfill 用后面的元素填充limit 连续缺失值的最大填充次数
s = pd.Series([np.nan, 1, np.nan, np.nan, 2, np.nan], list('aaabcd'))
s
a    NaN
a    1.0
a    NaN
b    NaN
c    2.0
d    NaN
dtype: float64
s.fillna(method='ffill')
a    NaN
a    1.0
a    1.0
b    1.0
c    2.0
d    2.0
dtype: float64
s.fillna(method='ffill', limit=1)
a    NaN
a    1.0
a    1.0
b    NaN
c    2.0
d    2.0
dtype: float64
s.fillna(s.mean())
a    1.5
a    1.0
a    1.5
b    1.5
c    2.0
d    1.5
dtype: float64
s.fillna({'a':100, 'd':200, 'c':100})
a    100.0
a      1.0
a    100.0
b      NaN
c      2.0
d    200.0
dtype: float64
df.groupby('Grade')['Height'].transform(lambda x:x.fillna(x.mean())).head()
0    158.900000
1    166.500000
2    188.900000
3    163.075862
4    174.000000
Name: Height, dtype: float64
练一练
s.fillna(method='ffill', limit=1)
0    1.0
1    1.0
2    3.0
3    3.0
4    NaN
dtype: float64
s.fillna(method='bfill', limit=1)
0    1.0
1    3.0
2    3.0
3    NaN
4    NaN
dtype: float64
res = pd.DataFrame({'ffill':s.fillna(method='ffill', limit=1),'bfill':s.fillna(method='bfill', limit=1)})
res.mean(1, False)
0    1.0
1    2.0
2    3.0
3    NaN
4    NaN
dtype: float64
插值函数
s = pd.Series([np.nan, np.nan, 1, np.nan, np.nan, np.nan, 2, np.nan, np.nan])
s.values
res = s.interpolate(limit_direction='backward', limit=1)
res.values
res = s.interpolate(limit_direction='both', limit=1)
array([ nan, 1. , 1. , nan, nan, 1.75, 2. , nan, nan])
s.interpolate('nearest')
s = pd.Series([0,np.nan,10],index=[0,1,10])
s.interpolate(method='index')
0      0.0
1      1.0
10    10.0
dtype: float64
Nullable类型
缺失记号及其缺陷
Nullable类型的性质
pd.Series([np.nan, 1], dtype='Int64')
0    <NA>
1       1
dtype: Int64
pd.Series([np.nan, True], dtype='boolean')
0    <NA>
1    True
dtype: boolean
pd.Series([np.nan, 'abcd'], dtype='string')
0    <NA>
1    abcd
dtype: string
df_nan = pd.DataFrame({'category':['a','a','b',np.nan,np.nan],
   ....:                        'value':[1,3,5,7,9]})
df_nan
| category | value |
|---|
| 0 | a | 1 |
|---|
| 1 | a | 3 |
|---|
| 2 | b | 5 |
|---|
| 3 | NaN | 7 |
|---|
| 4 | NaN | 9 |
|---|
pd.get_dummies(df_nan.category, dummy_na=True)
| a | b | NaN |
|---|
| 0 | 1 | 0 | 0 |
|---|
| 1 | 1 | 0 | 0 |
|---|
| 2 | 0 | 1 | 0 |
|---|
| 3 | 0 | 0 | 1 |
|---|
| 4 | 0 | 0 | 1 |
|---|
pd.get_dummies(df_nan.category)
练习
缺失值与类别的相关性检验
df = pd.read_csv('data/missing_chi.csv')
df.head()
| X_1 | X_2 | y |
|---|
| 0 | NaN | NaN | 0 |
|---|
| 1 | NaN | NaN | 0 |
|---|
| 2 | NaN | NaN | 0 |
|---|
| 3 | 43.0 | NaN | 0 |
|---|
| 4 | NaN | NaN | 0 |
|---|
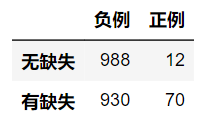
n11 = df[df['X_1'].isna() & df['y']==1].shape[0]
n10 = df[df['X_1'].isna() & df['y']==0].shape[0]
n01 = df[df['X_1'].notna() & df['y']==1].shape[0]
n00 = df[df['X_1'].notna() & df['y']==0].shape[0]
n11 = df[(df['X_1'].isna()) & (df['y']==1)].shape[0]
n10 = df[(df['X_1'].isna()) & (df['y']==0)].shape[0]
n01 = df[(df['X_1'].notna()) & (df['y']==1)].shape[0]
n00 = df[(df['X_1'].notna()) & (df['y']==0)].shape[0]
cat_1 = df.X_1.fillna('NaN').mask(df.X_1.notna()).fillna('NotNaN')
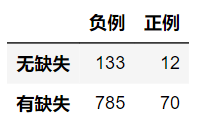
df_1 = pd.crosstab(cat_1, df.y, margins=True)
def compute_S(my_df):
S = []
for i in range(2):
for j in range(2):
E = my_df.iat[i, j]
F = my_df.iat[i, 2]*my_df.iat[2, j]/my_df.iat[2,2]
S.append((E-F)**2/F)
return sum(S)
res1 = compute_S(df_1)
from scipy.stats import chi2
chi2.sf(res1, 1)
用回归模型解决分类问题
这道题参考了答案
第一问
df = pd.read_excel('data/color.xlsx')
df.head(3)
>>>
X1 X2 Color
0 -2.5 2.8 Blue
1 -1.5 1.8 Blue
2 -0.8 2.8 Blue
from sklearn.neighbors import KNeighborsClassifier
clf = KNeighborsClassifier(n_neighbors=6)
clf.fit(df.iloc[:,:2], df.Color)
clf.predict([[0.8, -0.2]])
>>> array(['Yellow'], dtype=object)
from sklearn.neighbors import KNeighborsRegressor
df_dummies = pd.get_dummies(df.Color)
stack_list = []
for col in df_dummies.columns:
clf = KNeighborsRegressor(n_neighbors=6)
clf.fit(df.iloc[:,:2], df_dummies[col])
res = clf.predict([[0.8, -0.2]]).reshape(-1,1)
stack_list.append(res)
stack_list >>> [array([[0.16666667]]), array([[0.33333333]]), array([[0.5]])]
np.hstack(stack_list)
code_res = pd.Series(np.hstack(stack_list).argmax(1))
df_dummies.columns[code_res[0]]
>>> 'Yellow'
第二问
from sklearn.neighbors import KNeighborsRegressor
df = pd.read_csv('data/audit.csv')
res_df = df.copy()
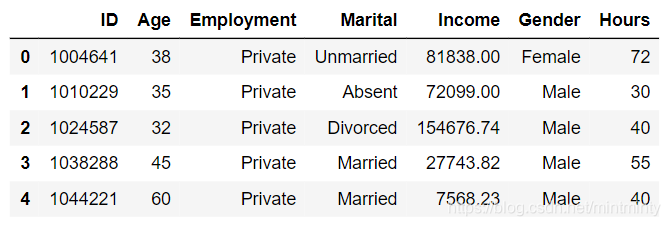
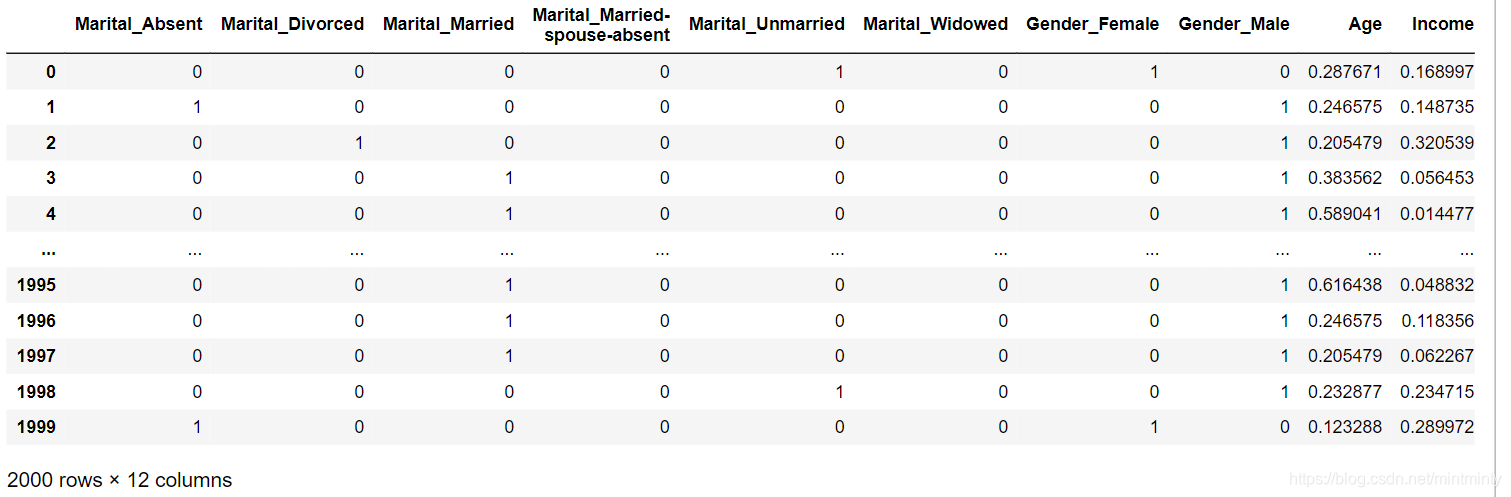
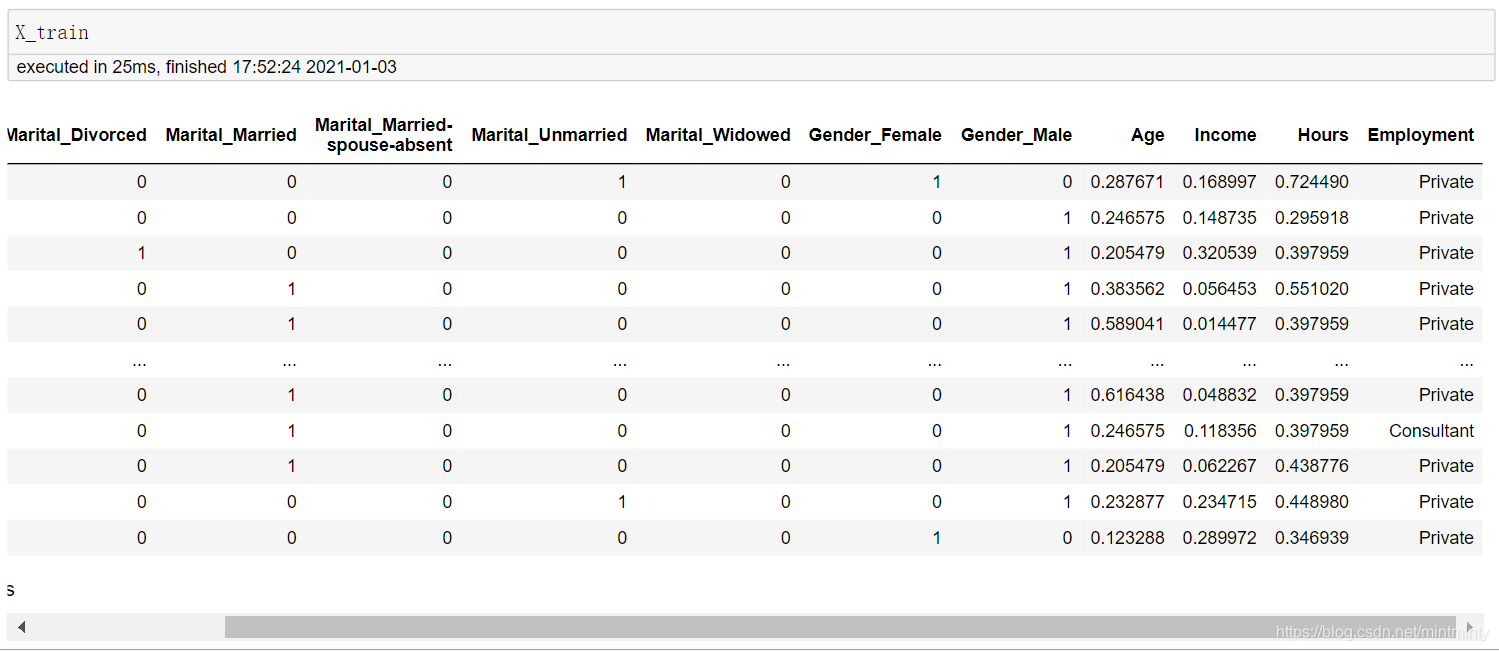
df = pd.concat([pd.get_dummies(df[['Marital', 'Gender']]), df[['Age','Income','Hours']].apply(lambda x:(x-x.min())/(x.max()-x.min())), df.Employment],1)
X_train = df[df.Employment.notna()]
X_test = df[df.Employment.isna()]
df_dummies = pd.get_dummies(X_train.Employment)
stack_list = []
for col in df_dummies.columns:
clf = KNeighborsRegressor(n_neighbors=6)
clf.fit(X_train.iloc[:,:-1], df_dummies[col])
res = clf.predict(X_test.iloc[:,:-1]).reshape(-1,1)
stack_list.append(res)
code_res = pd.Series(np.hstack(stack_list).argmax(1))
cat_res = code_res.replace(dict(zip(list(range(df_dummies.shape[0])),df_dummies.columns)))
res_df.loc[res_df.Employment.isna(), 'Employment'] = cat_res.values
res_df.isna().sum()


 3000
3000

 被折叠的 条评论
为什么被折叠?
被折叠的 条评论
为什么被折叠?
 到【灌水乐园】发言


