


Profiling
Intro To Profiling
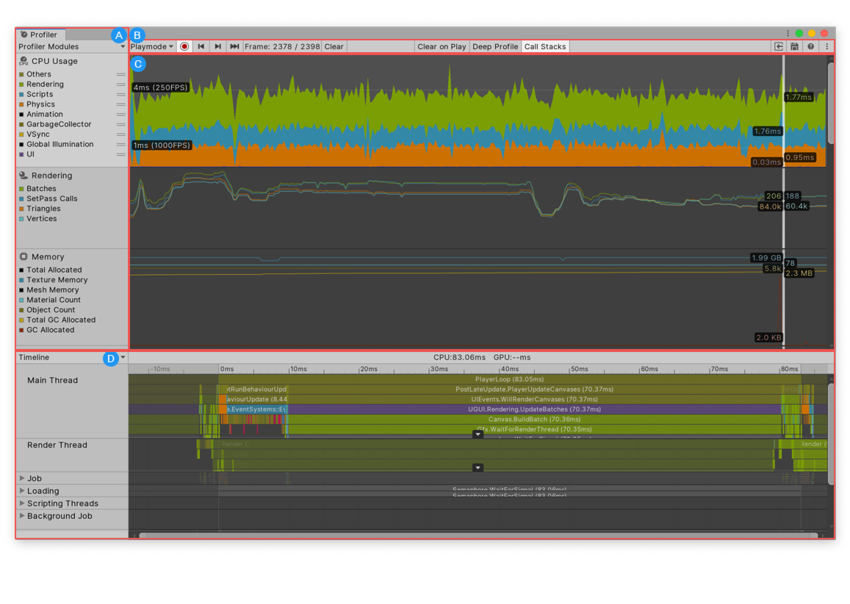
为了能够清晰的观察整个引擎的性能消耗情况,我们需要一个可视化的工具来进行性能分析,例如 Unity 的内置 Profiler:
其实本质就是将每个函数运行的时间进行可视化,这里我们借用标准库 chrono 来进行时间的计算
#include <chrono>

template<typename Fn>
class Timer
{
public:
	Timer(const char* name, Fn&& func)
		: m_Name(name), m_Func(func), m_Stopped(false)
	{
		m_StartTimepoint = std::chrono::high_resolution_clock::now();
	}

	~Timer()
	{
		if (!m_Stopped)
			Stop();
	}

	void Stop()
	{
		auto endTimepoint = std::chrono::high_resolution_clock::now();

		long long start = std::chrono::time_point_cast<std::chrono::microseconds>(m_StartTimepoint).time_since_epoch().count();
		long long end = std::chrono::time_point_cast<std::chrono::microseconds>(endTimepoint).time_since_epoch().count();

		m_Stopped = true;

		float duration = (end - start) * 0.001f;
		m_Func({ m_Name, duration });
	}
private:
	const char* m_Name;
	Fn m_Func;
	std::chrono::time_point<std::chrono::steady_clock> m_StartTimepoint;
	bool m_Stopped;
};
创建了一个用于计算时间间隔的类:Timer,在 Timer 的构造函数中首先记录了当前的时刻 std::chrono::high_resolution_clock::now() 其中当前时刻的获取是采用了 chrono 提供给我们的高精度失时钟:high_resolution_clock,然后在析构函数中调用了函数 Stop() 获取到析构时候的当前时间,然后计算时间间隔并进行返回。
之后在函数作用域内创建实例来进行分析:
#define PROFILE_SCOPE(name) Timer timer##__LINE__(name, [&](ProfileResult profileResult) { m_ProfileResults.push_back(profileResult); })
void Sandbox2D::OnUpdate(Hazel::Timestep ts)
{
	PROFILE_SCOPE("Sandbox2D::OnUpdate");

	// Update
	{
		PROFILE_SCOPE("CameraController::OnUpdate");
		m_CameraController.OnUpdate(ts);
	}

	// Render
	{
		PROFILE_SCOPE("Renderer Prep");
		Hazel::RenderCommand::SetClearColor({ 0.1f, 0.1f, 0.1f, 1 });
		Hazel::RenderCommand::Clear();
	}

	{
		PROFILE_SCOPE("Renderer Draw");
		Hazel::Renderer2D::BeginScene(m_CameraController.GetCamera());
		Hazel::Renderer2D::DrawQuad({ -1.0f, 0.0f }, { 0.8f, 0.8f }, { 0.8f, 0.2f, 0.3f, 1.0f });
		Hazel::Renderer2D::DrawQuad({ 0.5f, -0.5f }, { 0.5f, 0.75f }, { 0.2f, 0.3f, 0.8f, 1.0f });
		Hazel::Renderer2D::DrawQuad({ 0.0f, 0.0f, -0.1f }, { 10.0f, 10.0f }, m_CheckerboardTexture);
		Hazel::Renderer2D::EndScene();
	}
}
//SandBox2D.h
	struct ProfileResult
	{
		const char* Name;
		float Time;
	};

	std::vector<ProfileResult> m_ProfileResults;
这里创建了一个结构体 ProfileResult 用于保存每条记录的时间和名字,定义了一个宏 PROFILE_SCOPE,传入了一个 lamda 表达式用于将返回的名字和时间间隔以 ProfileResult 的形式存储到 vector 容器当中,便于我们后续进行访问。
利用 ImGui 进行显示:
void Sandbox2D::OnImGuiRender()
{
	ImGui::Begin("Settings");
	ImGui::ColorEdit4("Square Color", glm::value_ptr(m_SquareColor));

	for (auto& result : m_ProfileResults)
	{
		char label[50];
		strcpy(label, "%.3fms ");
		strcat(label, result.Name);
		ImGui::Text(label, result.Time);
	}
	m_ProfileResults.clear();

	ImGui::End();
}
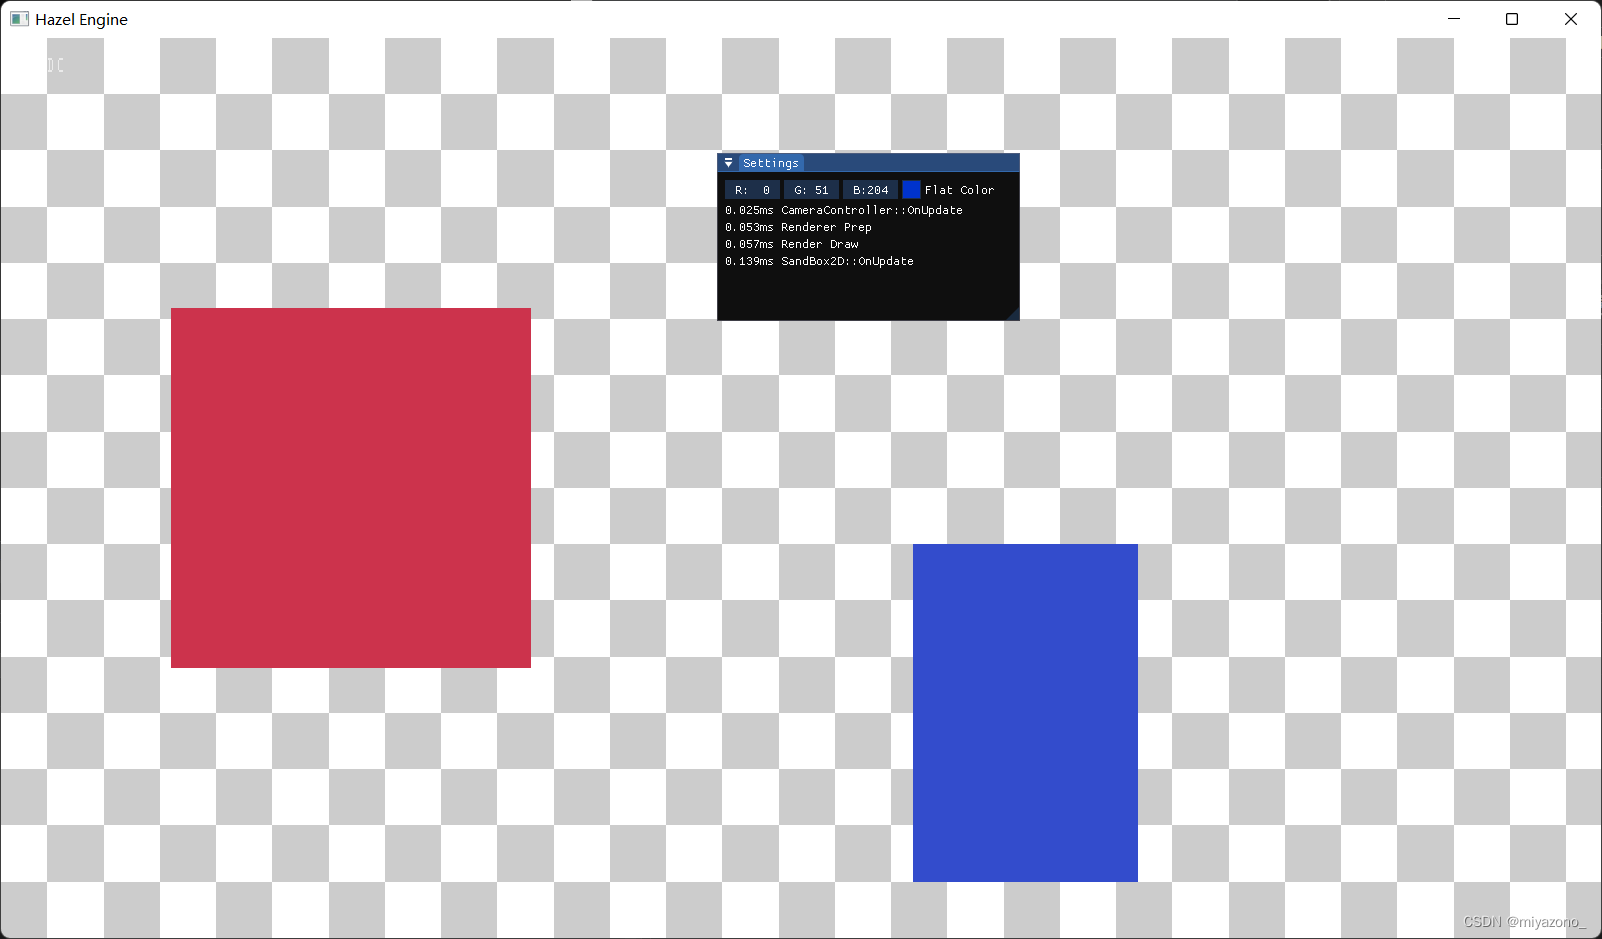
显示结果:
Visual Profiling
之前已经可以显示某个函数运行时间情况了,但是这样的显示结果并不够直观,只是单纯的能够看到某个函数的运行时间,我们需要的是像 Unity 那样的可视化 Profiler,如何做呢?
这里添加了一个专门用于将 Profiling 的结果导出到 json 文件的操作,在原有的 Timer 基础上,新增了部分内容:
#pragma once

#include <string>
#include <chrono>
#include <algorithm>
#include <fstream>

#include <thread>

namespace Hazel {
	struct ProfileResult
	{
		std::string Name;
		long long Start, End;
		uint32_t ThreadID;
	};

	struct InstrumentationSession
	{
		std::string Name;
	};

	class Instrumentor
	{
	private:
		InstrumentationSession* m_CurrentSession;
		std::ofstream m_OutputStream;
		int m_ProfileCount;
	public:
		Instrumentor()
			: m_CurrentSession(nullptr), m_ProfileCount(0)
		{
		}

		void BeginSession(const std::string& name, const std::string& filepath = "results.json")
		{
			m_OutputStream.open(filepath);
			WriteHeader();
			m_CurrentSession = new InstrumentationSession{ name };
		}

		void EndSession()
		{
			WriteFooter();
			m_OutputStream.close();
			delete m_CurrentSession;
			m_CurrentSession = nullptr;
			m_ProfileCount = 0;
		}

		void WriteProfile(const ProfileResult& result)
		{
			if (m_ProfileCount++ > 0)
				m_OutputStream << ",";

			std::string name = result.Name;
			std::replace(name.begin(), name.end(), '"', '\'');

			m_OutputStream << "{";
			m_OutputStream << "\"cat\":\"function\",";
			m_OutputStream << "\"dur\":" << (result.End - result.Start) << ',';
			m_OutputStream << "\"name\":\"" << name << "\",";
			m_OutputStream << "\"ph\":\"X\",";
			m_OutputStream << "\"pid\":0,";
			m_OutputStream << "\"tid\":" << result.ThreadID << ",";
			m_OutputStream << "\"ts\":" << result.Start;
			m_OutputStream << "}";

			m_OutputStream.flush();
		}

		void WriteHeader()
		{
			m_OutputStream << "{\"otherData\": {},\"traceEvents\":[";
			m_OutputStream.flush();
		}

		void WriteFooter()
		{
			m_OutputStream << "]}";
			m_OutputStream.flush();
		}

		static Instrumentor& Get()
		{
			static Instrumentor instance;
			return instance;
		}
	};

	class InstrumentationTimer
	{
	public:
		InstrumentationTimer(const char* name)
			: m_Name(name), m_Stopped(false)
		{
			m_StartTimepoint = std::chrono::high_resolution_clock::now();
		}

		~InstrumentationTimer()
		{
			if (!m_Stopped)
				Stop();
		}

		void Stop()
		{
			auto endTimepoint = std::chrono::high_resolution_clock::now();

			long long start = std::chrono::time_point_cast<std::chrono::microseconds>(m_StartTimepoint).time_since_epoch().count();
			long long end = std::chrono::time_point_cast<std::chrono::microseconds>(endTimepoint).time_since_epoch().count();

			uint32_t threadID = std::hash<std::thread::id>{}(std::this_thread::get_id());
			Instrumentor::Get().WriteProfile({ m_Name, start, end, threadID });

			m_Stopped = true;
		}
	private:
		const char* m_Name;
		std::chrono::time_point<std::chrono::high_resolution_clock> m_StartTimepoint;
		bool m_Stopped;
	};
}

#define HZ_PROFILE 1
#if HZ_PROFILE
	#define HZ_PROFILE_BEGIN_SESSION(name, filepath) ::Hazel::Instrumentor::Get().BeginSession(name, filepath)
	#define HZ_PROFILE_END_SESSION() ::Hazel::Instrumentor::Get().EndSession()
	#define HZ_PROFILE_SCOPE(name) ::Hazel::InstrumentationTimer timer##__LINE__(name);
	#define HZ_PROFILE_FUNCTION() HZ_PROFILE_SCOPE(__FUNCSIG__)
#else
	#define HZ_PROFILE_BEGIN_SESSION(name, filepath)
	#define HZ_PROFILE_END_SESSION()
	#define HZ_PROFILE_SCOPE(name)
	#define HZ_PROFILE_FUNCTION()
#endif
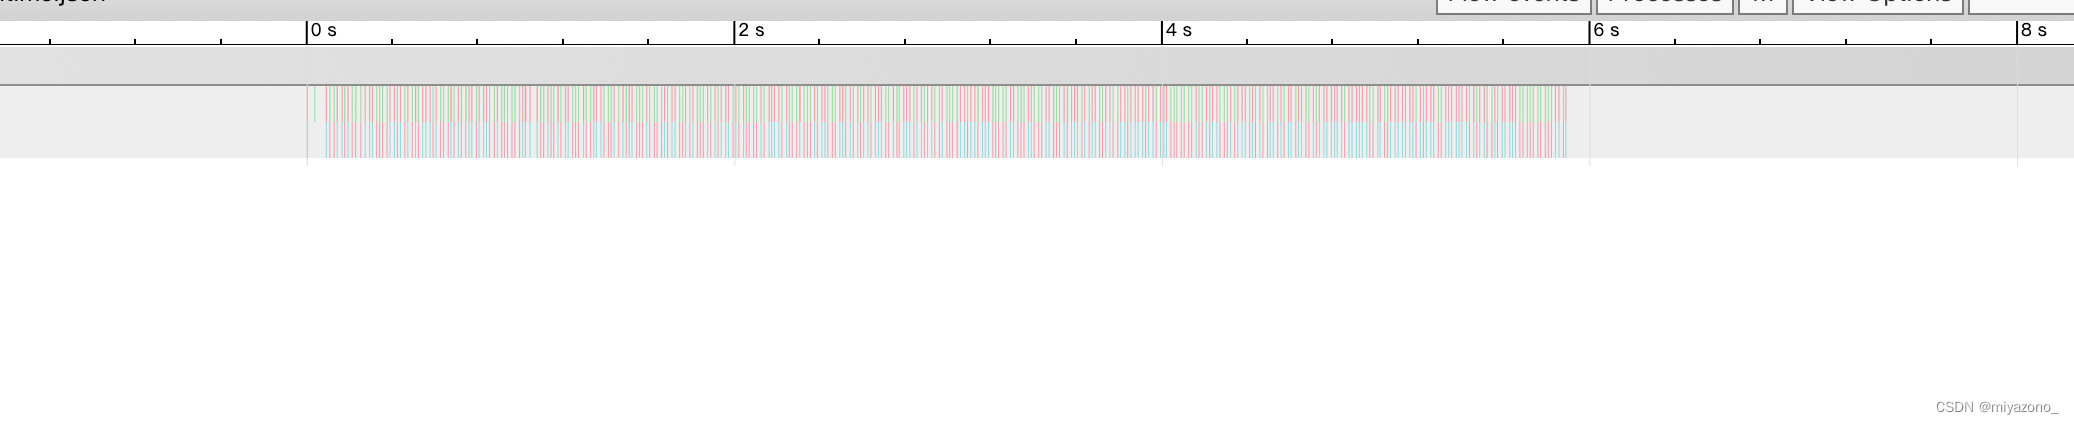
之后在代码块添加宏之后就会写入到 json 文件中,然后可以在 Chrome//:tracing 进行显示:


 1623
1623


 被折叠的 条评论
为什么被折叠?
被折叠的 条评论
为什么被折叠?
 到【灌水乐园】发言


