


Android provides rich SDK and developer environment to build applications targeted for Android devices. An application developer can prototype, test and debug Android SDK applications using Eclipse ADT plugin or Android Studio
.
SDK Debugging page explains various tools and ways of debugging applications. The debugging gets tricky if you are working on Android platform internals. This article explains a way of debugging Android platform services using Eclipse IDE.
If you have modified framework classes and like to debug those changes on a live system, the technique described here comes in handy. If you are working on a fork of Android platform and would like to understand different moving parts in Android framework, you can use this method to step through framework classes.
First you need to create an Eclipse project for Android platform. Please follow the instructions at Using Eclipse to browse/edit AOSP code. You don't need Eclipse ADT plugin for this. The Java project created above is a standard J2SE style java project. What we are going to do is create a debug configuration to debug remote Java applications.
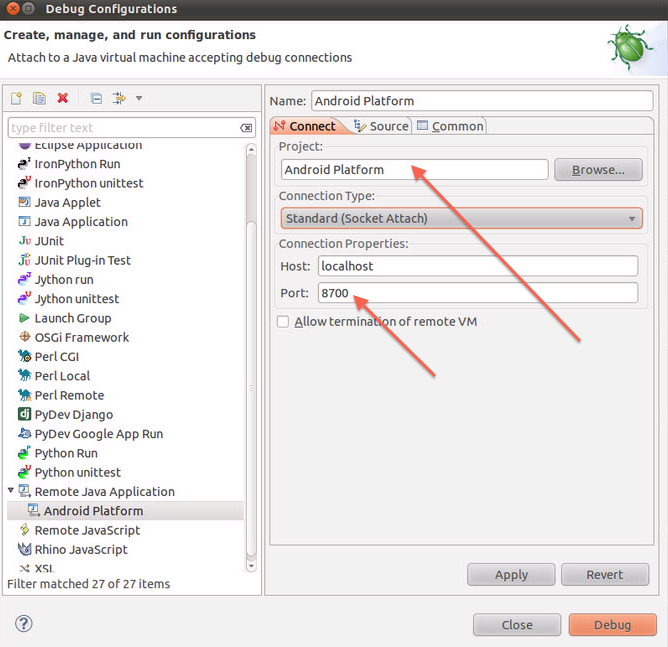
Select Run->Debug Configurations... menu option. Then select Remote Java Application from the list on left side.
Then press the icon with + sign from the popup toolbar to create new debug configuration. The port should be changed to 8700, host should be localhost and the project should be Android platform as shown below.
Then press Apply to save the configuration.
Launch terminal window and add Android sdk tools directory to PATH.
Assuming Android SDK is installed at /opt/android/sdk folder,
Lets say the IP address of android device is 10.70.77.23. Connect to it using adb.
$adb connect 10.70.77.23
You don't need to do the above step if you are connecting to your device/emulator using USB.
Launch monitor application like below.
$monitor &
Find the process with name system_process and select it. You should see port 8700 tagged to system_process as shown below.

That means JDWP debugging commands from the Eclipse debugger will be forwarded to the process tagged with port 8700. Minimize monitor application now.
If you are using ADT plugin, you can do the same from DDMS panel. Please keep in mind that you can have either DDMS or monitor running, but not both simultaneously.
Navigate to the method finishDrawingWindow and setup a line break point on the first line in this method.
Choose Run->Debug Configurations... and select Android platform debug configuration created above. PressDebug button.
Eclipse shows an error popup that there were errors, please click OK to continue. This error is due to the fact that Eclipse failed to build the project which is expected as our project is there merely for editing/browsing and debugging purposes.
Eclipse debugger should connect to system_process. Eclipse should transition to Java debug perspective. If it didn't, please pick that perspective. It should look like this.
Navigate to different application on your device. That will make system_service hit the breakpoint created above. It should look like this.
You can step through this method using the buttons inside the oval annotation above.
If you disconnect from system_process and then start debugging again, it might fail. Please make suresystem_process is the selected process in DDMS/Monitor window (i.e. so that port 8700 traffic gets delivered to system_process).
DDMS/Monitor application was used to proxy localhost:8700 traffic to debug agent of selected process on a device.
Standard Java debugging tools that ship with Eclipse JDT were used to connect to localhost:8700 and debug the target process.
This technique can also be used to debug any SDK application on an Android device.
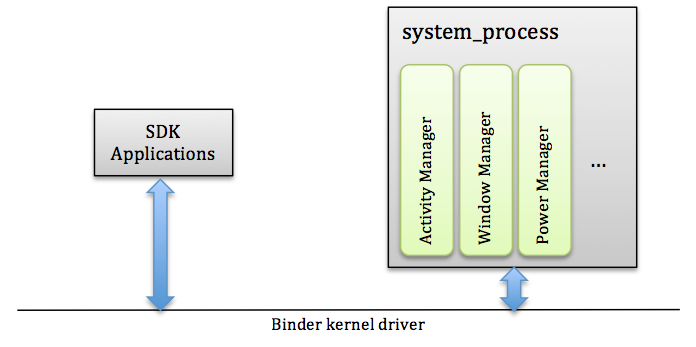
Platform Services
Platform services are Android framework services like Activity manager, Window manager, Input manager, WiFi manager etc that run as part of system_process Linux process.
If you have modified framework classes and like to debug those changes on a live system, the technique described here comes in handy. If you are working on a fork of Android platform and would like to understand different moving parts in Android framework, you can use this method to step through framework classes.
First you need to create an Eclipse project for Android platform. Please follow the instructions at Using Eclipse to browse/edit AOSP code. You don't need Eclipse ADT plugin for this. The Java project created above is a standard J2SE style java project. What we are going to do is create a debug configuration to debug remote Java applications.
Remote Debug Configuration
Launch Eclipse and open Android platform project created above.Select Run->Debug Configurations... menu option. Then select Remote Java Application from the list on left side.
Then press the icon with + sign from the popup toolbar to create new debug configuration. The port should be changed to 8700, host should be localhost and the project should be Android platform as shown below.
Then press Apply to save the configuration.
Debug System_process
Android SDK is needed for remaining steps. If you haven't installed Android SDK, please install it following the instructions at Android SDK installation.Launch terminal window and add Android sdk tools directory to PATH.
Assuming Android SDK is installed at /opt/android/sdk folder,
$export PATH=/opt/android/sdk/tools:
/opt/android/sdk/platform-tools:$PATH
Lets say the IP address of android device is 10.70.77.23. Connect to it using adb.
$adb connect 10.70.77.23
You don't need to do the above step if you are connecting to your device/emulator using USB.
Launch monitor application like below.
$monitor &
Find the process with name system_process and select it. You should see port 8700 tagged to system_process as shown below.
That means JDWP debugging commands from the Eclipse debugger will be forwarded to the process tagged with port 8700. Minimize monitor application now.
If you are using ADT plugin, you can do the same from DDMS panel. Please keep in mind that you can have either DDMS or monitor running, but not both simultaneously.
Setup Breakpoints and Go!
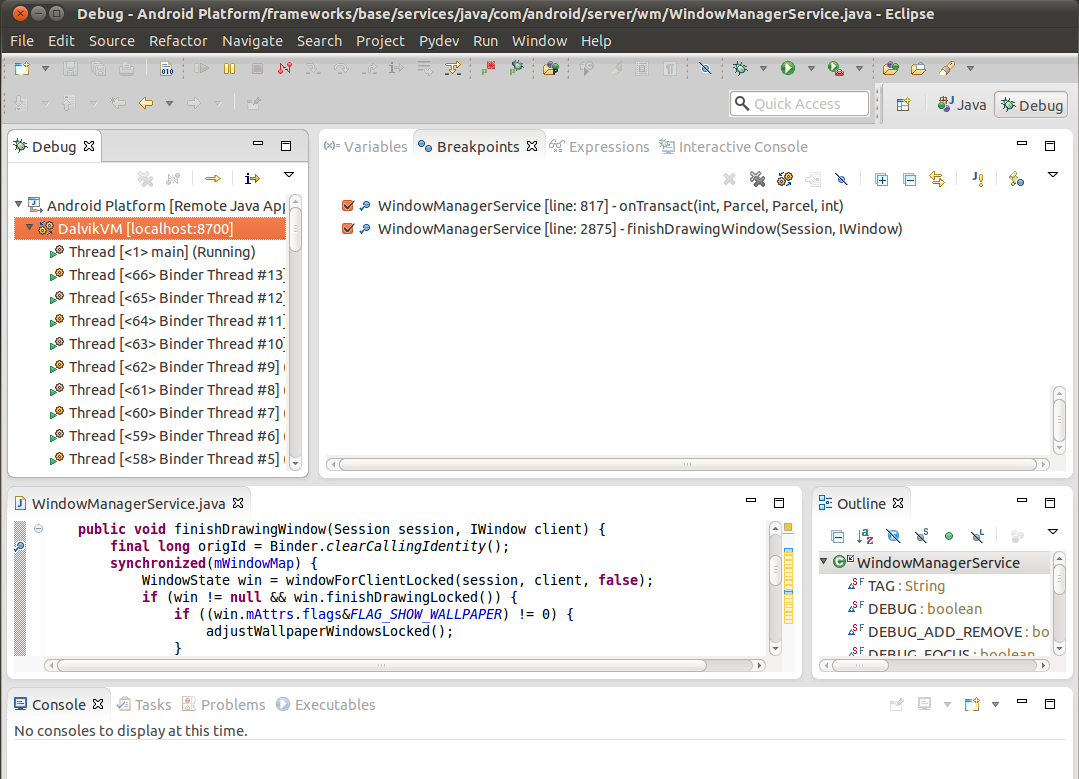
Lets setup couple of breakpoints in one of platform services. Open WindowManagerService.java fromframeworks/base/services/java->com.android.server.wm package in the Eclipse project.Navigate to the method finishDrawingWindow and setup a line break point on the first line in this method.
Choose Run->Debug Configurations... and select Android platform debug configuration created above. PressDebug button.
Eclipse shows an error popup that there were errors, please click OK to continue. This error is due to the fact that Eclipse failed to build the project which is expected as our project is there merely for editing/browsing and debugging purposes.
Eclipse debugger should connect to system_process. Eclipse should transition to Java debug perspective. If it didn't, please pick that perspective. It should look like this.
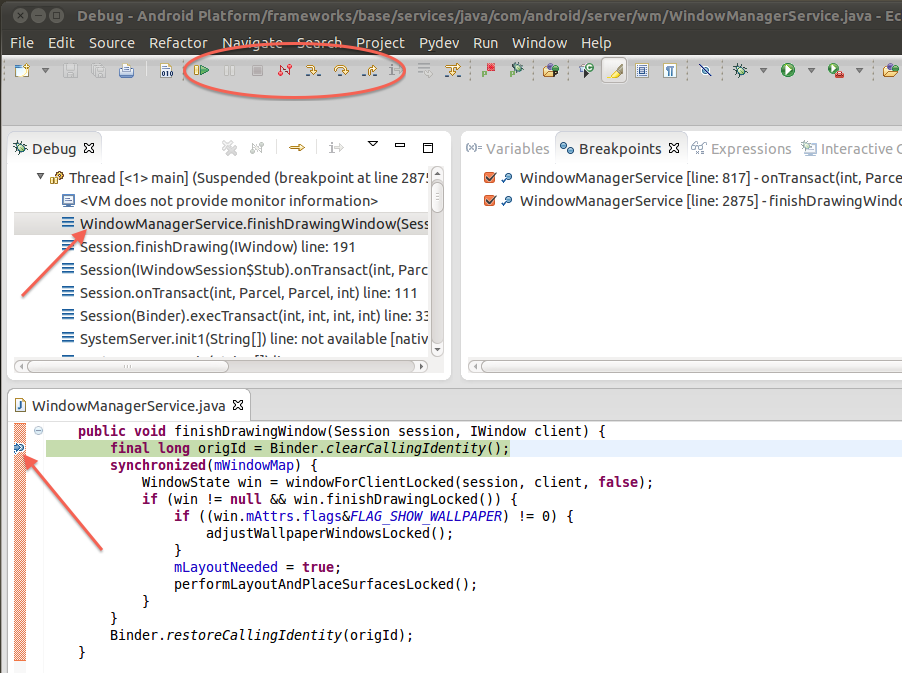
Navigate to different application on your device. That will make system_service hit the breakpoint created above. It should look like this.
You can step through this method using the buttons inside the oval annotation above.
If you disconnect from system_process and then start debugging again, it might fail. Please make suresystem_process is the selected process in DDMS/Monitor window (i.e. so that port 8700 traffic gets delivered to system_process).
Recap
A debug configuration was created to debug remote Java application at localhost:8700.DDMS/Monitor application was used to proxy localhost:8700 traffic to debug agent of selected process on a device.
Standard Java debugging tools that ship with Eclipse JDT were used to connect to localhost:8700 and debug the target process.
This technique can also be used to debug any SDK application on an Android device.
Stay tuned for more debugging tips.
原文地址:http://apienthusiast.blogspot.com/2014/06/debugging-android-java-framework.html


 6335
6335


 被折叠的 条评论
为什么被折叠?
被折叠的 条评论
为什么被折叠?
 到【灌水乐园】发言


