


1. 程序环境
- Qt6.5.1, mingw11.2
- mathgl 8.0.1: https://sourceforge.net/projects/mathgl/,推荐下载mathgl-8.0.LGPL-mingw.win64.7z,Windows环境尝试自己编译mathgl会缺失一些库,补充完整也可以自己编译,路径
"D:\mathgl-8.0.LGPL-mingw.win64\bin"添加至系统环境变量
2. 程序要点
(1) mathgl默认不支持Qt6,一个折中的办法是绘图后先生成svg图像,然后再用Qt6加载文件进行显示,如果生成bmp、png等格式文件再用QLabel显示图片会虚化很严重,故采用svg的方法:
gr->WriteSVG("plot.svg");
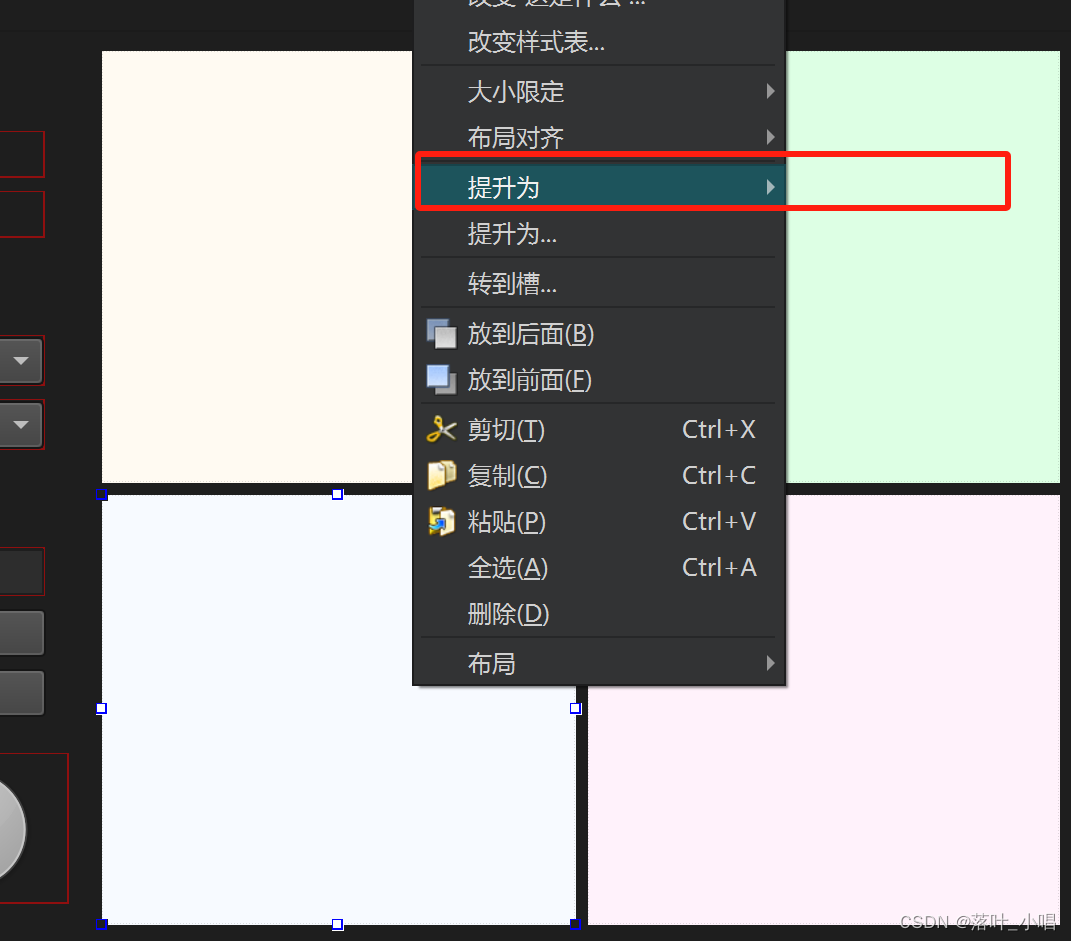
(2) 使用QtSvgWidgets渲染svg图像,ui界面先拖入一个QWidget控件,然后将控件提升为QtSvgWidgets,最后在代码中实现加载svg图像:
ui->widget_1->load(QString("plot.svg"));
ui->widget_1->show();
(3) .pro文件添加下列内容,添加svgwidgets模块和mathgl库路径,注意动态链接mathgl使用的是libmgl.dll.a:
QT       += core gui svg svgwidgets
INCLUDEPATH += D:/SciComputing/mathgl-8.0.LGPL-mingw.win64/include
LIBS += D:/SciComputing/mathgl-8.0.LGPL-mingw.win64/lib/libmgl.dll.a
(4)mathgl每次绘图都需要重置一下,否则会收到之前绘图的影响,很奇怪,明明不同绘图对象已经用new的方式创建了。
mglGraph *gr = new mglGraph();
gr->DefaultPlotParam(); // 重设
3.参考代码
(1)mainwindows.cpp
#include "mainwindow.h"
#include "ui_mainwindow.h"
#include <QGraphicsView>
#include <QtSvgWidgets>
#include <QFile>
#include <QSvgRenderer>
#include <QPixmap>
#include <QImage>
#include <QGraphicsScene>
#include "mgl2/mgl.h"

MainWindow::MainWindow(QWidget *parent)
    : QMainWindow(parent)
    , ui(new Ui::MainWindow)
{

    ui->setupUi(this);
}

MainWindow::~MainWindow()
{

    delete ui;
}

void MainWindow::on_btn1_clicked()
{

    // mgl绘图
    mglData dat(30,40);	// data to for plotting
    for(long i=0;i<30;i++)   for(long j=0;j<40;j++)
            dat.a[i+30*j] = 1/(1+(i-15)*(i-15)/9.+(j-20)*(j-20)/16.);
    mglGraph *gr = new mglGraph();		// class for plot drawing
    gr->DefaultPlotParam();
    gr->Clf();
    gr->SetRanges(0
最低0.47元/天 解锁文章


 2358
2358

 被折叠的 条评论
为什么被折叠?
被折叠的 条评论
为什么被折叠?
 到【灌水乐园】发言


