


On-device Debugging of UIQ 3 applications
When developing an application for UIQ 3, you can debug it either on the emulator included in the UIQ 3 SDK, or on a real phone using the App TRK tool for UIQ 3. Debugging on the emulator is often sufficient, but in some cases it may be required to debug on a phone, for example when using specific hardware features.
The App TRK tool is a small application which you install on your phone. It makes it possible to run and debug applications directly from Carbide.c++. It communicates with Carbide over a serial port, either using USB cable, Bluetooth™ or IR. This article will show how to perform On Device Debugging using USB cable.
The App TRK tool supports important debug features such as setting breakpoints, monitoring variables etc. The tool is free, but to use it, a non-free version of Carbide.c++ is required, for example Carbide.c++ Developer Edition. Carbide.c++ is available here>>
Download App TRK tool for UIQ 3, version 2.8.3>>http://tools.ext.nokia.com/agents/index.htm
To get started with On Device Debugging for UIQ 3 (using USB cable), follow these set-by-step instructions. It is assumed that you have a version of Carbide.c++ supporting On Device Debugging installed:
1. Download the App TRK tool from the link above and install it in the phone as a normal application.
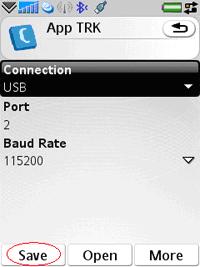
2. Connect the phone to your PC with a USB cable and start the App TRK application on the phone. To change the application settings, use the settings dialog. To run On Device Debugging over USB, make sure that USB connection and port 2 is selected, then click Save.
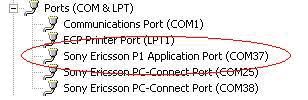
3. The App TRK status should be Connected. If you have the appropriate drives installed, an Application Port should be added on your PC when the USB cable is connected. Use the Windows Device manager to find out the number of the Application Port , COM37 in the example shown below.
4. Start Carbide.c++ and open the project you want to debug.
5. Set the active build configuration to the Phone Debug configuration for your compiler (GCCE is the compiler included in the UIQ3 3rd party SDK) by choosing Project – Active Build Configuration – Phone Debug.
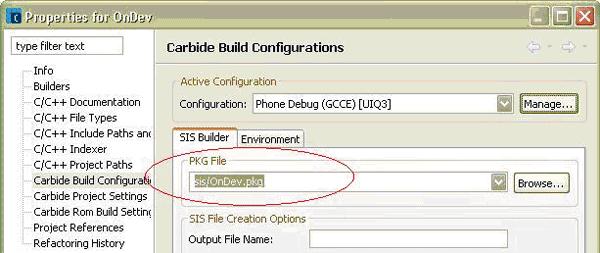
6. If your project does not have a Phone Debug build configuration you must add one. Right click on the project folder and select Properties. Choose Carbide Build Configuration in the project properties dialog that is displayed, and then click Manage…. In the Add/Remove Carbide Build Configurations dialog that is displayed, select the Phone Debug configuration and click OK.
7. Make sure that the PKG File field in the project properties dialog is pointing to the PKG file you want to use. If no PKG file is specified, the SIS file will not be created.
8. Build the project by choosing Project – Build Project and verify that the SIS file was created.
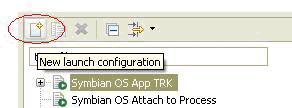
9. Create a debug configuration for your project. Select the project folder in C/C++ Projects tab and choose Run – Debug…. In the Debug dialog which is displayed, select the Symbian OS App TRK configuration type and click the New launch configuration icon.
10. A new debug configuration for the project is created. On the Connection tab, select the port you noted in step 3 using the Device manager.
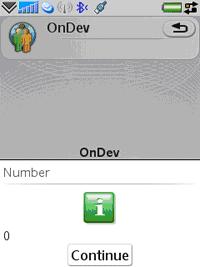
11. Press Debug in the lower right corner of the dialog. The application should be silently installed and launched on the phone. The Debug perspective is opened in Carbide, and in the Debug view you can se the debugger instance.
12. You can add breakpoints to stop the execution by double clicking in margin next to the line you want to halt on (you can also right click in the margin and select Toggle Breakpoint, select a line and choose Run - Toggle Line Breakpoint or select a line and press Ctrl+Shift+B).
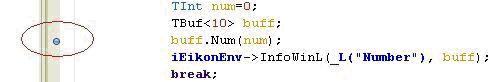
13. Make the application executing on the phone execute the line where you have set the breakpoint. The Debug view shows that a breakpoint has been hit.
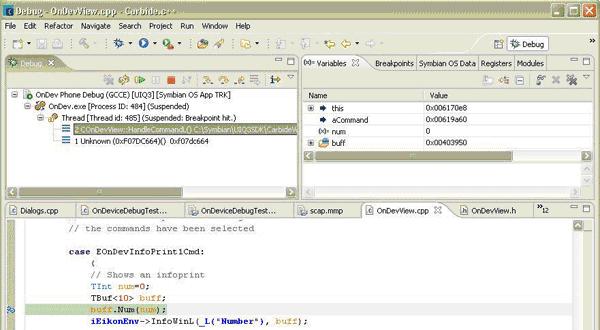
14. The Variables tab (shown in the top right corner in the picture above) shows the variable values, but can also be used to change the values. Below are two examples from running the code shown above. In the rightmost example, the num variable was changed to 10 at the breakpoint.
15. When you want to continue after the execution has stopped at a breakpoint, you can use commands such as Run - Step Into (F5), Run – Step Over (F6) and Run – Resume (F8).
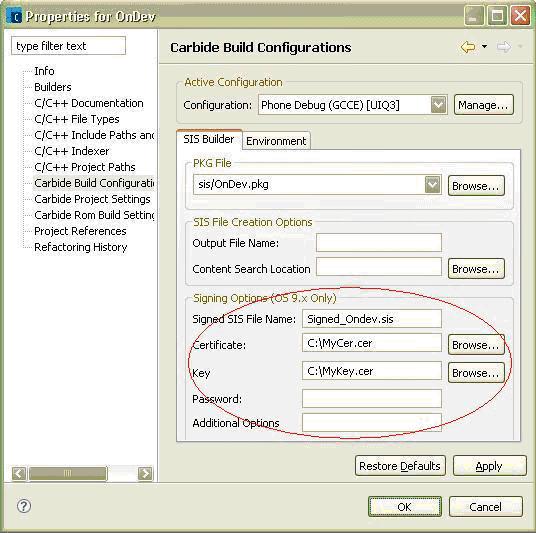
If you need to sign your application in order to use some capabilities, you can do that by modifying the build configuration in the projects properties dialog. Right click on the project folder and select Properties. Choose Carbide Build Configuration in the dialog that is shown. Add the path to your .cer and .key file and optionally specify the password and signed sis filename.
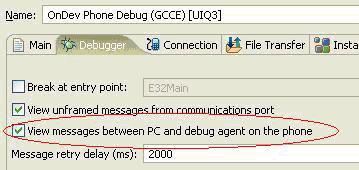
If you are having problems to make On Device Debugging work, you may get some information about what is going wrong by examining the traffic between the phone and the IDE. It is displayed in the Console tab in Carbide if you have selected the View messages between PC and debug agent on the phone checkbox in the debug configuration.
For more information, see Carbide.c++ help.


 2479
2479


 被折叠的 条评论
为什么被折叠?
被折叠的 条评论
为什么被折叠?
 到【灌水乐园】发言


