


据说这是一个国外物理老师常用的3D绘图包。例子在这里:(不少QQ弹弹得很好玩)https://www.glowscript.org/#/user/GlowScriptDemos/folder/Examples/

直接用pip安装即可
pip install vpython
先随便测试了一个:(改了描述和坐标轴颜色)点击运行后,会在http://localhost:63031/ 展示图像。
之后用到了再添加例子吧!!!!
import vpython
from vpython import scene, cylinder, text, vec, color, cross, vertex, rate, quad
from math import sin, cos
scene.width = scene.height = 600
# There is an L by L grid of vertex objects, numbered 0 through L-1 by 0 through L-1.
# Only the vertex operators numbered L-2 by L-2 are used to create quads.
# The extra row and extra column of vertex objects simplifies edge calculations.
# The stride length from y = 0 to y = 1 is L.
L = 50
scene.center = vec(0.05 * L, 0.2 * L, 0)
scene.range = 1.3 * L
## The next line contains LaTeX math notation. See http://www.glowscript.org/docs/VPythonDocs/MathJax.html
# scene.caption = """\\( f(x,y,t) = 0.7+0.2\\sin{(10x)}\\cos{(10y)}\\cos{(2t)} \\)
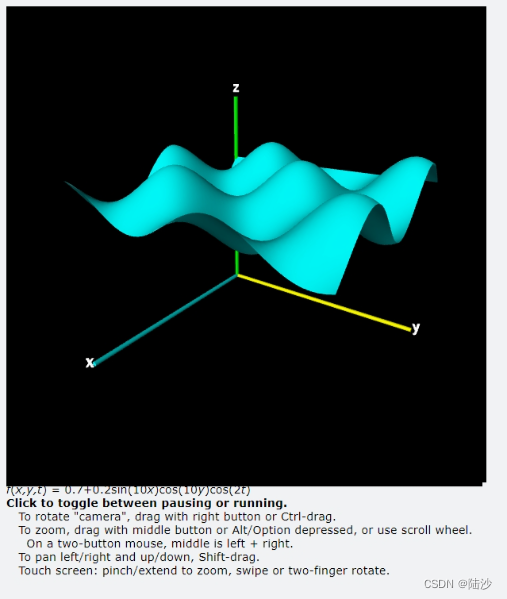
scene.caption = """<i>f</i>(<i>x,y,t</i>) = 0.7+0.2sin(10<i>x</i>)cos(10<i>y</i>)cos(2<i>t</i>)
<b>Click to toggle between pausing or running.</b>
To rotate "camera", drag with right button or Ctrl-drag.
To zoom, drag with middle button or Alt/Option depressed, or use scroll wheel.
On a two-button mouse, middle is left + right.
To pan left/right and up/down, Shift-drag.
Touch screen: pinch/extend to zoom, swipe or two-finger rotate."""
# MathJax.Hub.Queue(["Typeset",MathJax.Hub]) # format the LaTeX; see http://www.glowscript.org/docs/VPythonDocs/MathJax.html
class plot3D:
def __init__(self, f, xmin, xmax, ymin, ymax, zmin, zmax):
# The x axis is labeled y, the z axis is labeled x, and the y axis is labeled z.
# This is done to mimic fairly standard practive for plotting
# the z value of a function of x and y.
self.f = f
if not xmin:
self.xmin = 0
else:
self.xmin = xmin
if not xmax:
self.xmax = 1
else:
self.xmax = xmax
if not ymin:
self.ymin = 0
else:
self.ymin = ymin
if not ymax:
self.ymax = 1
else:
self.ymax = ymax
if not zmin:
self.zmin = 0
else:
self.zmin = zmin
if not zmax:
self.zmax = 1
else:
self.zmax = zmax
R = L / 100
d = L - 2
xaxis = cylinder(pos=vec(0, 0, 0), axis=vec(0, 0, d), radius=R, color=color.cyan)
yaxis = cylinder(pos=vec(0, 0, 0), axis=vec(d, 0, 0), radius=R, color=color.yellow)
zaxis = cylinder(pos=vec(0, 0, 0), axis=vec(0, d, 0), radius=R, color=color.green)
k = 1.02
h = 0.05 * L
text(pos=xaxis.pos + k * xaxis.axis, text='x', height=h, align='center', billboard=True, emissive=True)
text(pos=yaxis.pos + k * yaxis.axis, text='y', height=h, align='center', billboard=True, emissive=True)
text(pos=zaxis.pos + k * zaxis.axis, text='z', height=h, align='center', billboard=True, emissive=True)
self.vertices = []
for x in range(L):
for y in range(L):
val = self.evaluate(x, y)
self.vertices.append(self.make_vertex(x, y, val))
self.make_quads()
self.make_normals()
def evaluate(self, x, y):
d = L - 2
return (d / (self.zmax - self.zmin)) * (self.f(self.xmin + x * (self.xmax - self.xmin) / d,
self.ymin + y * (self.ymax - self.ymin) / d) - self.zmin)
def make_quads(self):
# Create the quad objects, based on the vertex objects already created.
for x in range(L - 2):
for y in range(L - 2):
v0 = self.get_vertex(x, y)
v1 = self.get_vertex(x + 1, y)
v2 = self.get_vertex(x + 1, y + 1)
v3 = self.get_vertex(x, y + 1)
quad(vs=[v0, v1, v2, v3])
def make_normals(self):
# Set the normal for each vertex to be perpendicular to the lower left corner of the quad.
# The vectors a and b point to the right and up around a vertex in the xy plance.
for i in range(L * L):
x = int(i / L)
y = i % L
if x == L - 1 or y == L - 1: continue
v = self.vertices[i]
a = self.vertices[i + L].pos - v.pos
b = self.vertices[i + 1].pos - v.pos
v.normal = cross(a, b)
def replot(self):
for i in range(L * L):
x = int(i / L)
y = i % L
v = self.vertices[i]
v.pos.y = self.evaluate(x, y)
self.make_normals()
def make_vertex(self, x, y, value):
return vertex(pos=vec(y, value, x), color=color.cyan, normal=vec(0, 1, 0))
def get_vertex(self, x, y):
return self.vertices[x * L + y]
def get_pos(self, x, y):
return self.get_vertex(x, y).pos
t = 0
dt = 0.02
def f(x, y):
# Return the value of the function of x and y:
return 0.7 + 0.2 * sin(10 * x) * cos(10 * y) * sin(2 * t)
p = plot3D(f, 0, 1, 0, 1, 0, 1) # function, xmin, xmax, ymin, ymax (defaults 0, 1, 0, 1, 0, 1)
run = True
def running(ev):
global run
run = not run
scene.bind('mousedown', running)
scene.forward = vec(-0.7, -0.5, -1)
while True:
rate(30)
if run:
p.replot()
t += dt


 938
938


 被折叠的 条评论
为什么被折叠?
被折叠的 条评论
为什么被折叠?
 到【灌水乐园】发言


