


作者:严涛 浙江大学作物遗传育种在读研究生(生物信息学方向)伪码农,R语言爱好者,爱开源。
严涛老师的绘图教程还有:
ggplot2高效实用指南 (可视化脚本、工具、套路、配色)
简介
ggridges包主要用来绘制山峦图。尤其是针对时间或者空间分布可视化具有十分好的效果。ggridges主要提供两个几何图像函数:
geom_ridgeline(): 主要绘制山脊线图
geom_density_ridges():主要绘制密度山脊线图
具体用法可以参考官方文档:
https://cran.r-project.org/web/packages/ggridges/vignettes/introduction.html
geom_ridgeline()
library(ggridges)
library(tidyverse)
# grid.arrange来自于gridExtra包,可以同时拼图多个ggplot2对象
library(gridExtra)


my_data <- data.frame(x=1:5, y=rep(1,5), height=c(0,1,-1,3,2))
plot_base <- ggplot(my_data, aes(x, y, height=height))

# 默认负值不显示,除非指定min_height参数

grid.arrange(plot_base+geom_ridgeline(),
             plot_base+geom_ridgeline(min_height=-2), ncol=2)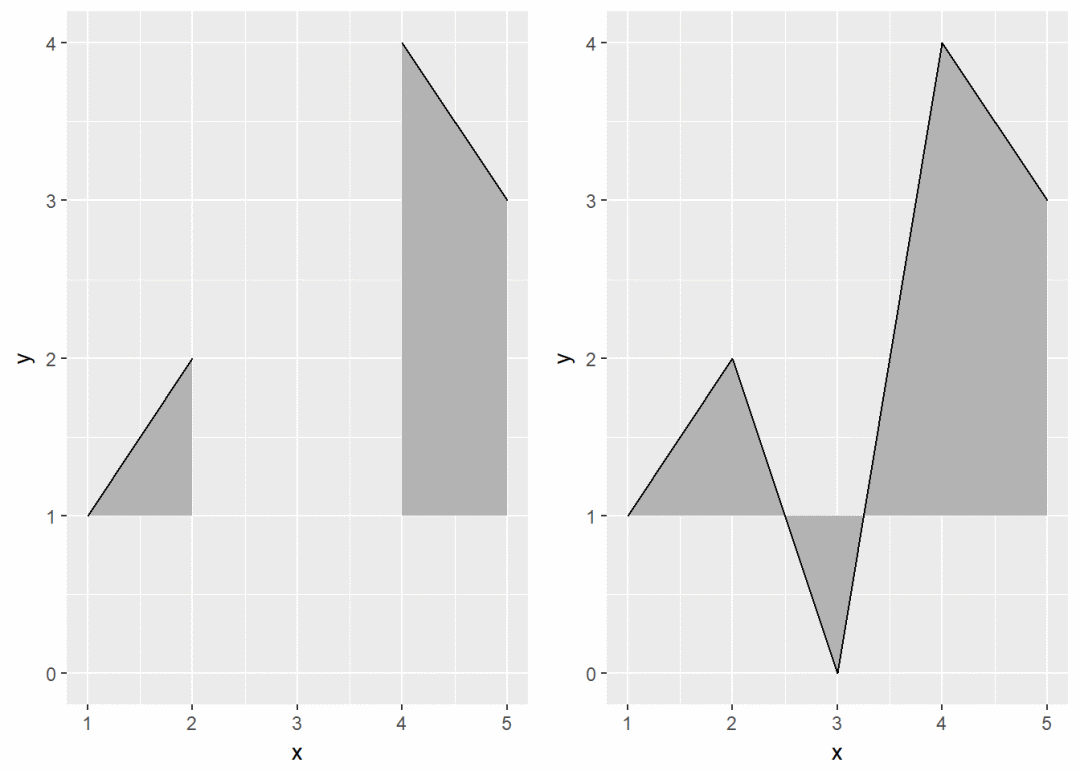
geom_density_ridges()
geom_density_ridges()函数首先会根据数据计算密度然后绘图,此时美学映射height没有必要写入函数中。下面使用lincoln_weather数据集。
# creates a vector of n equally spaced colors along the
# Matplolib 'viridis' color map

# also designed to be perceived by readers with the most common form of color blindness
#  scale_fill_viridis函数来源于此包,
# 其参数 option用于设置颜色 "magma" (or "A"), "inferno" (or "B"), "plasma" (or "C"),
and "viridis" (or "D", the default option).
# ?viridis可以查看其具体含义

library(viridis)
head(lincoln_weather[ ,1:4])


## # A tibble: 6 x 4
##   CST      `Max Temperature [F]` `Mean Temperature [F]` `Min Temperature ~
##   <chr>                    <int>                  <int>              <int>
## 1 2016-1-1                    37                     24                 11
## 2 2016-1-2                    41                     23                  5
## 3 2016-1-3                    37                     23                  8
## 4 2016-1-4                    30                     17                  4
## 5 2016-1-5                    38                     29                 19
## 6 2016-1-6                    34                     33                 32

# x后的值用 ` (反引号)括起,是因为列名字中存在空格和特殊字符,需要特殊对待
# fill = ..x.., double dots是ggplot2的一种特殊识别符,用来区分定义的和计算的美学参数
# 这里指用横轴的数据着色

ggplot(lincoln_weather, aes(x=`Mean Temperature [F]`, y=`Month`, fill=..x..))+
  geom_density_ridges_gradient(scale=3, rel_min_height=0.01, gradient_lwd = 1.)+
  scale_x_continuous(expand = c(0.01, 0))+ # 扩展下横轴和纵轴
  scale_y_discrete(expand = c(0.01,0))+
  scale_fill_viridis(name="Temp. [F]", option = "C")+
  labs(title="Temperature in Lincoln NE",
       subtitle="Mean temperature (Fahrenheit) by month for 2016\nData:Orogin CSV from the Weather Underground ")+
  theme_ridges(font_size = 13, grid = FALSE)+
  theme(axis.title.y = element_blank())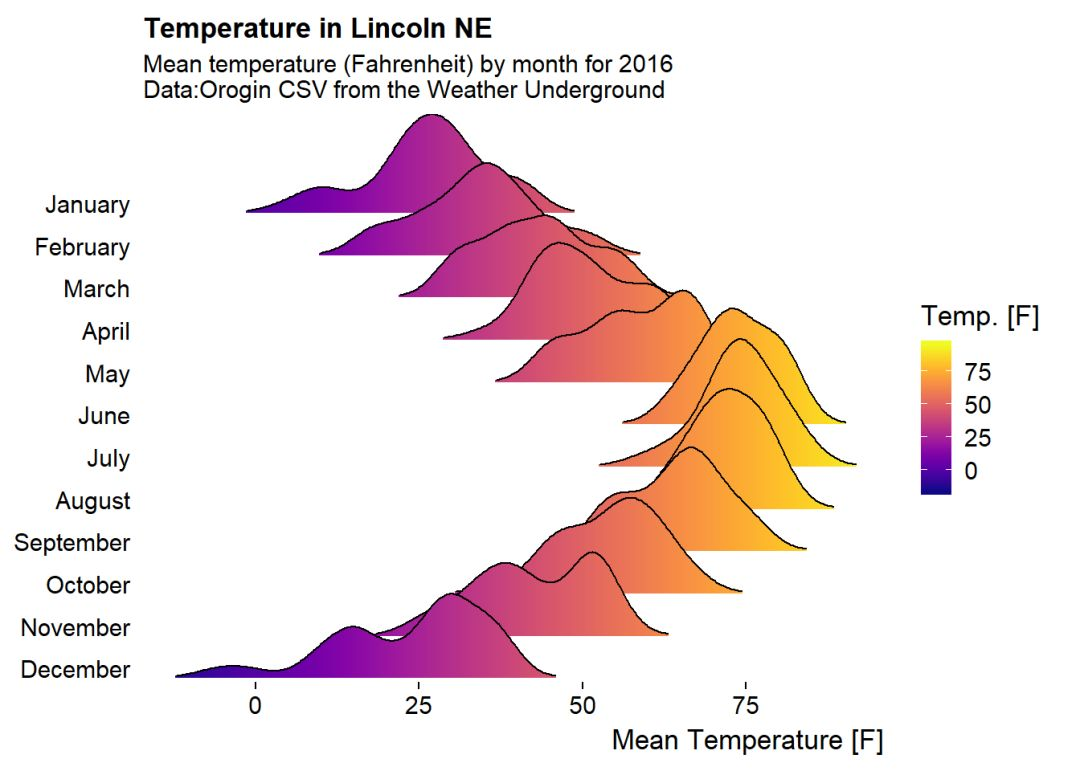
cyclinal scales
为了使得ggridges绘制的图形可视化效果最好,同时为了减少用户对颜色设置的困难,作者提供了cyclinal scales用于颜色轮转映射。
ggplot(diamonds, aes(x=price, y=cut, fill=cut))+
  geom_density_ridges(scale=4)+
  scale_fill_cyclical(values = c("blue", "green"))+
  theme_ridges(grid = FALSE)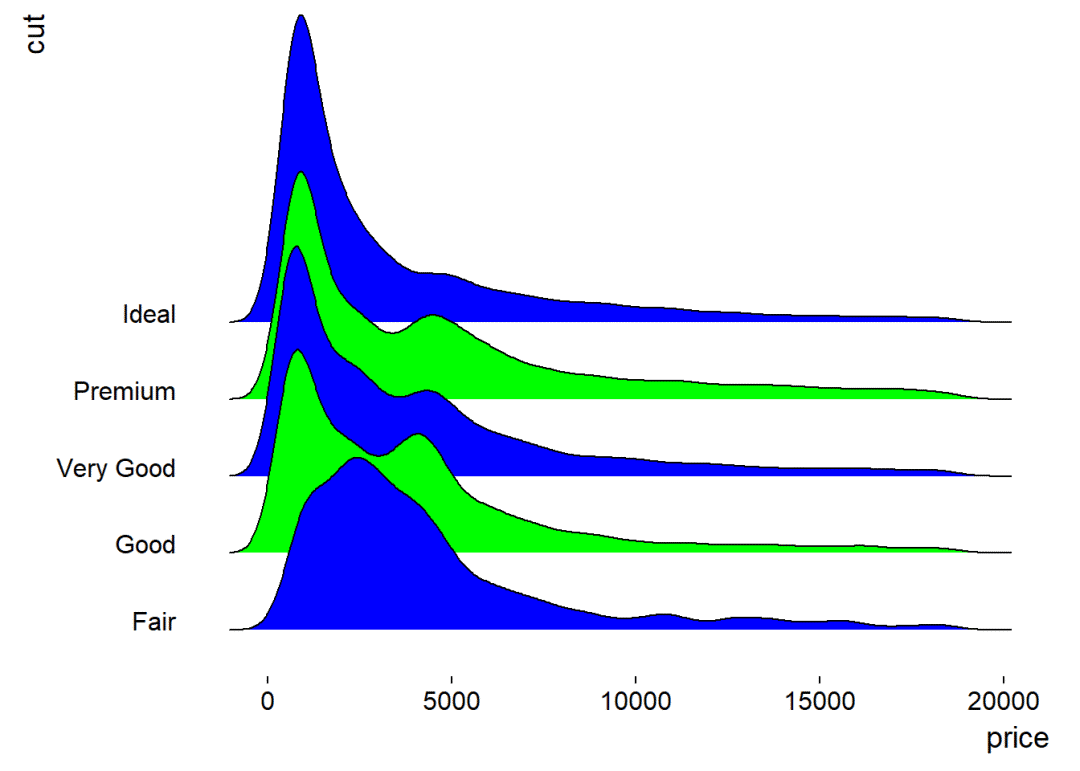
默认的,cyclinal scales为了防止误解是不绘制图例的,但是可以通过选项guide="legend"添加图例。
ggplot(diamonds, aes(x=price, y=cut, fill=cut))+
  geom_density_ridges(scale=4)+
  scale_fill_cyclical(values = c("blue", "green"), guide="legend")+
  theme_ridges(grid = FALSE)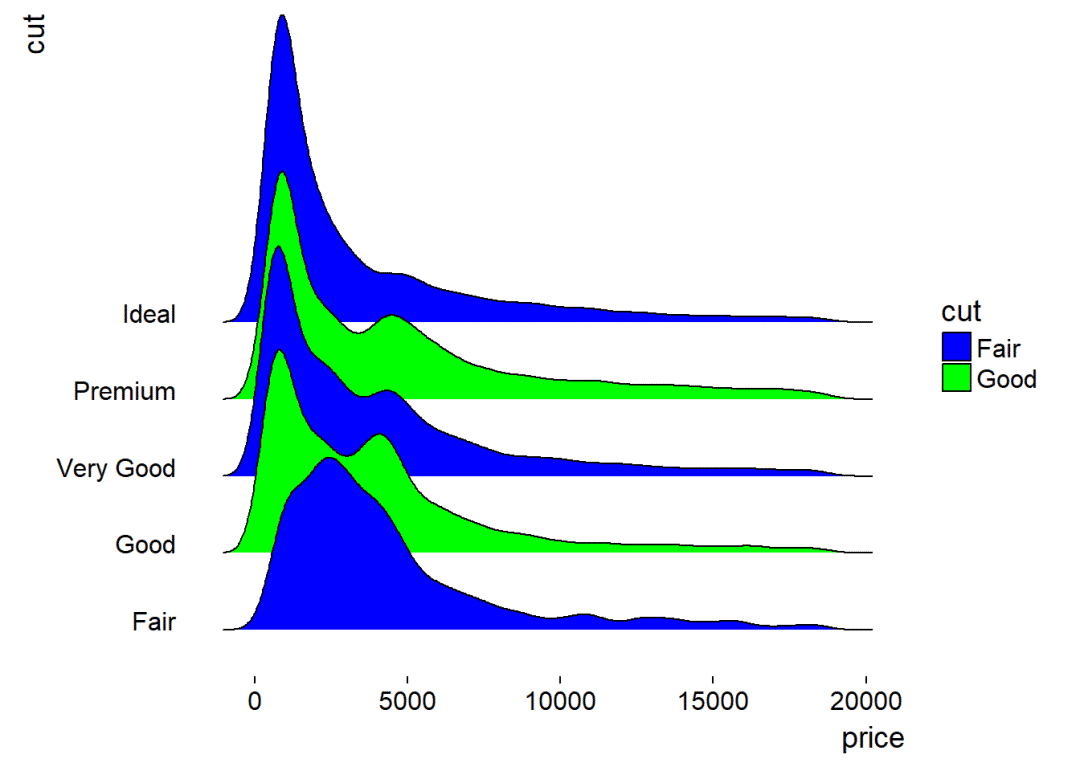
跟ggplot2一样,图例是可以修改的,其他参数比如大小、透明度、形状等都是可以通过cyclinal scales修改。
ggplot(diamonds, aes(x=price, y=cut, fill=cut))+
  geom_density_ridges(scale=4)+
  scale_fill_cyclical(values = c("blue", "green"), guide="legend",
                      labels=c("Fair"="blue", "Good"="green"),
                      name="Fill colors")+
  theme_ridges(grid = FALSE)
再来2个示例
不做解释了,如果想重现就把代码拆解开,按需修改。一句句话单独拆开运行,理解其操作内容。
library(dplyr)
library(forcats)
Catalan_elections %>%
  mutate(YearFct = fct_rev(as.factor(Year))) %>%
  ggplot(aes(y = YearFct)) +
  geom_density_ridges(
    aes(x = Percent, fill = paste(YearFct, Option)),
    alpha = .8, color = "white", from = 0, to = 100
  ) +
  labs(
    x = "Vote (%)",
    y = "Election Year",
    title = "Indy vs Unionist vote in Catalan elections",
    subtitle = "Analysis unit: municipalities (n = 949)",
    caption = "Marc Belzunces (@marcbeldata) | Source: Idescat"
  ) +
  scale_y_discrete(expand = c(0.01, 0)) +
  scale_x_continuous(expand = c(0.01, 0)) +
  scale_fill_cyclical(
    breaks = c("1980 Indy", "1980 Unionist"),
    labels = c(`1980 Indy` = "Indy", `1980 Unionist` = "Unionist"),
    values = c("#ff0000", "#0000ff", "#ff8080", "#8080ff"),
    name = "Option", guide = "legend"
  ) +
  theme_ridges(grid = FALSE)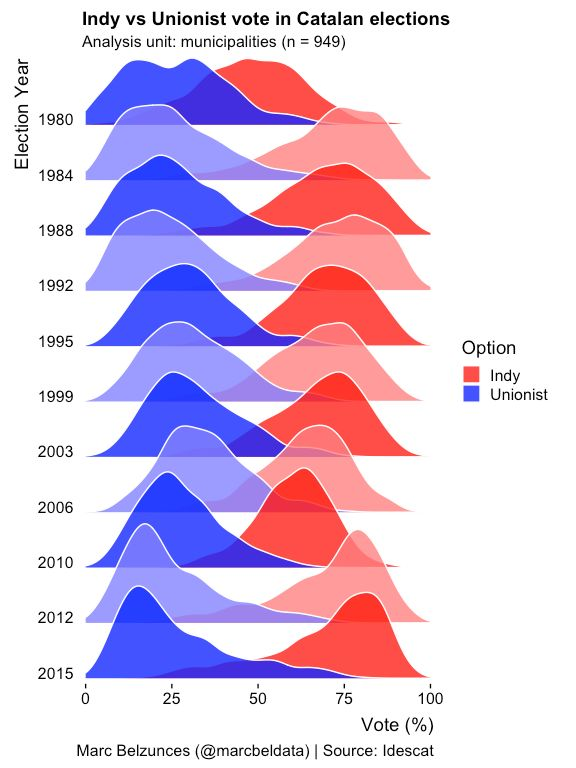
library(DAAG) # for ais dataset
ais$sport <- factor(
  ais$sport,
  levels = c("B_Ball", "Field", "Gym", "Netball", "Row", "Swim", "T_400m", "T_Sprnt", "Tennis", "W_Polo"),
  labels = c("Basketball", "Field", "Gym", "Netball", "Row", "Swim", "Track 400m", "Track Sprint", "Tennis", "Water Polo")
)

ggplot(ais, aes(x=ht, y=sport, color=sex, point_color=sex, fill=sex)) +
  geom_density_ridges(
    jittered_points=TRUE, scale = .95, rel_min_height = .01,
    point_shape = "|", point_size = 3, size = 0.25,
    position = position_points_jitter(height = 0)
  ) +
  scale_y_discrete(expand = c(.01, 0)) +
  scale_x_continuous(expand = c(0, 0), name = "height [cm]") +
  scale_fill_manual(values = c("#D55E0050", "#0072B250"), labels = c("female", "male")) +
  scale_color_manual(values = c("#D55E00", "#0072B2"), guide = "none") +
  scale_discrete_manual("point_color", values = c("#D55E00", "#0072B2"), guide = "none") +
  guides(fill = guide_legend(
    override.aes = list(
      fill = c("#D55E00A0", "#0072B2A0"),
      color = NA, point_color = NA))
  ) +
  ggtitle("Height in Australian athletes") +
  theme_ridges(center = TRUE)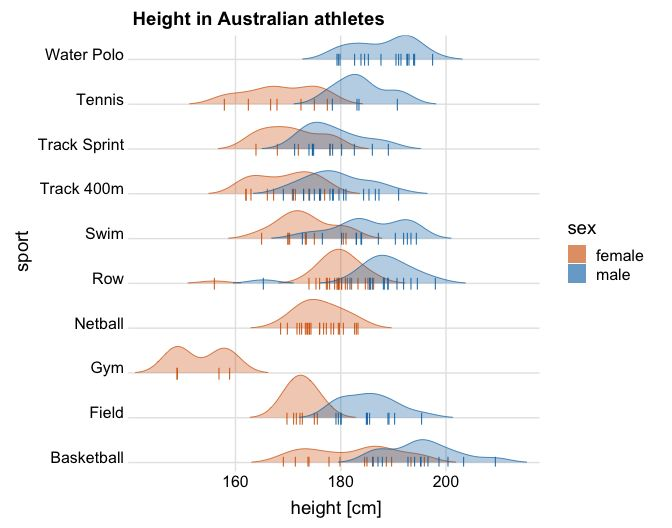
还有很多用法有兴趣的可以查看官方文档https://cran.r-project.org/web/packages/ggridges/vignettes/introduction.html和https://cran.r-project.org/web/packages/ggridges/vignettes/gallery.html)继续学习。
R统计和作图
随机森林randomForest 分类Classification 回归Regression
随机森林randomForest 分类Classification 回归Regression
R语言可视化学习笔记之ggridges包
万能转换:R图和统计表转成发表级的Word、PPT、Excel、HTML、Latex、矢量图等
那天空飘过的梅花月饼,是今年中秋最好的礼物
高颜值免费在线绘图

往期精品
后台回复“生信宝典福利第一波”获取教程合集


 4113
4113

 被折叠的 条评论
为什么被折叠?
被折叠的 条评论
为什么被折叠?
 到【灌水乐园】发言


