


 本文介绍了如何使用R语言的igraph包通过邻接矩阵创建和处理图,包括模式选择、权重设定及图的可视化实例。重点展示了`graph_from_adjacency_matrix`函数及其参数的使用方法。
介绍
R语言中的igraph包包含了大量对图进行处理的功能包括图论上的一些计算问题。
利用邻接矩阵生成igraph对象
graph_from_adjacency_matrix(
  adjmatrix,
  mode = c("directed", "undirected", "max", "min", "upper", "lower", "plus"),
  weighted = NULL,
  diag = TRUE,
  add.colnames = NULL,
  add.rownames = NA
)
#graph.adjacency()和该函数用法一样

from_adjacency(...)
参数介绍
-
adjmatrix
A square adjacency matrix. From igraph version 0.5.1 this can be a sparse matrix created with the Matrix package. -
mode
Character scalar, specifies how igraph should interpret the supplied matrix. See also the weighted argument, the interpretation depends on that too. Possible values are: directed, undirected, upper, lower, max, min, plus. See details below. -
weighted
This argument specifies whether to create a weighted graph from an adjacency matrix. If it is NULL then an unweighted graph is created and the elements of the adjacency matrix gives the number of edges between the vertices. If it is a character constant then for every non-zero matrix entry an edge is created and the value of the entry is added as an edge attribute named by the weighted argument. If it is TRUE then a weighted graph is created and the name of the edge attribute will be weight. See also details below. -
diag
Logical scalar, whether to include the diagonal of the matrix in the calculation. If this is FALSE then the diagonal is zerod out first. -
add.colnames
Character scalar, whether to add the column names as vertex attributes. If it is ‘NULL’ (the default) then, if present, column names are added as vertex attribute ‘name’. If ‘NA’ then they will not be added. If a character constant, then it gives the name of the vertex attribute to add. -
add.rownames
Character scalar, whether to add the row names as vertex attributes. Possible values the same as the previous argument. By default row names are not added. If ‘add.rownames’ and ‘add.colnames’ specify the same vertex attribute, then the former is ignored.
…
Passed to graph_from_adjacency_matrix.
对igraph对象作图
plot(g)可以实现对igraph对象的图示,其中有丰富的参数可以调整,可以参考:
https://www.jianshu.com/p/a40b7534155c
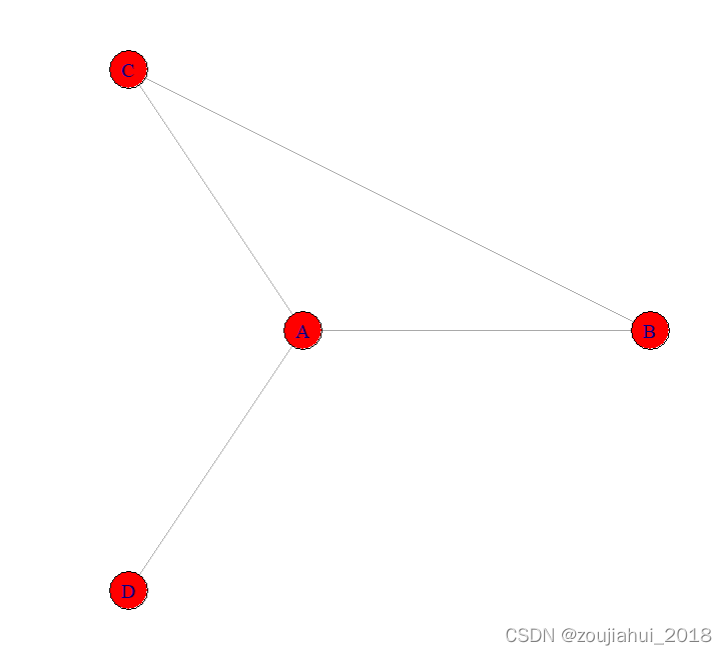
实例
library(igraph)
net=tcrossprod(rep(1,4))
diag(net)=0
net[4,2:4]=0
net[2:4,4]=0
colnames(net)=c('A','B','C','D')
g=graph_from_adjacency_matrix(net,mode='undirected')#graph.adjacency
plot(g,layout=layout_as_star,vertex.color='red')


 1032
1032

 被折叠的 条评论
为什么被折叠?
被折叠的 条评论
为什么被折叠?
 到【灌水乐园】发言


