


In this part of the exercise, you will build a logistic regression model to predict whether a student gets admitted into a university
首先观察数据
def LoadData():
    path = 'data/ex2data1.txt'
    data = pd.read_csv(path, header=None, names=['exam1', 'exam2', 'admitted'])
    negative = data[data['admitted'].isin([0])]
    positive = data[data['admitted'].isin([1])]
    return negative, positive, data
negtive, postitve, data = LoadData()
plt.figure(figsize=(8, 6))
ax = plt.subplot(1, 1, 1)

ax.scatter(postitve['exam1'], postitve['exam2'], color="blue", label="Admitted")
ax.scatter(negtive['exam1'], negtive['exam2'], color="red", label="No_Admitted", marker="x")

ax.set_xlabel('Exam 1 Score')
ax.set_ylabel('Exam 2 Score')

plt.legend()
plt.show()

想得到一条直线来区分两类学生
拟得到以下结果

故设边界函数 为 ax + by + c
sigmoid 函数
def sigmiod(z):
    return 1/(1 + np.exp(-z))


def fun(a, b, c, x, y):
    return sigmiod(c + a * x + b * y)
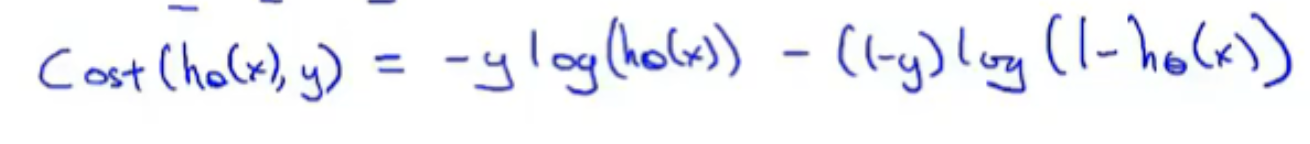
损失函数
贴上源码
"""
In this part of the exercise, you will build a logistic regression model to
predict whether a student gets admitted into a university
"""
import pandas as pd
import numpy as np
import matplotlib.pyplot as plt


times = 0

def LoadData():
    path = 'data/ex2data1.txt'
    data = pd.read_csv(path, header=None, names=['exam1', 'exam2', 'admitted'])
    negative = data[data['admitted'].isin([0])]
    positive = data[data['admitted'].isin([1])]
    return negative, positive, data


def sigmiod(z):
    return 1/(1 + np.exp(-z))


def fun(a, b, c, x, y):
    return sigmiod(c + a * x + b * y)


#损失函数
#h(x) = sigmiod(c + ax + by)
def cost_function(a, b, c):
    global times
    times += 1
    res = 0
    d_a = 0
    d_b = 0
    d_c = 0
    for row in data.iterrows():
        exam1 = row[1][0]
        exam2 = row[1][1]
        admitted = row[1][2]
        h = fun(a, b, c, exam1, exam2)
        res += admitted * np.log(h + 1e-6) + (1 - admitted) * np.log(1 - h + 1e-6)
        d_a += ((h - admitted) * exam1) * (1 / len(data))
        d_b += ((h - admitted) * exam2) * (1 / len(data))
        d_c += (h - admitted) * (1 / len(data))
    res *= -1/len(data)
    if times % 10000:
        print("cost: ", res, "    d_a:", d_a, "    d_b:", d_b, "        d_c:", d_c)
        print("a: ", a, "b: ", b, " c:", c, " h:", fun(a, b, c, exam1, exam2))
    return d_a, d_b, d_c


#为收敛返回true
def convergence(d_a, d_b, d_c, mark):
    return abs(d_a) > mark or abs(d_b) > mark or abs(d_c) > mark


#梯度下降
def gradient_descent(a, b, c, alpha):
    d_a, d_b, d_c = cost_function(a, b, c)
    while convergence(d_a, d_b, d_c, 10e-3):
        temp_a = a - alpha * d_a
        temp_b = b - alpha * d_b
        temp_c = c - alpha * d_c
        a = temp_a
        b = temp_b
        c = temp_c
        d_a, d_b, d_c = cost_function(a, b, c)
    return a, b, c


negtive, postitve, data = LoadData()
plt.figure(figsize=(8, 6))
ax = plt.subplot(1, 1, 1)

ax.scatter(postitve['exam1'], postitve['exam2'], color="blue", label="Admitted")
ax.scatter(negtive['exam1'], negtive['exam2'], color="red", label="No_Admitted", marker="x")

ax.set_xlabel('Exam 1 Score')
ax.set_ylabel('Exam 2 Score')


a, b, c = gradient_descent(0, 0, 0, 0.001)


x = np.arange(start=30, stop=100, step=1)
y = (- c - a * x) / b

ax.plot(x, y, color="green")

plt.legend()
plt.show()
结果


 325
325


 被折叠的 条评论
为什么被折叠?
被折叠的 条评论
为什么被折叠?
 到【灌水乐园】发言


