


这里写自定义目录标题
使用matplotlib.pyplot绘制多个图片和图表
import matplotlib.pyplot as plt
import numpy as np
''' 第一个,放图片 '''
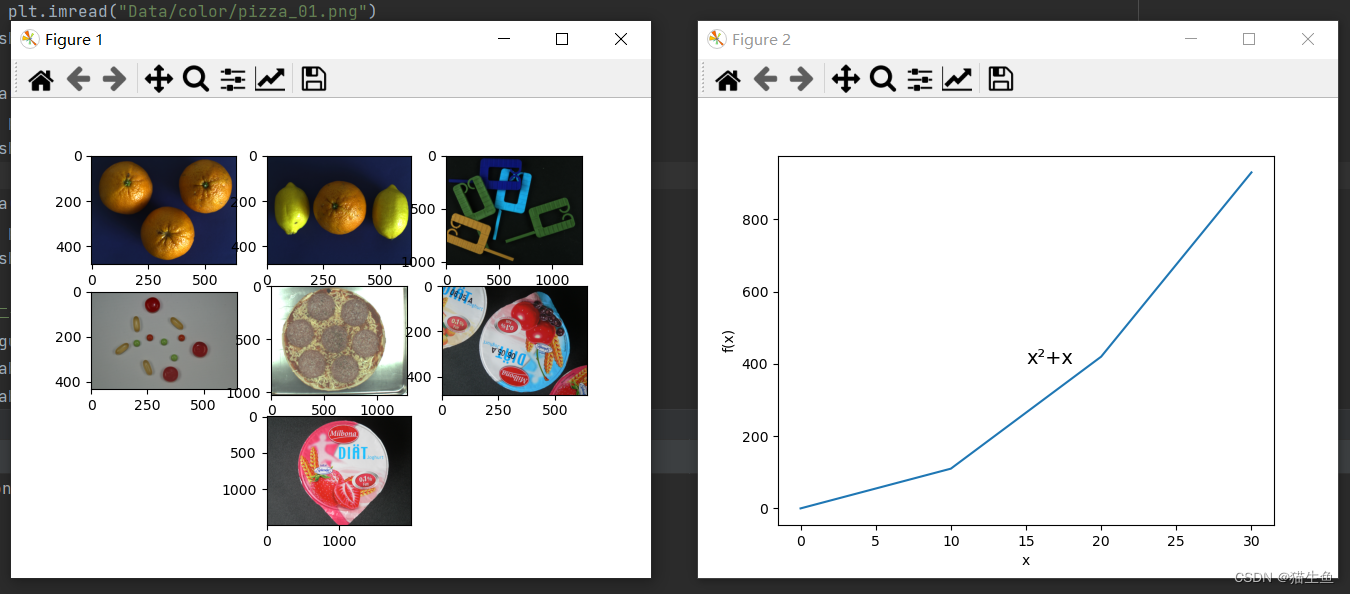
plt.figure(1) # 创建第1个图形
plt.sca(plt.subplot(3, 3, 1)) # 分成3行3列,并选择第1个位置
img0 = plt.imread("Data/color/citrus_fruits_01.png")
plt.imshow(img0)
plt.sca(plt.subplot(3, 3, 2)) # 分成3行3列,并选择第2个位置
img1 = plt.imread("Data/color/citrus_fruits_05.png")
plt.imshow(img1)
plt.sca(plt.subplot(3, 3, 3)) # 分成3行3列,并选择第3个位置
img2 = plt.imread("Data/color/clamp_pile_04.png")
plt.imshow(img2)
plt.sca(plt.subplot(3, 3, 4)) # 分成3行3列,并选择第4个位置
img3 = plt.imread("Data/color/pills_test_03.png")
plt.imshow(img3)
plt.sca(plt.subplot(3, 3, 5)) # 分成3行3列,并选择第5个位置
img4 = plt.imread("Data/color/pizza_01.png")
plt.imshow(img4)
plt.sca(plt.subplot(3, 3, 6)) # 分成3行3列,并选择第6个位置
img5 = plt.imread("Data/color/yogurt_02.png")
plt.imshow(img5)
plt.sca(plt.subplot(3, 3, 8)) # 分成3行3列,并选择第8个位置,最后一个放中间
img6 = plt.imread("Data/color/yogurt_model_03_big.png")
plt.imshow(img6)
''' 第二个,放曲线图 '''
plt.figure(2) # 创建第2个图形
plt.xlabel("x")
plt.ylabel("f(x)")
x = [0.0, 10.0, 20.0, 30.0] # 返回一个有终点和起点的固定步长(0.1)的数列
y = [0.0, 110.0, 420.0, 930.0] # 返回一个有终点和起点的固定步长(0.1)的数列
plt.plot(x, y)
plt.text(15, 400, 'x²+x', fontsize=14)
''' 显示plt '''
plt.show() # 将plt显示出来
结果


 2560
2560


 被折叠的 条评论
为什么被折叠?
被折叠的 条评论
为什么被折叠?
 到【灌水乐园】发言


