


Disks
4.1 iostat
iostat(1) summarizes per-disk I/O statistics, providing metrics for workload characterization, utilization, and saturation.
The name “iostat” is short for “I/O statistics”, although it might have been better to call it “diskiostat” to reflect the type of I/O it reports.
root@ubuntu:~# iostat
Linux 5.4.0-59-generic (ubuntu) 	2021年01月06日 	_x86_64_	(2 CPU)

avg-cpu:  %user   %nice %system %iowait  %steal   %idle
           0.96    0.07    1.04    0.57    0.00   97.37

Device             tps    kB_read/s    kB_wrtn/s    kB_dscd/s    kB_read    kB_wrtn    kB_dscd
loop0             0.01         0.06         0.00         0.00        338          0          0
loop1             0.01         0.06         0.00         0.00        348          0          0
loop10            0.00         0.00         0.00         0.00          8          0          0
loop2             0.01         0.18         0.00         0.00       1063          0          0
loop3             0.01         0.18         0.00         0.00       1072          0          0
loop4             0.01         0.06         0.00         0.00        341          0          0
loop5             0.01         0.18         0.00         0.00       1058          0          0
loop6             0.01         0.06         0.00         0.00        342          0          0
loop7             0.01         0.06         0.00         0.00        351          0          0
loop8             0.01         0.06         0.00         0.00        336          0          0
loop9             1.78         1.83         0.00         0.00      10784          0          0
sda               7.13       174.03        41.48         0.00    1023155     243849          0
| %user | CPU运行在用户态的百分比 |
| %nice | CPU处在带NICE值的用户模式下的时间百分比 |
| %system | CPU运行在内核态的百分比 |
| %iowait | CPU等待输入输出完成时间的百分比 |
| %steal | 管理程序维护另一个虚拟处理器时,虚拟CPU的无意识等待时间百分比 |
| %idle | CPU空闲时间百分比 |
| tps | 该设备每秒的传输次数(IOPS) |
| kB_read/s | 每秒从设备(drive expressed)读取的数据量 |
| kB_wrtn/s | 每秒向设备(drive expressed)写入的数据量 |
| kB_dscd/s | 每秒设备丢弃的数据量 |
| kB_read | 读取的总数据量 |
| kB_wrtn | 写入的总数据量 |
| kB_dscd | 丢弃的总数据量 |
如果%iowait的值过高,表示硬盘存在I/O瓶颈。
如果%idle值高,表示CPU较空闲。
如果%idle值高但系统响应慢时,可能是CPU等待分配内存,应加大内存容量。
如果%idle值持续低于10,表明CPU处理能力相对较低,系统中最需要解决的资源是CPU。
4.2 PSI
io压力
# cat /proc/pressure/io
some avg10=63.11 avg60=32.18 avg300=8.62 total=667212021
full avg10=60.76 avg60=31.13 avg300=8.35 total=622722632
4.3 pidstat
The Linux pidstat(1) tool prints CPU usage by default and includes a -d option for disk I/O statistics.
root@ubuntu:~# pidstat -d 2
Linux 5.4.0-59-generic (ubuntu) 	2021年01月06日 	_x86_64_	(2 CPU)

16时44分08秒   UID       PID   kB_rd/s   kB_wr/s kB_ccwr/s iodelay  Command

16时44分10秒   UID       PID   kB_rd/s   kB_wr/s kB_ccwr/s iodelay  Command

16时44分12秒   UID       PID   kB_rd/s   kB_wr/s kB_ccwr/s iodelay  Command
16时44分14秒     0       353      0.00     70.00      0.00       0  systemd-journal

16时44分14秒   UID       PID   kB_rd/s   kB_wr/s kB_ccwr/s iodelay  Command
16时44分16秒     0       353      0.00     24.00      0.00       0  systemd-journal

16时44分16秒   UID       PID   kB_rd/s   kB_wr/s kB_ccwr/s iodelay  Command
16时44分18秒     0       313      0.00      2.00      0.00       0  jbd2/sda5-8
16时44分18秒     0       353      0.00      2.00      0.00       0  systemd-journal

16时44分18秒   UID       PID   kB_rd/s   kB_wr/s kB_ccwr/s iodelay  Command
16时44分20秒   104       762      0.00      2.00      0.00       0  rsyslogd

16时44分20秒   UID       PID   kB_rd/s   kB_wr/s kB_ccwr/s iodelay  Command

16时44分22秒   UID       PID   kB_rd/s   kB_wr/s kB_ccwr/s iodelay  Command
16时44分24秒     0       313      0.00      6.00      0.00       0  jbd2/sda5-8
16时44分24秒     0       353      0.00      2.00      0.00       0  systemd-journal
[...]
其中,kB_ccwr/s的含义是:
Number of kilobytes whose writing to disk has been cancelled by the task. This may occur when the task truncates some dirty pagecache. In this case, some IO which another task has been accounted for will not be happening.
4.4 perf
perf列出和block相关的事件
[root@localhost ~]# perf list 'block:*'

List of pre-defined events (to be used in -e):

  block:block_bio_backmerge                          [Tracepoint event]
  block:block_bio_bounce                             [Tracepoint event]
  block:block_bio_complete                           [Tracepoint event]
  block:block_bio_frontmerge                         [Tracepoint event]
  block:block_bio_queue                              [Tracepoint event]
  block:block_bio_remap                              [Tracepoint event]
  block:block_dirty_buffer                           [Tracepoint event]
  block:block_getrq                                  [Tracepoint event]
  block:block_plug                                   [Tracepoint event]
  block:block_rq_complete                            [Tracepoint event]
  block:block_rq_insert                              [Tracepoint event]
  block:block_rq_issue                               [Tracepoint event]
  block:block_rq_remap                               [Tracepoint event]
  block:block_rq_requeue                             [Tracepoint event]
  block:block_sleeprq                                [Tracepoint event]
  block:block_split                                  [Tracepoint event]
  block:block_touch_buffer                           [Tracepoint event]
  block:block_unplug                                 [Tracepoint event]


Metric Groups:
磁盘I/O延时
perf record -e block:block_rq_issue,block:block_rq_complete -a sleep 20
perf script --header > disk.txt
### 这样得出分析文件,但还需在手动计算,比如用awk等工具对文本进行处理
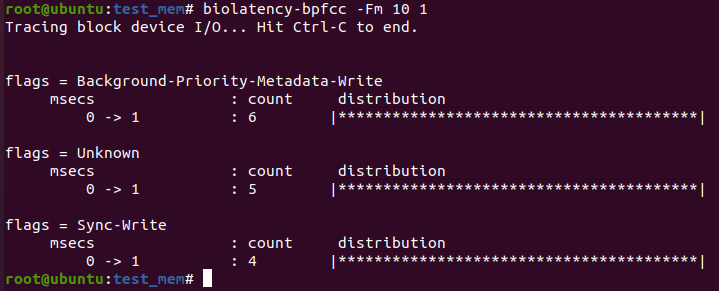
4.5 biolatency-bpfcc
这是直观的显示io latency的BCC工具。
usage: biolatency-bpfcc [-h] [-T] [-Q] [-m] [-D] [-F] [interval] [count]

Summarize block device I/O latency as a histogram

positional arguments:
  interval            output interval, in seconds
  count               number of outputs

optional arguments:
  -h, --help          show this help message and exit
  -T, --timestamp     include timestamp on output
  -Q, --queued        include OS queued time in I/O time
  -m, --milliseconds  millisecond histogram
  -D, --disks         print a histogram per disk device
  -F, --flags         print a histogram per set of I/O flags

examples:
    ./biolatency            # summarize block I/O latency as a histogram
    ./biolatency 1 10       # print 1 second summaries, 10 times
    ./biolatency -mT 1      # 1s summaries, milliseconds, and timestamps
    ./biolatency -Q         # include OS queued time in I/O time
    ./biolatency -D         # show each disk device separately
    ./biolatency -F         # show I/O flags separately
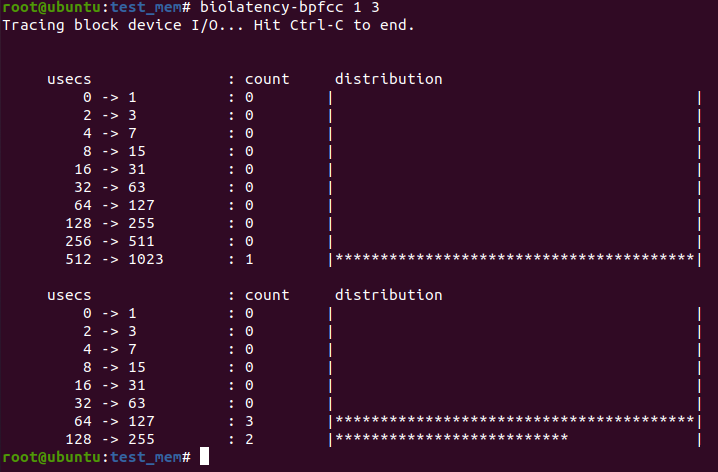
-F选项可以根据flags分别显示io latency,这个选项很实用
4.6 biosnoop-bpfcc
Trace all block device I/O and print a summary line per I/O
usage: biosnoop-bpfcc [-h] [-Q]

Trace block I/O

optional arguments:
  -h, --help   show this help message and exit
  -Q, --queue  include OS queued time

examples:
    ./biosnoop           # trace all block I/O
    ./biosnoop -Q        # include OS queued time
root@ubuntu:test_mem# biosnoop-bpfcc -Q
TIME(s)     COMM           PID    DISK    T SECTOR     BYTES  QUE(ms) LAT(ms)
0.000000    ?              0              R 0          8         0.00    0.57
2.017184    ?              0              R 0          8         0.00    1.44
3.168129    jbd2/sda5-8    313    sda     W 206940176  16384     0.00    0.18
3.168304    jbd2/sda5-8    313    sda     W 206940208  4096      0.00    0.13
4.031720    ?              0              R 0          8         0.00    0.31
[...]
4.7 biostack.bt
biostacks(8)14 is a bpftrace tool that traces the block I/O request time (from OS enqueue to device completion) with the I/O initialization stack trace.
root@ubuntu:test_mem# biostacks.bt
Attaching 5 probes...
cannot attach kprobe, probe entry may not exist
Warning: could not attach probe kprobe:blk_start_request, skipping.
Tracing block I/O with init stacks. Hit Ctrl-C to end.
^C


@usecs[
    blk_account_io_start+1
    generic_make_request+207
    submit_bio+72
    submit_bh_wbc+386
    submit_bh+19
    journal_submit_commit_record.part.0+475
    jbd2_journal_commit_transaction+4754
    kjournald2+182
    kthread+260
    ret_from_fork+53
]:
[4K, 8K)               1 |@@@@@@@@@@@@@@@@@@@@@@@@@@@@@@@@@@@@@@@@@@@@@@@@@@@@|

@usecs[
    blk_account_io_start+1
    blk_attempt_plug_merge+274
    blk_mq_make_request+863
    generic_make_request+207
    submit_bio+72
    submit_bh_wbc+386
    submit_bh+19
    jbd2_journal_commit_transaction+1484
    kjournald2+182
    kthread+260
    ret_from_fork+53
]:
[4K, 8K)               1 |@@@@@@@@@@@@@@@@@@@@@@@@@@@@@@@@@@@@@@@@@@@@@@@@@@@@|

[...]
4.8 blktrace
blktrace - generate traces of the i/o traffic on block devices.
[root@localhost ~]#  blktrace -d /dev/sdc1 -o - | blkparse -i -
  8,32   4        1     0.000000000 1385858  A   W 3470177952 + 8 <- (8,33) 3470175904
  8,33   4        2     0.000000992 1385858  Q   W 3470177952 + 8 [kworker/u113:3]
  8,33   4        3     0.000007305 1385858  G   W 3470177952 + 8 [kworker/u113:3]
  8,33   4        4     0.000008454 1385858  P   N [kworker/u113:3]
  8,32   4        5     0.000015076 1385858  A   W 9638099512 + 8 <- (8,33) 9638097464
  8,33   4        6     0.000015273 1385858  Q   W 9638099512 + 8 [kworker/u113:3]
  8,33   4        7     0.000016198 1385858  G   W 9638099512 + 8 [kworker/u113:3]
  8,32   4        8     0.000027067 1385858  A  WM 3036678400 + 8 <- (8,33) 3036676352
  8,33   4        9     0.000027267 1385858  Q  WM 3036678400 + 8 [kworker/u113:3]
  8,33   4       10     0.000028193 1385858  G  WM 3036678400 + 8 [kworker/u113:3]
  8,32   4       11     0.000033291 1385858  A   W 302800272 + 8 <- (8,33) 302798224
  8,33   4       12     0.000033485 1385858  Q   W 302800272 + 8 [kworker/u113:3]
  8,33   4       13     0.000034269 1385858  G   W 302800272 + 8 [kworker/u113:3]
  8,33   4       14     0.000035653 1385858  U   N [kworker/u113:3] 4
  8,33   4       15     0.000036376 1385858  I   W 3470177952 + 8 [kworker/u113:3]
  8,33   4       16     0.000036877 1385858  I   W 9638099512 + 8 [kworker/u113:3]
  8,33   4       17     0.000037129 1385858  I  WM 3036678400 + 8 [kworker/u113:3]
  8,33   4       18     0.000037273 1385858  I   W 302800272 + 8 [kworker/u113:3]
  8,33   4       19     0.000042762 1385858  D   W 3470177952 + 8 [kworker/u113:3]
  8,33   4       20     0.000050812 1385858  D   W 9638099512 + 8 [kworker/u113:3]
  8,33   4       21     0.000052794 1385858  D  WM 3036678400 + 8 [kworker/u113:3]
  8,33   4       22     0.000054746 1385858  D   W 302800272 + 8 [kworker/u113:3]
  8,33  12        1     0.000427923     0  C   W 302800272 + 8 [0]
  8,33  12        2     0.000438597     0  C  WM 3036678400 + 8 [0]
  8,33  12        3     0.000441113     0  C   W 3470177952 + 8 [0]
  8,33  12        4     0.000443239     0  C   W 9638099512 + 8 [0]
^CCPU4 (8,33):
 Reads Queued:           0,        0KiB  Writes Queued:           4,       16KiB
 Read Dispatches:        0,        0KiB  Write Dispatches:        4,       16KiB
 Reads Requeued:         0               Writes Requeued:         0
 Reads Completed:        0,        0KiB  Writes Completed:        0,        0KiB
 Read Merges:            0,        0KiB  Write Merges:            0,        0KiB
 Read depth:             0               Write depth:             4
 IO unplugs:             1               Timer unplugs:           0
CPU12 (8,33):
 Reads Queued:           0,        0KiB  Writes Queued:           0,        0KiB
 Read Dispatches:        0,        0KiB  Write Dispatches:        0,        0KiB
 Reads Requeued:         0               Writes Requeued:         0
 Reads Completed:        0,        0KiB  Writes Completed:        4,       16KiB
 Read Merges:            0,        0KiB  Write Merges:            0,        0KiB
 Read depth:             0               Write depth:             4
 IO unplugs:             0               Timer unplugs:           0

Total (8,33):
 Reads Queued:           0,        0KiB  Writes Queued:           4,       16KiB
 Read Dispatches:        0,        0KiB  Write Dispatches:        4,       16KiB
 Reads Requeued:         0               Writes Requeued:         0
 Reads Completed:        0,        0KiB  Writes Completed:        4,       16KiB
 Read Merges:            0,        0KiB  Write Merges:            0,        0KiB
 IO unplugs:             1               Timer unplugs:           0

Throughput (R/W): 0KiB/s / 0KiB/s
Events (8,33): 26 entries
Skips: 0 forward (0 -   0.0%)
4.9 bpftrace
#Count block I/O tracepoints events:
bpftrace -e 'tracepoint:block:* { @[probe] = count(); }'

#Summarize block I/O size as a histogram:
bpftrace -e 't:block:block_rq_issue { @bytes = hist(args->bytes); }'

#Count block I/O request user stack traces:
bpftrace -e 't:block:block_rq_issue { @[ustack] = count(); }'
bpftrace -e 't:block:block_rq_insert { @[ustack] = count(); }'

#Count block I/O type flags:
bpftrace -e 't:block:block_rq_issue { @[args->rwbs] = count(); }'

#Trace block I/O errors with device and I/O type:
bpftrace -e 't:block:block_rq_complete /args->error/ { printf("dev %d type %s error %d\n", args->dev, args->rwbs, args->error); }'

#Count SCSI opcodes:
bpftrace -e 't:scsi:scsi_dispatch_cmd_start { @opcode[args->opcode] = count(); }'

#Count SCSI result codes:
bpftrace -e 't:scsi:scsi_dispatch_cmd_done { @result[args->result] = count(); }'

#Count SCSI driver functions:
bpftrace -e 'kprobe:scsi* { @[func] = count(); }'


 556
556


 被折叠的 条评论
为什么被折叠?
被折叠的 条评论
为什么被折叠?
 到【灌水乐园】发言


