


问题:将一组(x,y)值分类为下列两类函数之一:
2x + 1 = y 第1类
7x + 1 = y 第2类
# -*- coding: utf-8 -*-
# easy_linear_learning.py
import numpy as np
import pylab as pl
b = 1
a = 0.3
x = np.array([[1,1,3,],[1,2,3],[1,1,8],[1,2,15],[1,3,7],[1,4,29]])
d = np.array([1,1,-1,-1,1,-1])
w = np.array([b,0,0])
def sgn(v):
if v>0:
return 1
else:
return 0
def comy(myw,myx):
return sgn(np.dot(myw.T,myx))
def neww(oldw,myd,myx,a):
return oldw + a*(myd - comy(oldw,myx))*myx
i = 0
for xn in x:
w = neww(w,d[i],xn,a)
i += 1
myx = x[:,1]
myy = x[:,2]
pl.subplot(111)
x_max = np.max(myx) + 15
x_min = np.min(myx) - 5
y_max = np.max(myy) + 50
y_min = np.min(myy) - 5
pl.xlabel(u"x")
pl.xlim(x_min,x_max)
pl.ylabel(u"y")
pl.ylim(y_min,y_max)
for i in xrange(0,len(d)):
if d[i]>0:
pl.plot(myx[i],myy[i],'r*')
else:
pl.plot(myx[i],myy[i],'ro')
#Draw the test points
test = np.array([b,9,19])
if comy(w,test)>0:
pl.plot(test[1],test[2],'b.')
else:
pl.plot(test[1],test[2],'bx')
test = np.array([b,9,64])
if comy(w,test)>0:
pl.plot(test[1],test[2],'b.')
else:
pl.plot(test[1],test[2],'bx')
test = np.array([b,9,16])
if comy(w,test)>0:
pl.plot(test[1],test[2],'b.')
else:
pl.plot(test[1],test[2],'bx')
test = np.array([b,9,60])
if comy(w,test)>0:
pl.plot(test[1],test[2],'b.')
else:
pl.plot(test[1],test[2],'bx')
testx = np.array(range(0,20))
testy = testx*2 + 1.68
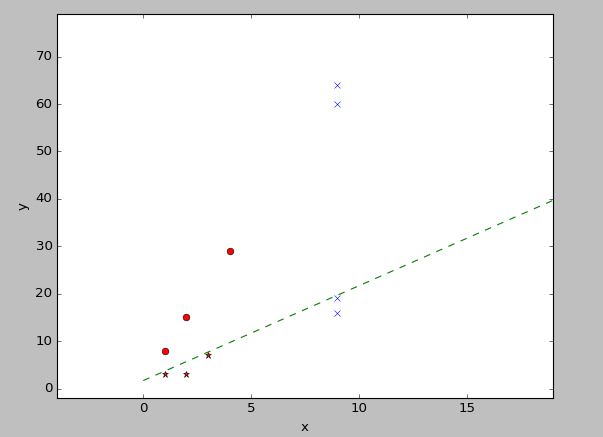
pl.plot(testx,testy,'g--')
pl.show()分类效果如下:


 414
414


 被折叠的 条评论
为什么被折叠?
被折叠的 条评论
为什么被折叠?
 到【灌水乐园】发言


