


概述
一个跟踪范围涵盖了用户空间(App/Framewrok/native),内核空间(Kernel),设备厂商私有服务(Vendor)的系统级别跟踪工具。它不仅集成了内核ftrace的event-tracepoint静态跟踪能力,还集成了ftrace的function_graph动态跟踪能力,并支撑着perfetto,systrace等性能分析工具的底层跟踪能力
关键使用
输入命令atrace --help,查看帮助文档
walleye:/ # atrace --help
usage: atrace [options] [categories...]
options include:
 -a appname   enable app-level tracing for a comma separated list of cmdlines; * is a wildcard matching any process
 -b N      use a trace buffer size of N KB
 -c       trace into a circular buffer
 -f filename   use the categories written in a file as space-separated
          values in a line
 -k fname,...  trace the listed kernel functions
 -n       ignore signals
 -s N      sleep for N seconds before tracing [default 0]
 -t N      trace for N seconds [default 5]
 -z       compress the trace dump
 --async_start  start circular trace and return immediately
 --async_dump  dump the current contents of circular trace buffer
 --async_stop  stop tracing and dump the current contents of circular
          trace buffer
 --stream    stream trace to stdout as it enters the trace buffer
          Note: this can take significant CPU time, and is best
          used for measuring things that are not affected by
          CPU performance, like pagecache usage.
 --list_categories
         list the available tracing categories
 -o filename   write the trace to the specified file instead
          of stdout.
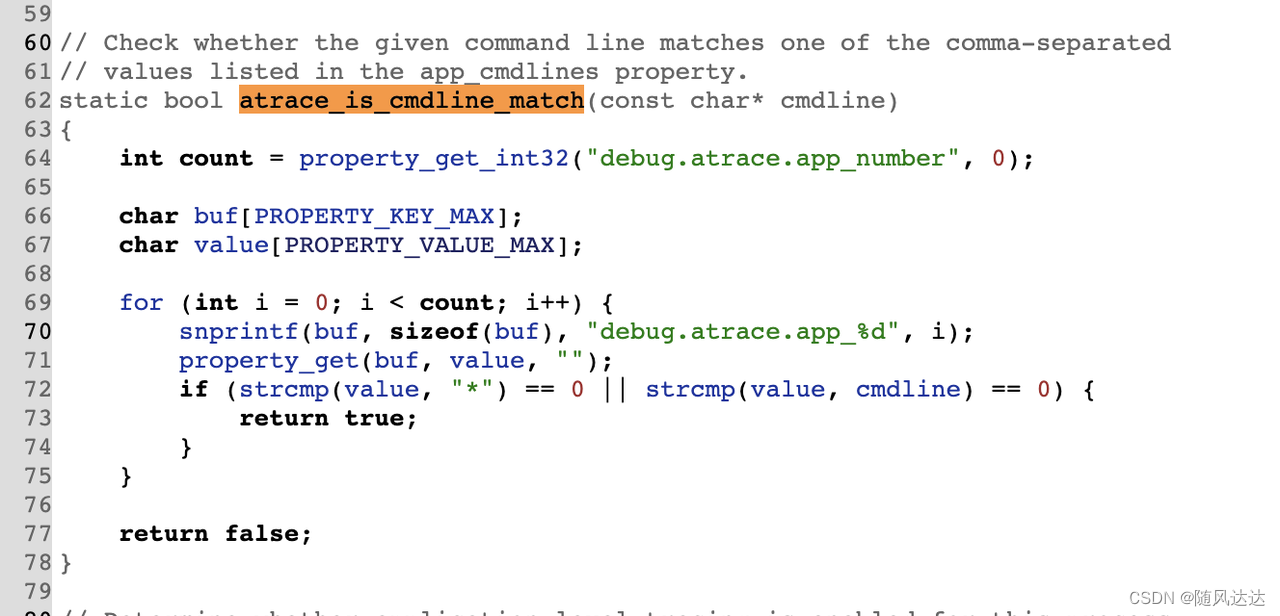
-a appname
- 它使用系统属性debug.atrace.app_%d表明有哪些app需要跟踪,使用debug.atrace.app_number属性表明跟踪的app数量
- 如果需要设置跟踪多个app,可以用逗号进行间隔。如果需要设置跟踪所有app则设置为*
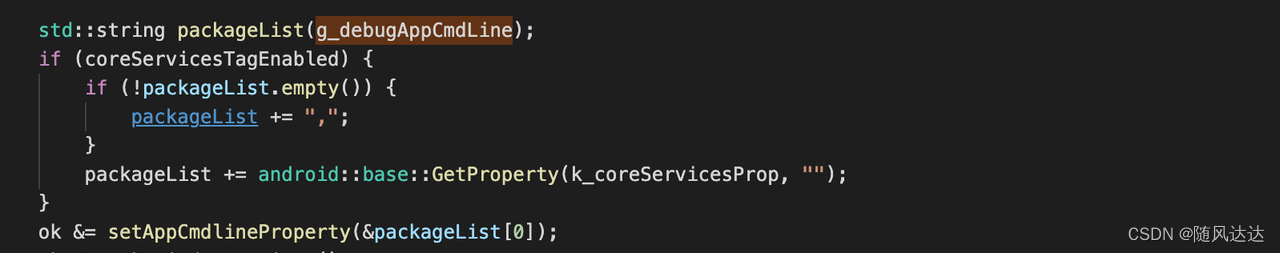
- 另外一种跟踪app等价的方式是,首先设置ro.atrace.core.services属性为app的名称,然后atrace启动的时候,添加core_services的命令行参数

-b buffer size
- 它的单位是k,默认启动设置为2M。
- 文件节点是跟踪目录下的buffer_size_kb,表示的是每一个cpu独立的内存大小,总的占用内存大小等于buffer size乘以cpu个数,可通过buffer_total_size_kb文件节点获取。
- 值得注意的是这些跟着cpu的内存是在内核分配的,而且是一次性占用,如果此时用free查看可知,atrace启动的时候,free的内存占用值会一次性降低。
-c
- 它采集使用的是内核的ring buffer机制,内核ring buffer有两个参数,一种是满了就停止,一种是循环写入,新的内容会覆盖旧的内容,默认是采用循环写入的方式。
- 值得注意的是,同步启动的时候atrace使用满了就停止的模式,而异步启动的时候即使不使用-c选项,也会开启循环写入的模式
-k
它使用ftrace的function_graph动态跟踪能力,需要内核打开编译选项进行支持
-s/-t
它们主要的区别是适用于不同的业务场景。-s是先延时一段时间什么都不做才开始采集,而-t是先将采集开启,等待一段时间后结束。
–async_start/–async_dump/–async_stop
atrace的异步启动方式,适合于异步启动的业务场景
–stream
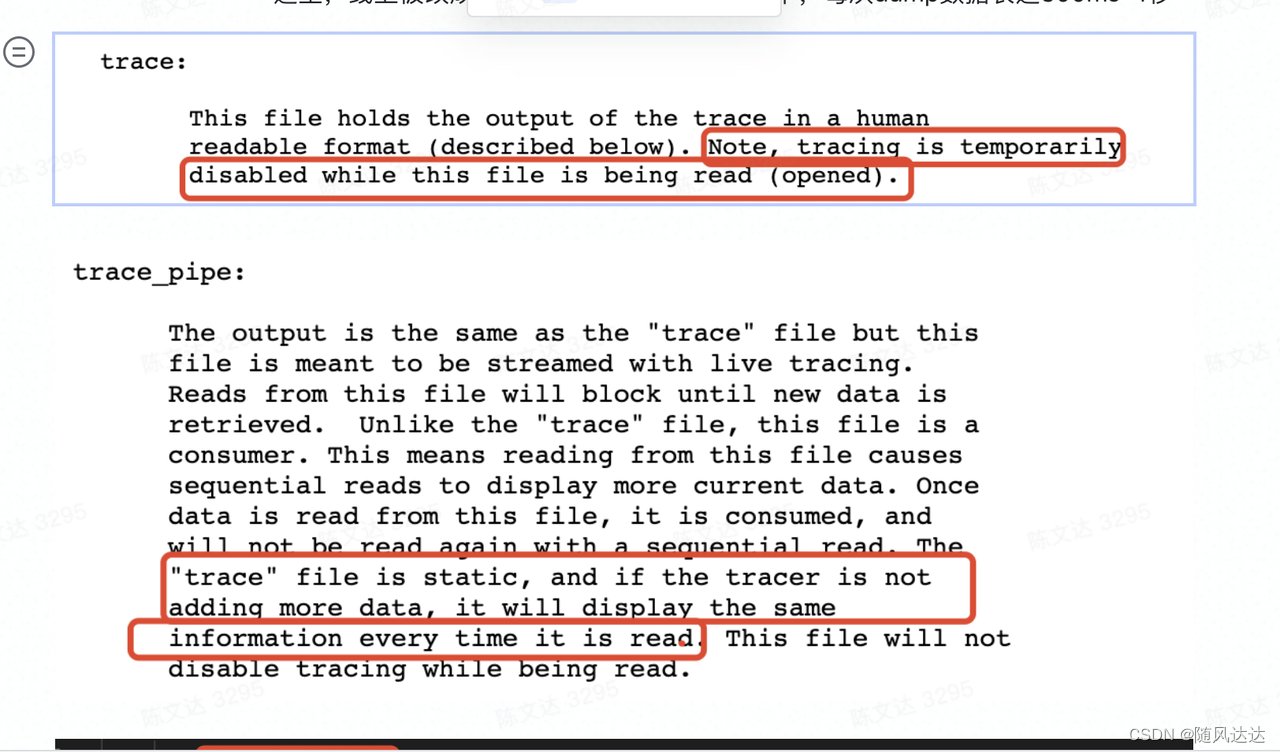
- 它是流模式,跟正常的同步异步启动的区别,一个是读取的节点不一样,同步/异步启动读取的是trace文件节点,而流模式读取的是trace_pipe文件节点。
- trace文件节点是静态的,每次读取需要暂停生产者,并且读取完需要清空trace,可以支持多个进程读取完再统一清空。而trace_pipe文件节点是消费型的,进程读取之后就消费掉了,但是优势是不需要暂停生产者,且atrace默认将获得的数据打印到控制台更方便调试。
- 一些基于atrace能力的采集工具例如perfetto就重点优化了这里,通过读取每个cpu的trace_pipe原始数据实现长时间采集的能力。
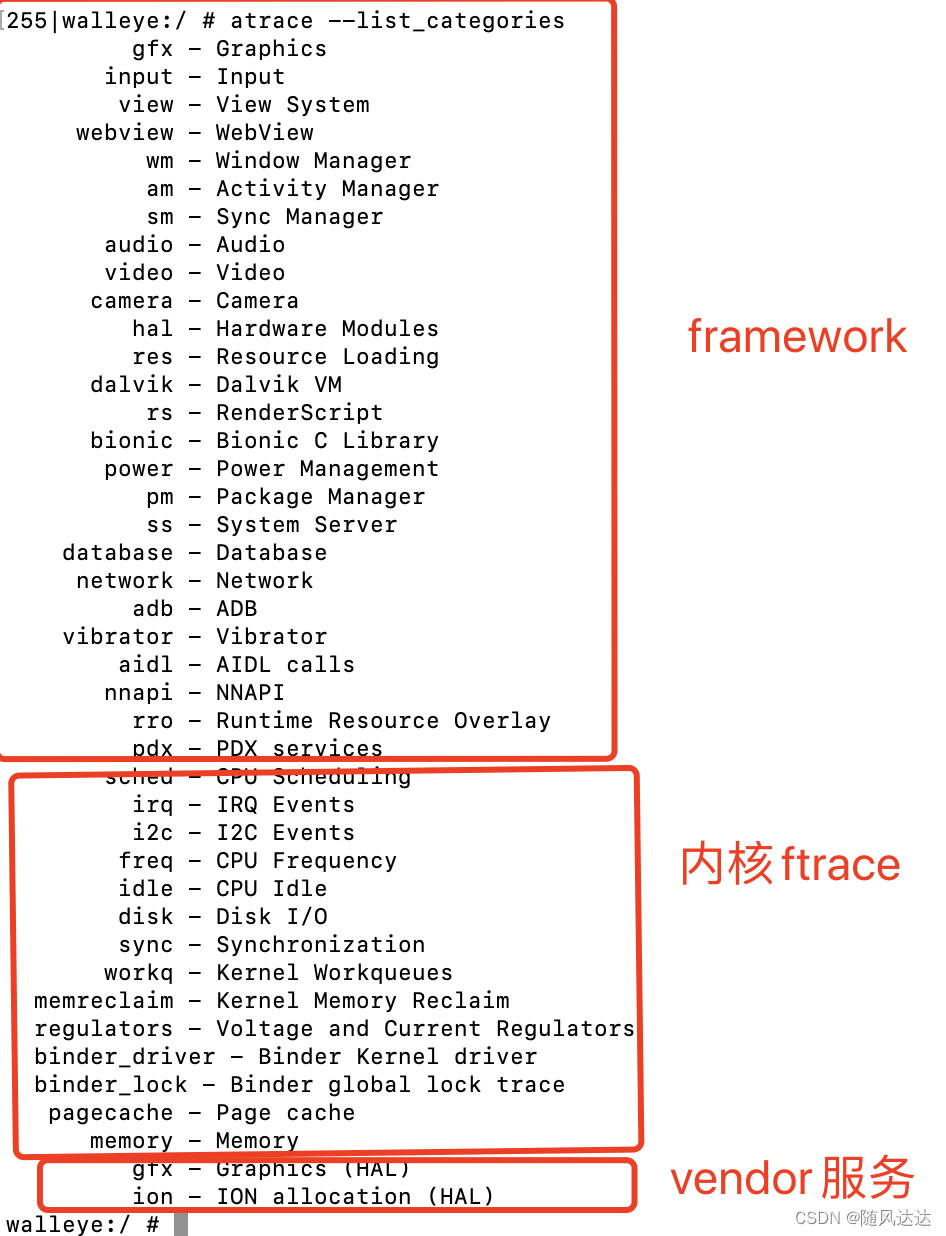
–list_categories
它能够列举出用户空间,内核空间,vendor服务支持的所有种类,将各种各样的跟踪能力抽象为种类的概念
系统架构
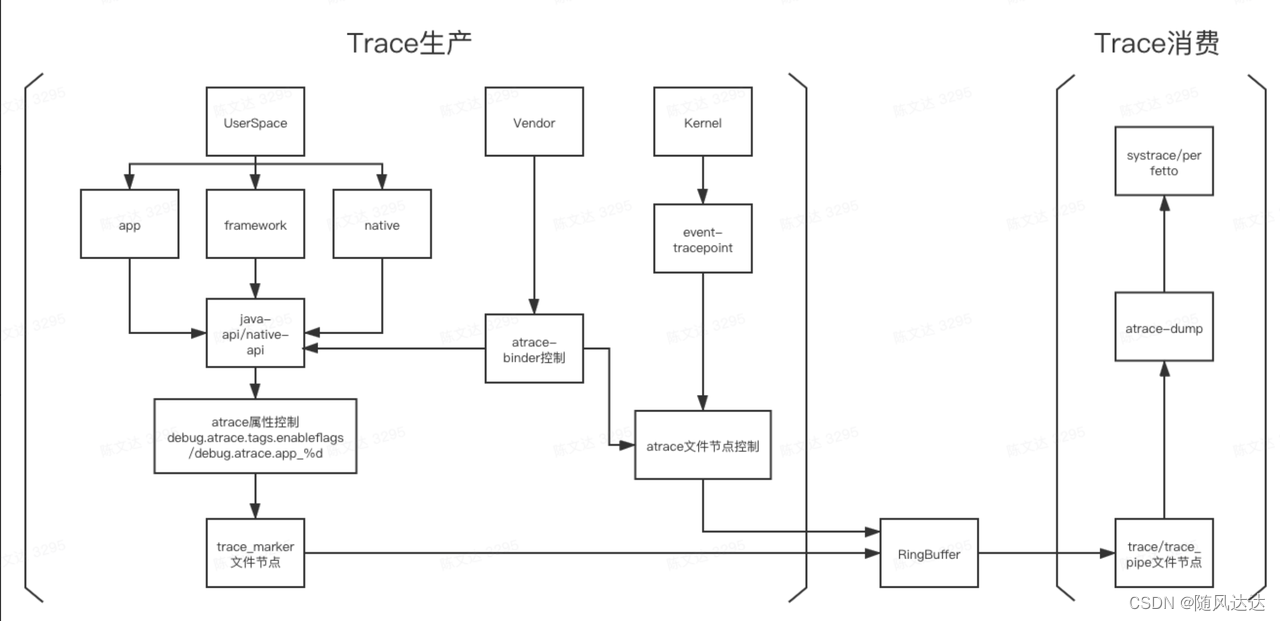
- atrace通过控制安卓属性,以及sysfile文件节点,将静态打点以及动态跟踪的能力抽象成‘种类’的概念来统一管理,从层级上来看,则抽象出了UserspaceTracing,KernelTracing, VendorTracing三种层级。
- UserspaceTracing,采集数据中带B,E,S,F代表的就是应用空间同步/异步api的打点,在systrace/perfetto中表现为slice,而带C的则表示为counter,具体的格式除了开头的由内核写入的pid,tgid, 进程名字等信息外,均由每个线程每个函数自己定义,并在ftrace的function中统一表现为trace_marker,具体的应用层打点api如下
App-api:
    beginAsyncSection(String methodName, int cookie)
    beginSection(String sectionName)
    endAsyncSection(String methodName, int cookie)
    endSection()
    setCounter(String counterName, long counterValue)
framework-api:
    atrace_begin(ATRACE_TAG, name)
    atrace_end(ATRACE_TAG)
native-api:
    #define ATRACE_BEGIN(name) atrace_begin(ATRACE_TAG, name)
    #define ATRACE_END() atrace_end(ATRACE_TAG)
- KernelTracing则利用埋入内核各个子系统的event-tracepoint来进行控制,事件相关的事件格式可以从事件节点的format获取, 在event目录下也可以查看每个子系统支持event-tracepoint的情况,atrace源代码中带有REQ的路径是必须能够具备写入权限的节点,是一种内核种类能够被使能最基本最关键的文件节点
- VendorTracing通过三个binder接口控制hal服务预先注册好的方法,触发vendor角度的跟踪
listCategories() generates (vec<TracingCategory> categories)
enableCategories() generates (vec<string> categories)  (Status status)
disableAllCategories() generates (Status status)
- 根据内核版本区分不同的路径为/sys/kernel/debug/tracing 或者 /sys/kernel/tracing
- 值得注意的是,atrace开始采集之后会丢失很少一部分数据因为每个cpu的追踪使能是独立的,如果一个任务从一个cpu迁移到另外一个cpu执行,trace有可能会出现begin和end不匹配,所以atrace启动之后会立刻清空trace这个文件节点
- trace_event_clock_sync: parent_ts 是作为systrace等网页解析的时间起点,如果没有这一行的话,就会采用第一个事件的时间作为起点
- Atarce由于采集实现,最大的问题是不支持长采集(长时间采集),后续基于atrace能力的采集框架例如perfetto重新实现了这一套采集,通过读取每个cpu的trace_pipe_raw,在不暂停采集数据生产者的情况下,通过线程异步和缓存实现了长采集
Ftrace补充
Ftrace文件能力说明,路径为/sys/kernel/tracing/或者/sys/kernel/debug/tracing/(根据内核版本区分)
walleye:/sys/kernel/debug/tracing # ls
README      buffer_total_size_kb instances saved_cmdlines
set_event_pid trace_options  tracing_thresh available_events
current_tracer options  saved_cmdlines_size trace     trace_pipe
available_tracers events  per_cpu    saved_tgids     trace_clock
tracing_cpumask  buffer_size_kb  free_buffer     printk_formats set_event
trace_marker tracing_on
# echo 0 > tracing_on : quick way to disable tracing
# echo 1 > tracing_on : quick way to re-enable tracing

 Important files:
 trace                        - The static contents of the buffer
                         To clear the buffer write into this file: echo > trace
 trace_pipe                - A consuming read to see the contents of the buffer
 current_tracer        - function and latency tracers
 available_tracers        - list of configured tracers for current_tracer
 buffer_size_kb        - view and modify size of per cpu buffer
 buffer_total_size_kb - view total size of all cpu buffers

 trace_clock                -change the clock used to order events
    local:  Per cpu clock but may not be synced across CPUs
   global:  Synced across CPUs but slows tracing down.
   counter:  Not a clock, but just an increment
   uptime:  Jiffy counter from time of boot
    perf:  Same clock that perf events use

 trace_marker                - Writes into this file writes into the kernel buffer
 tracing_cpumask        - Limit which CPUs to trace
 instances                - Make sub-buffers with: mkdir instances/foo
                         Remove sub-buffer with rmdir
 trace_options                - Set format or modify how tracing happens
                         Disable an option by adding a suffix 'no' to the
                         option name
 saved_cmdlines_size        - echo command number in here to store comm-pid list
 events/                - Directory containing all trace event subsystems:
   enable                - Write 0/1 to enable/disable tracing of all events
 events/<system>/        - Directory containing all trace events for <system>:
   enable                - Write 0/1 to enable/disable tracing of all <system>
                         events
   filter                - If set, only events passing filter are traced
 events/<system>/<event>/        - Directory containing control files for
                         <event>:
   enable                - Write 0/1 to enable/disable tracing of <event>
   filter                - If set, only events passing filter are traced
   trigger                - If set, a command to perform when event is hit
          Format: <trigger>[:count][if <filter>]
          trigger: traceon, traceoff
              enable_event:<system>:<event>
              disable_event:<system>:<event>
                  stacktrace
          example: echo traceoff > events/block/block_unplug/trigger
              echo traceoff:3 > events/block/block_unplug/trigger
              echo 'enable_event:kmem:kmalloc:3 if nr_rq > 1' > \
                 events/block/block_unplug/trigger
          The first disables tracing every time block_unplug is hit.
          The second disables tracing the first 3 times block_unplug is hit.
          The third enables the kmalloc event the first 3 times block_unplug
           is hit and has value of greater than 1 for the 'nr_rq' event field.
          Like function triggers, the counter is only decremented if it
          enabled or disabled tracing.
          To remove a trigger without a count:
           echo '!<trigger> > <system>/<event>/trigger
          To remove a trigger with a count:
           echo '!<trigger>:0 > <system>/<event>/trigger
          Filters can be ignored when removing a trigger.


 1万+
1万+

 被折叠的 条评论
为什么被折叠?
被折叠的 条评论
为什么被折叠?
 到【灌水乐园】发言


