


坐标轴区间
>>> import matplotlib.pyplot as plt
>>> x=np.arange(-5,5,0.01)
>>> y=x**3
>>> plt.axis([-6,6,-10,10])
[-6, 6, -10, 10]
>>> plt.plot(x,y)
[<matplotlib.lines.Line2D object at 0x01A86EB0>]
>>> plt.show()
如果给如的数据超过边界值系统自动调整
另外一种方法
xlim( (xmin, xmax) )
#
设置坐标轴的最大最小区间
xlim( xmin, xmax )
#
设置坐标轴的最大最小区间
ylim( (ymin, ymax) )
#
设置坐标轴的最大最小区间
ylim( ymin, ymax )
#
设置坐标轴的最大最小区间
设置网格线
plt.grid(True)
plt.show()
即可
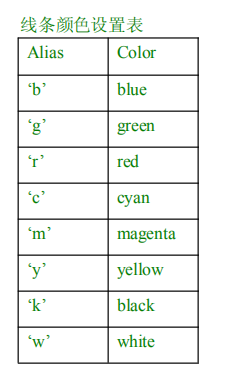
颜色


 1万+
1万+


 被折叠的 条评论
为什么被折叠?
被折叠的 条评论
为什么被折叠?
 到【灌水乐园】发言


