


 本文档展示了如何安装CUDA、CuDNN、PyTorch和Captum库,然后构建一个简单的图像分类网络。通过LRP(Layer-wise Relevance Propagation)方法,对网络的预测进行解释,并使用Captum库进行可视化,理解模型决策过程。
安装
- 安装cuda、cudnn,使用conda安装比较方便
- 安装pytorch
- 安装captum
pip install captum
LRP
参考:https://captum.ai/api/lrp.html
- 构建简单的图像分类网络
import torch
import torch.nn as nn
import torch.nn.functional as F
import torchvision.transforms as transforms
from captum.attr import LRP
from captum.attr import visualization as viz

class ImageClassifier(nn.Module):
    def __init__(self):
        super().__init__()
        # 第一层(卷积层)
        # 输入频道3, 输出频道6, 卷积3x3
        self.conv1 = nn.Conv2d(3, 6, 3)
        # 第二层(卷积层)
        # 输入频道6, 输出频道16, 卷积3x3
        self.conv2 = nn.Conv2d(6, 16, 3)
        # 第三层(全连接层)
        # 输入维度16x28x28=12544,输出维度 512
        self.fc1 = nn.Linear(16 * 28 * 28, 512)
        # 第四层(全连接层)
        # 输入维度512, 输出维度64
        self.fc2 = nn.Linear(512, 64)
        # 第五层(全连接层)
        # 输入维度64, 输出维度10
        self.fc3 = nn.Linear(64, 10)

    def forward(self, x):
        # 数据先经过第一层卷积层
        x = self.conv1(x)
        # 经过激活函数
        x = F.relu(x)

        # 数据经过第二层卷积层
        x = self.conv2(x)
        # 经过激活函数
        x = F.relu(x)

        # 调整数据维度,‘-1’表示自动计算维度
        x = x.view(-1, 16 * 28 * 28)
        # 数据经过第三层全连接层
        x = self.fc1(x)
        # 数据经过激活函数
        x = F.relu(x)

        # 数据经过第四层全连接层
        x = self.fc2(x)
        # 数据经过激活函数
        x = F.relu(x)

        # 数据经过第五层全连接层,输出结果
        x = self.fc3(x)

        return x
- 对ImageClassifier进行解析
net = ImageClassifier()
lrp = LRP(net)
img = cv2.imread('data/'+'0'+'.jpg')
transf = transforms.ToTensor()
img_tensor_1 = transf(img)
img = cv2.imread('data/'+'1'+'.jpg')
transf = transforms.ToTensor()  #将图片转换为tensor
img_tensor_2 = transf(img)
input_tensor = torch.stack((img_tensor_1, img_tensor_2),0) #将两个3*32*32拼接成2*3*32*32的数组
# Attribution size matches input size: 3x3x32x32(batch*通道数*宽*高)
attribution = lrp.attribute(input_tensor, target=5)  #目标类别是5
- 对结果进行可视化。由于是对一个batch进行解释的,所以要将返回的结果进行分割。
attri_img1, attri_img2 = attribution.split(1, 0) #将一个batch的tensor分割为两张图的tensor
attri_img1 = attri_img1.reshape(3,32,32) #去掉第一个维度
attri_img2 = attri_img2.reshape(3,32,32) #去掉第一个维度
print(attri_img1.size())
print(attri_img2.size())
default_cmap = LinearSegmentedColormap.from_list('custom blue',
                                                 [(0, '#ffffff'),
                                                  (0.25, '#000000'),
                                                  (1, '#000000')], N=256)
#可视化
_ = viz.visualize_image_attr(np.transpose(img_tensor_1.squeeze().cpu().detach().numpy(),(1,2,0)),
                             np.transpose(attri_img1.squeeze().cpu().detach().numpy(),(1,2,0)),
                             method='heat_map',
                             cmap=default_cmap,
                             show_colorbar=True,
                             sign='positive',
                             outlier_perc=1)
_ = viz.visualize_image_attr(np.transpose(img_tensor_2.squeeze().cpu().detach().numpy(),(1,2,0)),
                             np.transpose(attri_img2.squeeze().cpu().detach().numpy(),(1,2,0)),
                             method='heat_map',
                             cmap=default_cmap,
                             show_colorbar=True,
                             sign='positive',
                             outlier_perc=1)
原图
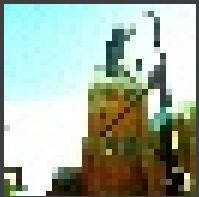

解释图
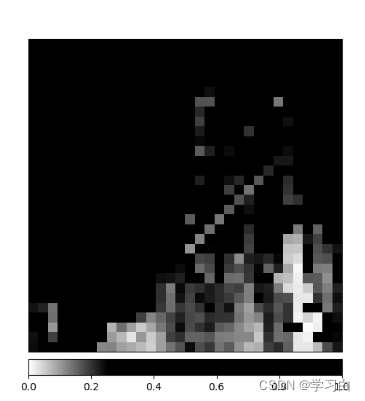
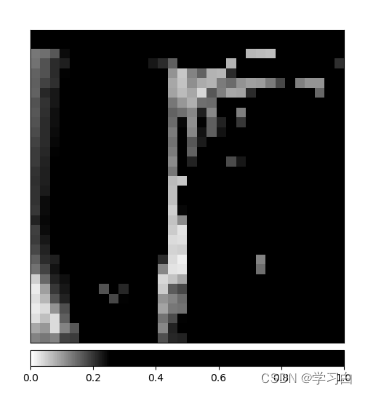
后续继续更新解释图和原图中的对应关系,欢迎关注


 1万+
1万+

 被折叠的 条评论
为什么被折叠?
被折叠的 条评论
为什么被折叠?
 到【灌水乐园】发言


