


 本文基于2024年美国大学生数学建模竞赛C题,探讨网球选手在比赛特定时间的表现力和动量。通过分析得分情况、制胜分、非受迫性失误等因素,建立模型评估动量对比赛影响。相关系数显示动量与得分差异的关系不显著,提出比赛流程变化模型并应用到新数据中。
这题挺有意思,没具体看比赛情况,打过比赛的人应该都知道险胜局(第二局、第五局逆转局)最影响心态的,导致第3、5局输了
模型结果需要证明这样的现象
赛题目的
赛题目的:分析网球球员的表现
问题一.球员在比赛特定时间表现力
问题分析
- excel数据:每个时间段有16场比赛,同一组有5个时间段的5场比赛
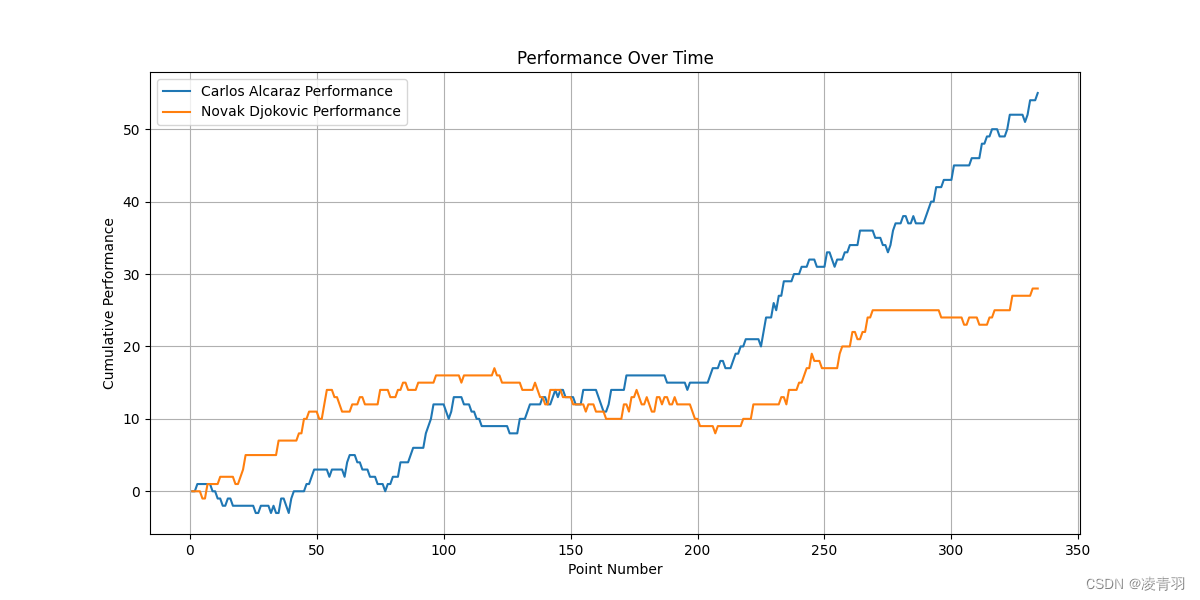
为了建立球员在比赛特定时间表现力的模型,我们需要根据提供的数据选择一些关键因素来评估球员表现。我们可以选择如下几个因素:
- 得分情况(p1_score, p2_score)
- 得分胜者(point_victor)
- 制胜分(p1_winner, p2_winner)
- 非受迫性失误(p1_unf_err, p2_unf_err)
- 发球得分(p1_ace, p2_ace)
- 上网得分(p1_net_pt_won, p2_net_pt_won)、
- 破发点和破发成功(p1_break_pt, p2_break_pt, p1_break_pt_won, p2_break_pt_won)等。
问题解答
import pandas as pd
import matplotlib.pyplot as plt
import numpy as np
# 读取数据
df = pd.read_csv('Problem_C_Wimbledon_featured_matches.csv')
# # 筛选以 "2023-wimbledon-13" 开头的 match_id
# df_filtered = df[df['match_id'].str.startswith('2023-wimbledon-13')]
# # 获取唯一的 match_id 并转换为列表
# match_ids = df_filtered['match_id'].unique().tolist()
# for match_id in match_ids:
for match_id in ["2023-wimbledon-1301", "2023-wimbledon-1401", "2023-wimbledon-1501", "2023-wimbledon-1601", "2023-wimbledon-1701"]:
# 选择特定的比赛
df_match = df[df['match_id'] == match_id]
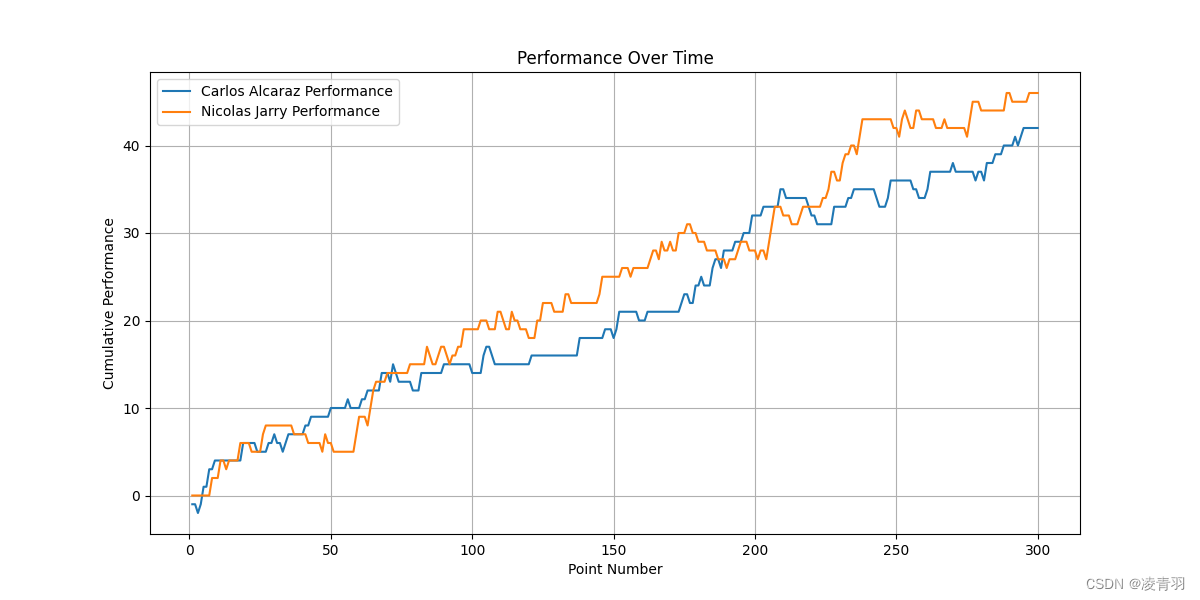
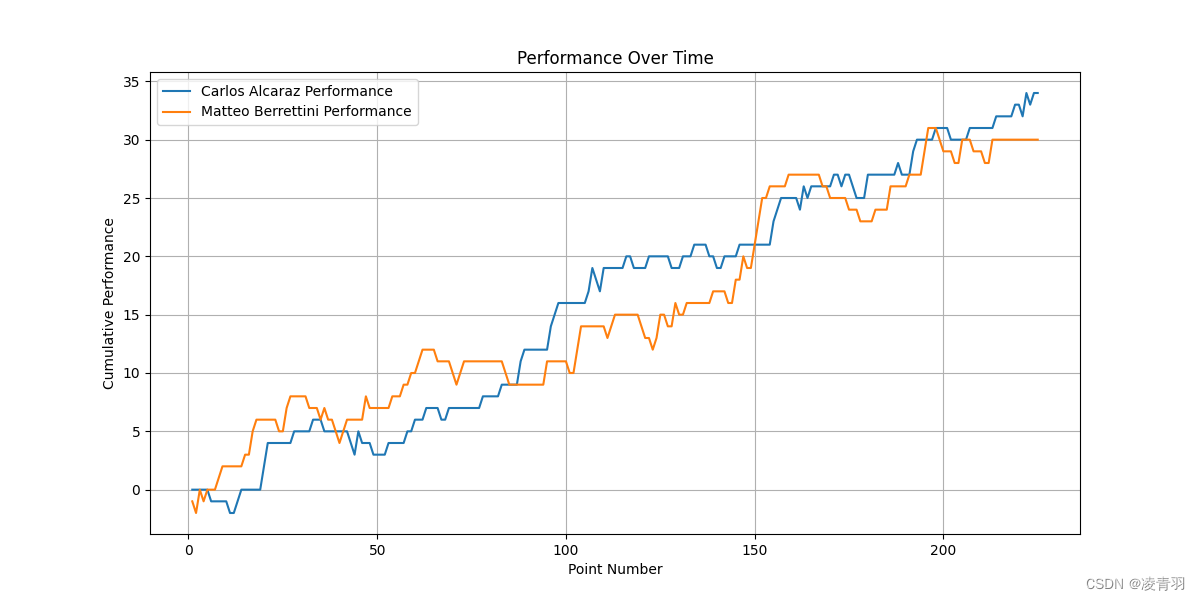
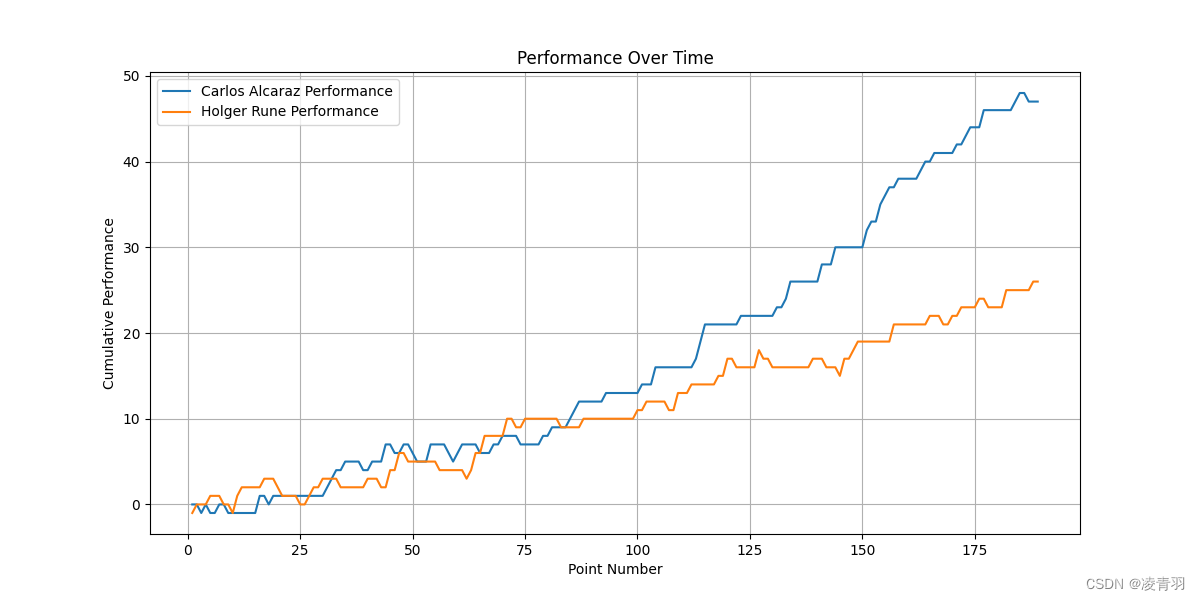
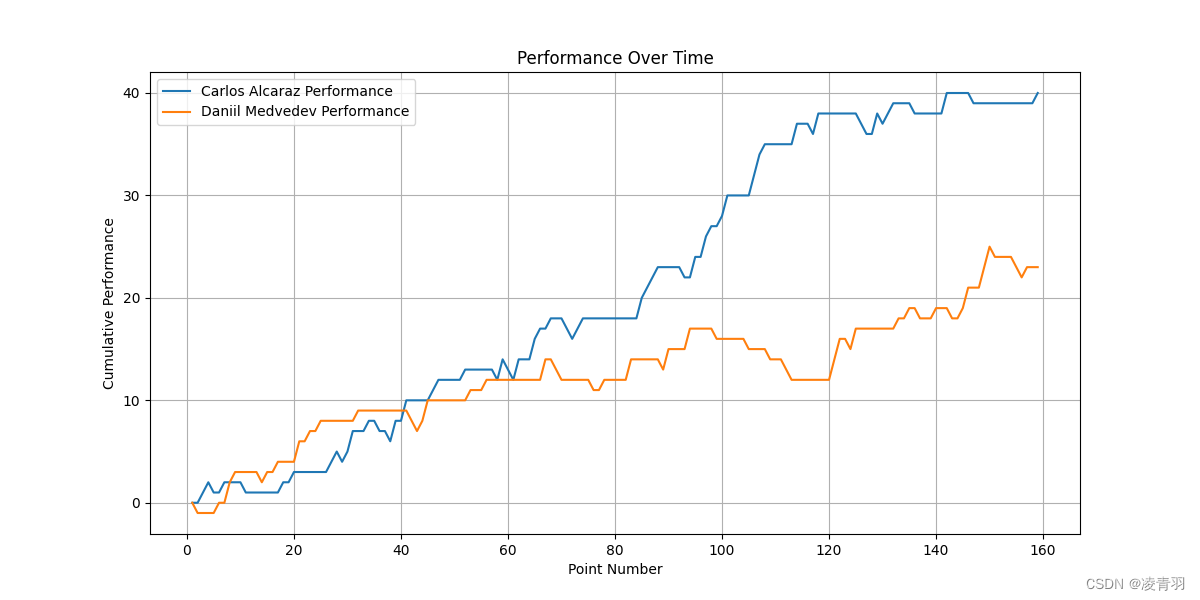
# 计算每个球员的表现力
df_match['p1_performance'] = df_match['p1_ace'] + df_match['p1_winner'] - df_match['p1_unf_err'] + df_match['p1_net_pt_won']
df_match['p2_performance'] = df_match['p2_ace'] + df_match['p2_winner'] - df_match['p2_unf_err'] + df_match['p2_net_pt_won']
# 累计表现力
df_match['p1_performance_cum'] = df_match['p1_performance'].cumsum()
df_match['p2_performance_cum'] = df_match['p2_performance'].cumsum()
# 绘制球员表现力变化趋势图
plt.figure(figsize=(12, 6))
plt.plot(df_match['point_no'], df_match['p1_performance_cum'], label=df_match['player1'].iloc[0] + ' Performance')
plt.plot(df_match['point_no'], df_match['p2_performance_cum'], label=df_match['player2'].iloc[0] + ' Performance')
# 设置图表标题和标签
plt.title('Performance Over Time')
plt.xlabel('Point Number')
plt.ylabel('Cumulative Performance')
plt.legend()
plt.grid(True)
# 保存球员表现力变化趋势图
plt.savefig('performance_over_time_{}.png'.format(match_id))
# 绘制比赛得分情况图
plt.figure(figsize=(12, 6))
plt.plot(df_match['point_no'], df_match['p1_points_won'].cumsum(), label=df_match['player1'].iloc[0] + ' Points Won')
plt.plot(df_match['point_no'], df_match['p2_points_won'].cumsum(), label=df_match['player2'].iloc[0] + ' Points Won')
# 设置图表标题和标签
plt.title('Points Won Over Time')
plt.xlabel('Point Number')
plt.ylabel('Cumulative Points Won')
plt.legend()
plt.grid(True)
# 保存比赛得分情况图
plt.savefig('points_won_over_time_{}.png'.format(match_id))
plt.close()
-
1301
-
1401
-
1501
-
1601
-
1701
问题二.球员"动量"
问题分析
为了评估这位网球教练的说法,我们可以使用前面提到的累积表现力和得分情况来分析比赛中的动量。如果动量在比赛中确实起作用,那么我们应该能够看到球员表现力的提升通常与比赛状态的转变相关联。换句话说,我们可能会看到一系列得分之后会有明显的表现力提升,这表明球员可能因为动量的提升而打得更好。
我们可以通过以下步骤来建立模型并进行评估:
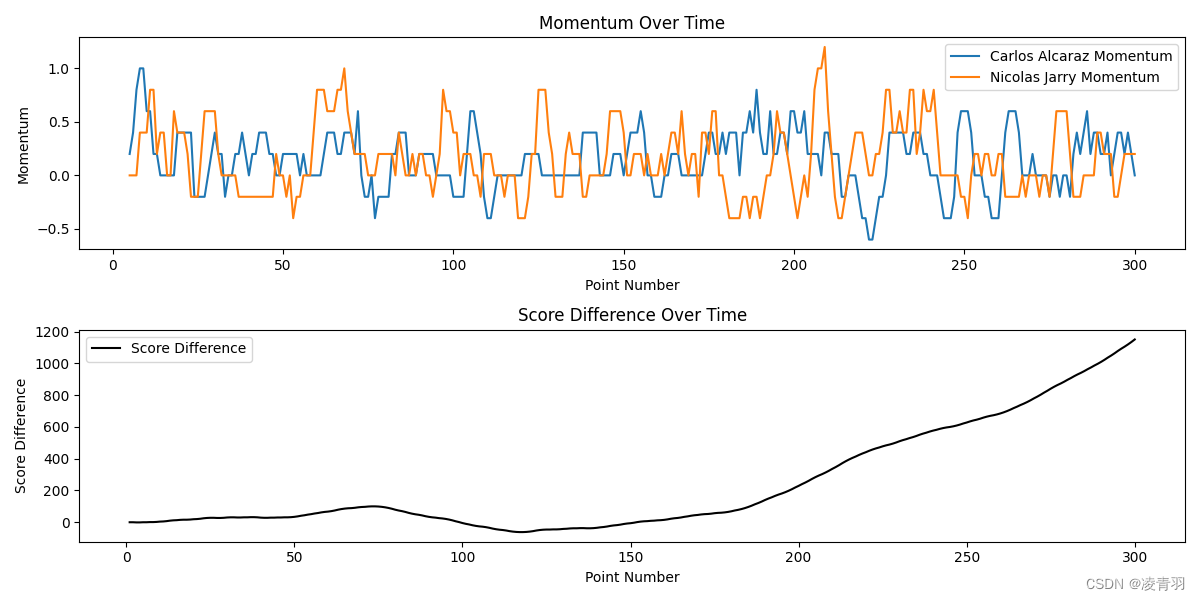
- 定义“动量”:我们可以将动量定义为一定时间内表现力的变化量,或者连续得分的情况。
- 确定指标:我们可以使用滑动窗口来计算动量的变化,并观察得分变化与表现力变化的相关性。
- 模型建立:我们可以使用时间序列分析或其他统计方法来分析得分情况与表现力之间的关系。
- 模型评估:我们可以通过计算得分与表现力变化量的相关系数来评估动量的相关性。
问题解答
import pandas as pd
import matplotlib.pyplot as plt
import numpy as np
# 读取数据
df = pd.read_csv('../Problem_C_Wimbledon_featured_matches.csv')
for match_id in ["2023-wimbledon-1316", "2023-wimbledon-1408", "2023-wimbledon-1501", "2023-wimbledon-1601", "2023-wimbledon-1701"]:
df_match = df[df['match_id'] == match_id]
# 提取球员姓名
player1_name = df_match['player1'].iloc[0]
player2_name = df_match['player2'].iloc[0]
# 计算每个球员的表现力
df_match['p1_performance'] = df_match['p1_ace'] + df_match['p1_winner'] - df_match['p1_unf_err'] + df_match['p1_net_pt_won']
df_match['p2_performance'] = df_match['p2_ace'] + df_match['p2_winner'] - df_match['p2_unf_err'] + df_match['p2_net_pt_won']
# 设置窗口大小为5个点来计算动量
window_size = 5
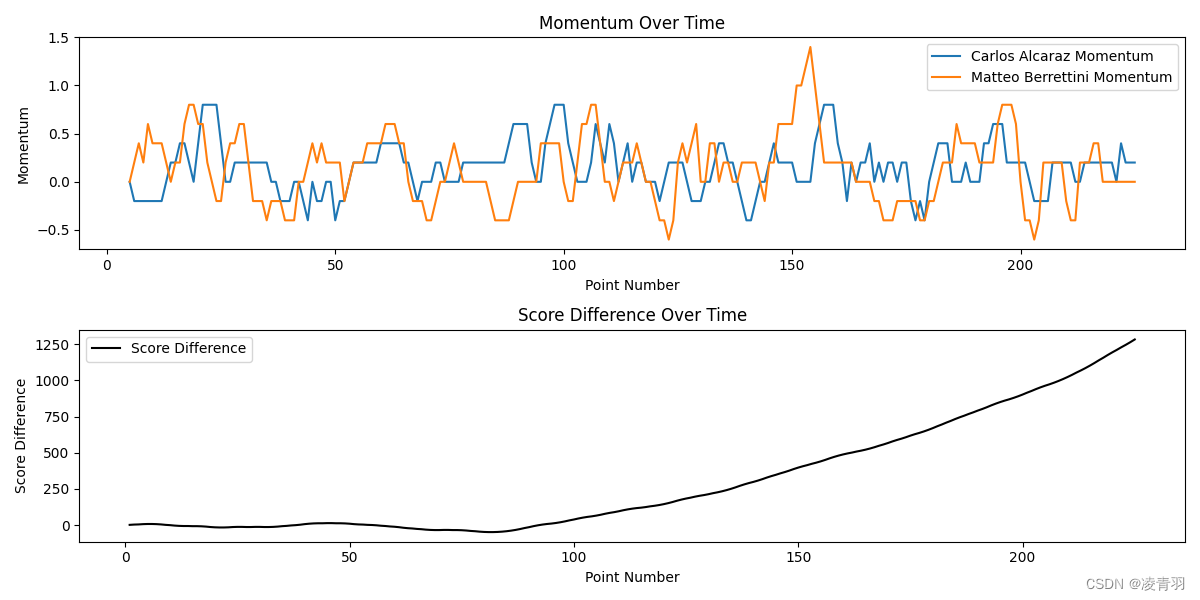
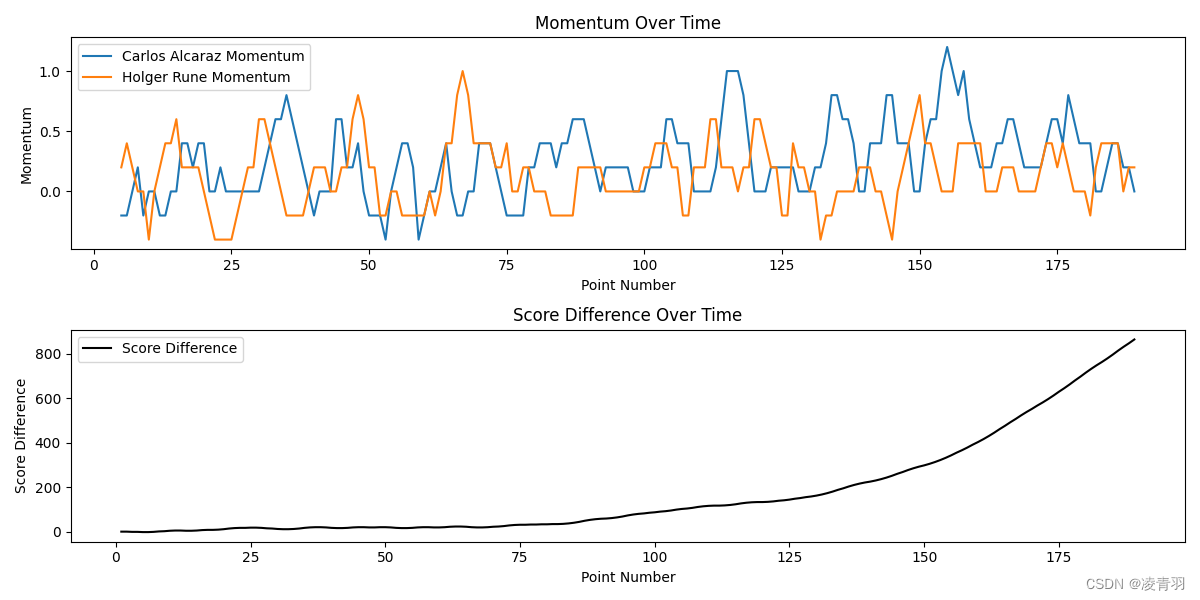
df_match['p1_momentum'] = df_match['p1_performance'].rolling(window=window_size).mean()
df_match['p2_momentum'] = df_match['p2_performance'].rolling(window=window_size).mean()
df_match['score_diff'] = df_match['p1_points_won'].cumsum() - df_match['p2_points_won'].cumsum()
# 计算得分之间的相关性
correlation = df_match[['p1_momentum', 'score_diff']].corr().iloc[0, 1]
# 如果相关性显著,则说明动量和得分之间存在关联
print(f"Correlation between p1 momentum and score difference: {correlation}")
# 绘制动量变化和得分差异随时间变化的图
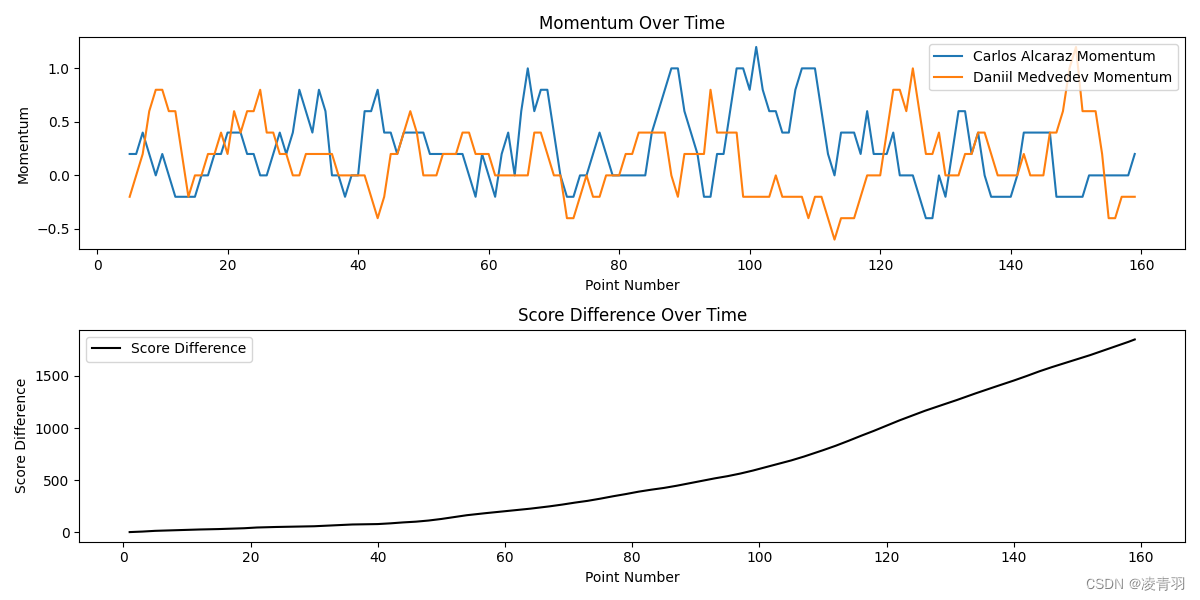
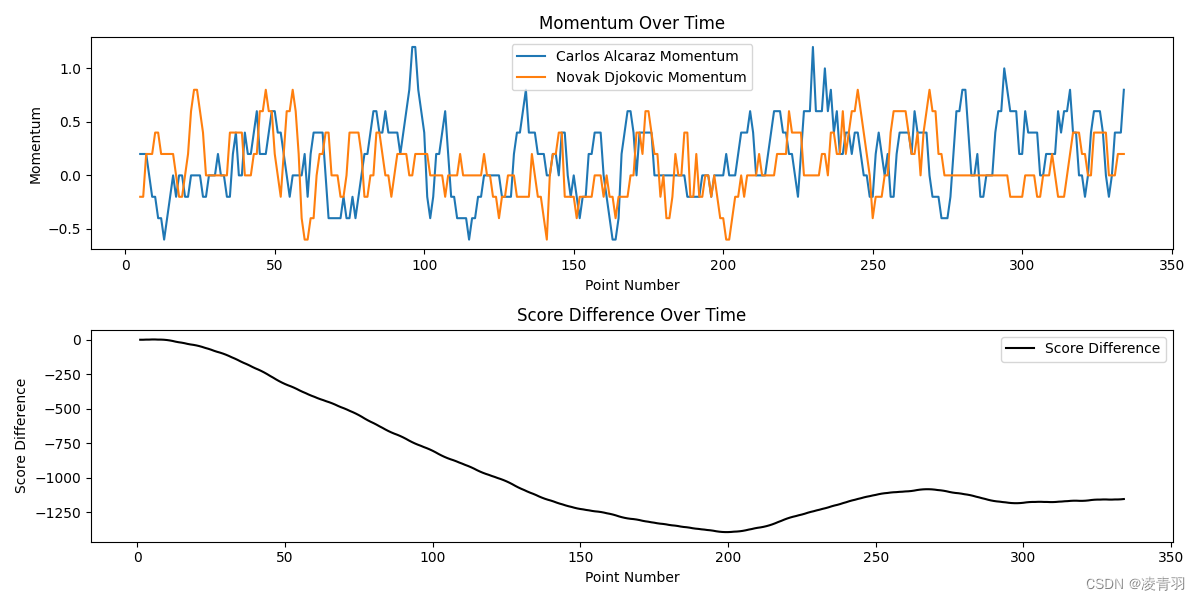
plt.figure(figsize=(12, 6))
plt.subplot(2, 1, 1)
plt.plot(df_match['point_no'], df_match['p1_momentum'], label=f'{player1_name} Momentum')
plt.plot(df_match['point_no'], df_match['p2_momentum'], label=f'{player2_name} Momentum')
plt.title('Momentum Over Time')
plt.xlabel('Point Number')
plt.ylabel('Momentum')
plt.legend()
plt.subplot(2, 1, 2)
plt.plot(df_match['point_no'], df_match['score_diff'], label='Score Difference', color='black')
plt.title('Score Difference Over Time')
plt.xlabel('Point Number')
plt.ylabel('Score Difference')
plt.legend()
# 保存图像
plt.tight_layout()
plt.savefig('momentum_and_score_diff_with_{}.png'.format(match_id))
plt.show()
首先定义了动量,然后使用了滑动平均来计算每个窗口中的平均表现力。我们也计算了比分差异,并评估了表现力的动量与比分差异之间的相关性。
如果相关系数显著且正向,这表明表现力的提升和比赛中的得分增加是相关的,这支持了动量在比赛中的存在。如果相关系数不显著或为负,这可能表明动量的影响较小,或者表现好坏确实更随机,如教练所言。在这个模型中,我们假设了动量是连续得分的结果,但实际上动量可能更复杂,可能受多种因素的影响,包括心理和战术变化等。
-
1301
-
1401
-
1501
-
1601
-
1701
Correlation between p1 momentum and score difference: -0.02079917863967964
Correlation between p1 momentum and score difference: -0.007829762633967292
Correlation between p1 momentum and score difference: 0.2844958656188086
Correlation between p1 momentum and score difference: -0.18565564810731935
Correlation between p1 momentum and score difference: -0.1871007098445776
问题三.
问题分析
为了预测比赛中的流程变化,我们可以构建一个反映比赛转折点的模型。这个模型可以基于多种因素,包括但不限于比分波动、连续得分、制胜分、非受迫性失误、破发点成功等。
以下是构建模型的步骤和假设:
- 模型假设:比赛流程的转变与某些关键统计数据的变化相关联,例如相对得分差异的变化、连续得分的数目、破发点的赢取、以及球员疲劳度(可能由连续长球对抗和移动距离指示)。
- 模型建立:使用滑动窗口计算过去几个点的统计总结,如得分差异、连续得分、制胜分、非受迫性失误、破发点转换率等。
- 模型评估:运用统计分析(例如皮尔逊相关系数)或者机器学习模型(例如逻辑回归)来估计不同因素与转折点的相关性。
问题解答
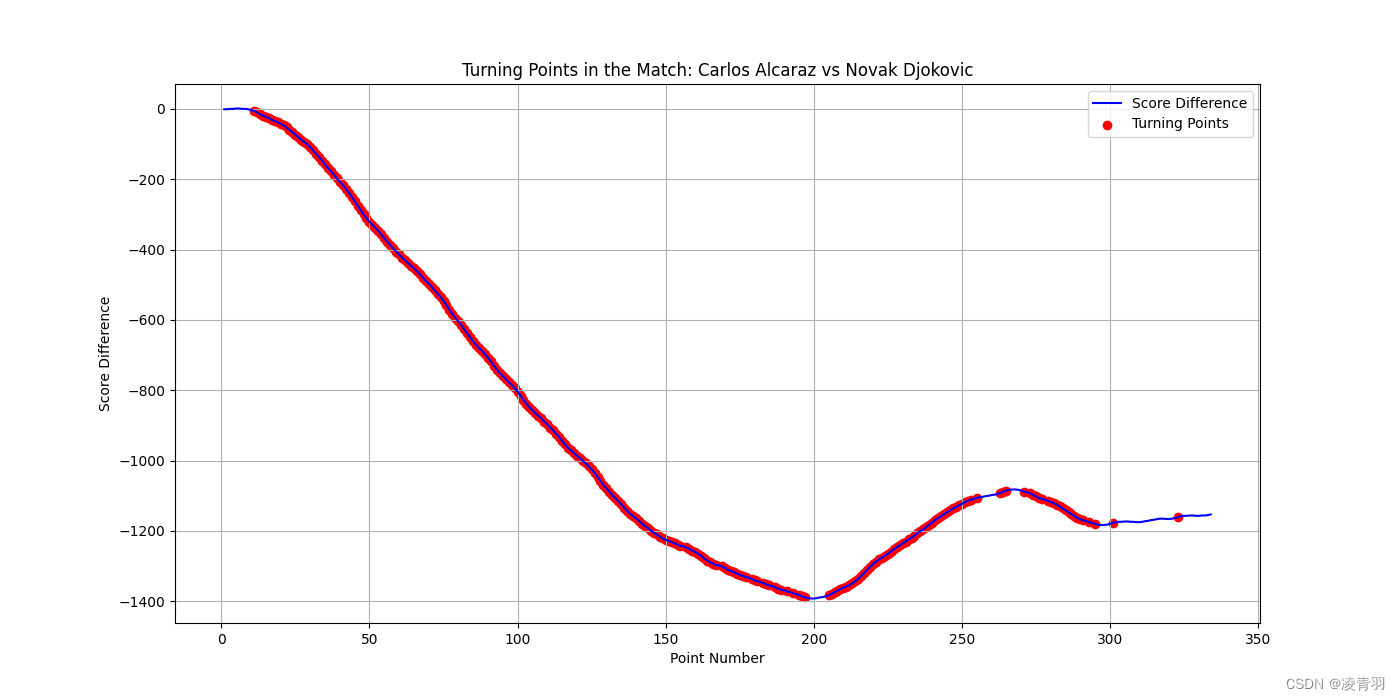
- 以1701为例
假设比分差异的大幅变化可以标记为比赛转折点。我们通过滑动窗口计算了过去5个点的相关因素统计总结,并使用这些数据来训练一个逻辑回归模型。
通过模型评估和结果的classification_report,我们可以看到哪些因素对预测转折点最有影响。这可以通过查看模型的系数或使用特征选择技术进行进一步分析。
import pandas as pd
import numpy as np
import matplotlib.pyplot as plt
from sklearn.linear_model import LogisticRegression
from sklearn.model_selection import train_test_split
from sklearn.metrics import classification_report

# 读取数据
df = pd.read_csv('../Problem_C_Wimbledon_featured_matches.csv')

# 选择特定比赛
match_id = '2023-wimbledon-1701'
df_match = df[df['match_id'] == match_id]

# 提取球员姓名
player1_name = df_match['player1'].iloc[0]
player2_name = df_match['player2'].iloc[0]

# 计算每点后的比分差异
df_match['score_diff'] = df_match['p1_points_won'].cumsum() - df_match['p2_points_won'].cumsum()

# 定义一个转折点
df_match['turning_point'] = np.where(df_match['score_diff'].diff().abs() >= 3, 1, 0)

# 选择相关因素
factors = ['p1_ace', 'p2_ace', 'p1_winner', 'p2_winner', 'p1_unf_err', 'p2_unf_err', 'p1_break_pt_won', 'p2_break_pt_won', 'p1_distance_run', 'p2_distance_run', 'rally_count']

# 用滑动窗口计算过去5个点的统计总结
window_size = 5
for factor in factors:
    df_match[f'{factor}_rolling'] = df_match[factor].rolling(window=window_size).sum()

# 准备模型数据
X = df_match[[f'{factor}_rolling' for factor in factors]].dropna()
y = df_match.loc[X.index, 'turning_point']

# 分割数据集
X_train, X_test, y_train, y_test = train_test_split(X, y, test_size=0.2, random_state=42)

# 使用逻辑回归模型
model = LogisticRegression()
model.fit(X_train, y_train)

# 模型评估
predictions = model.predict(X_test)
print(classification_report(y_test, predictions))

# 可视化比赛流程的转变点
plt.figure(figsize=(14, 7))
plt.plot(df_match['point_no'], df_match['score_diff'], label='Score Difference', color='blue')
plt.scatter(df_match.loc[df_match['turning_point'] == 1, 'point_no'], df_match.loc[df_match['turning_point'] == 1, 'score_diff'], color='red', label='Turning Points')
plt.title(f'Turning Points in the Match: {player1_name} vs {player2_name}')
plt.xlabel('Point Number')
plt.ylabel('Score Difference')
plt.legend()
plt.grid(True)
plt.savefig('match_turning_points.png')
plt.show()
              precision    recall  f1-score   support

           0       0.00      0.00      0.00        18
           1       0.73      1.00      0.84        48

    accuracy                           0.73        66
   macro avg       0.36      0.50      0.42        66
weighted avg       0.53      0.73      0.61        66
问题四.
问题分析
测试我们开发的模型,需要将模型应用于新数据(前面用的"2023-wimbledon-1316", “2023-wimbledon-1408”, “2023-wimbledon-1501”, “2023-wimbledon-1601”, “2023-wimbledon-1701”),可以用其他数据做评测
赛题翻译


 被折叠的 条评论
为什么被折叠?
被折叠的 条评论
为什么被折叠?
 到【灌水乐园】发言


