<template>
<div>
<div ref="myCharts" id="main1" ></div>
</div>
</template>
<script>
import * as echarts from 'echarts'
import 'echarts-gl'
export default {
data() {
return {
}
},
components: {
},
methods: {
bzt1() {
var chartDom = document.getElementById('main1');
var myChart = echarts.init(chartDom);
let dataList=[
[
{
name:'浙江',
data:[55]
}
]
]
var option;
option = {
backgroundColor: '#031245',
grid: {
left: '6%',
top: '15%',
bottom: '20%',
right: '6%',
},
legend: {
itemWidth: 7,
itemHeight: 7,
bottom:0,
data: [
{
name:'日前',
icon:'rect',
itemStyle:{
},
textStyle:{
color:'rgba(255, 255, 255, 0.8)',
fontSize:10,
}
},
{
name:'实时',
icon:'rect',
textStyle:{
color:'rgba(255, 255, 255, 0.8)',
fontSize:10,
}
}
]
},
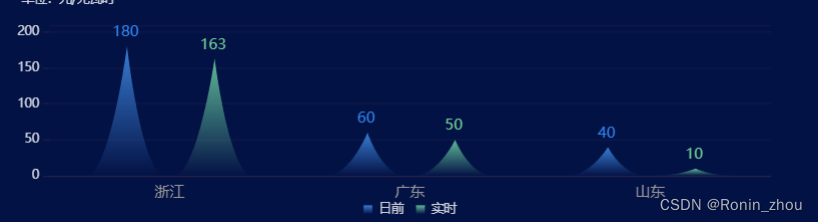
xAxis: {
data: ['浙江', '广东','山东'],
axisTick: {
show: false,
},
axisLine: {
lineStyle: {
color: 'rgba(255, 129, 109,.1)',
width: 1,
},
},
axisLabel: {
textStyle: {
color: '#999',
fontSize: 12,
},
},
},
yAxis: [
{
name: "单位:元/兆瓦时",
nameTextStyle:{
color:'rgba(255, 255, 255, 0.8)',
fontSize:10,
padding:[0,0,0,30],
},
max: function(e){
console.log(e)
return e.max+30
},
axisTick: {
show: true,
},
axisLine: {
lineStyle: {
color: 'rgba(255, 129, 109, 0.1)',
width: 1,
},
},
axisLabel: {
textStyle: {
fontSize:10,
color: 'rgba(255, 255, 255, 0.8)',
},
},
splitArea: {
areaStyle: {
color: 'rgba(255,255,255,.5)',
},
},
splitLine: {
show: true,
lineStyle: {
color: 'rgba(255, 129, 109, 0.1)',
width: 0.5,
type: 'solid',
},
},
},
],
series: [
{
name: '日前',
type: 'pictorialBar',
barCategoryGap: 20,
symbol: "path://M12.000,-0.000 C12.000,-0.000 16.074,60.121 22.731,60.121 C26.173,60.121 -3.234,60.121 0.511,60.121 C7.072,60.121 12.000,-0.000 12.000,-0.000 Z",
barWidth: 65,
symbolOffset: [-35, 0],
itemStyle: {
normal: {
color: {
type: 'linear',
x: 0,
y: 0,
x2: 0,
y2: 1,
colorStops: [
{
offset: 0,
color: 'rgba(57, 125, 211, 1)',
},
{
offset: 1,
color: 'rgba(57, 125, 211, 0)',
},
],
global: false,
},
},
emphasis: {
opacity: 1,
},
},
label: {
show: true,
position: 'top',
color: 'rgba(48, 134, 243, 1)',
fontSize: 12,
offset:[-35, 0]
},
data: [180, 60,40],
},
{
name: '实时',
type: 'pictorialBar',
barCategoryGap: 20,
symbol: "path://M12.000,-0.000 C12.000,-0.000 16.074,60.121 22.731,60.121 C26.173,60.121 -3.234,60.121 0.511,60.121 C7.072,60.121 12.000,-0.000 12.000,-0.000 Z",
symbolOffset: [35, 0],
barWidth: 65,
itemStyle: {
normal: {
color: {
type: 'linear',
x: 0,
y: 0,
x2: 0,
y2: 1,
colorStops: [
{
offset: 0,
color: 'rgba(95, 186, 153, 1)',
},
{
offset: 1,
color: 'rgba(95, 186, 153, 0)',
},
],
global: false,
},
},
emphasis: {
opacity: 1,
},
},
label: {
show: true,
position: 'top',
color: 'rgba(111, 209, 149, 1)',
fontSize: 12,
offset:[35, 0]
},
data: [163, 50,10],
},
],
};
option && myChart.setOption(option);
}
},
mounted() {
this.bzt1()
},
name: "tjt1",
}
</script>
<style scoped="scoped">
#main1{
width: 655px;
height: 184.5px;
}
</style>


 1131
1131

 被折叠的 条评论
为什么被折叠?
被折叠的 条评论
为什么被折叠?
 到【灌水乐园】发言


