


上期推文推出使用极少代码绘制顶级期刊要求的学术图表(一行代码绘制符合···)后,有小伙伴就问了,有没有可以使用较少代码绘制偏商业风的技巧分享?还别说,我还真有这样的技巧准备分享给爱学习的你们!话不多说,咱们开始,本期的推文主要内容如下:
-
R-ggcharts 简介
-
R-ggcharts 实例绘制展示
-
更多详细的数据可视化教程,可订阅我们的店铺课程:
-

R-ggcharts 简介
R虽然有优秀的ggplot2包帮助我们完成各种各样的可视化作品(只要数据支持,理论上你能想到的任何图表都是能够绘制的),但对图表颜值有一定要求的小伙伴们可能需要花费大量时间去定制化绘制(我们还有主题包,这里不做讨论哈),而R-ggcharts包则可以帮助我们使用极少的代码绘制出商业风格的可视化作品。介绍如下:
-
官网
官网:https://thomas-neitmann.github.io/ggcharts/index.html ,这里放一下官网的图:
R-ggcharts 官网
(第一眼看到这个就慕了,作者是讲究人啊)
-
主要绘图函数
R-ggcharts作为一个新包,其提供的作图函数还不是很多,主要如下:
-
*bar_chart()、column_chart()*:绘制条形图(Bar Chart)
-
diverging_bar_chart(): 绘制不同方向条形图(Diverging Bar Chart)
-
diverging_lollipop_chart(): 绘制不同方向棒棒糖图(Diverging Lollipop Chart)
-
dumbbell_chart(): 绘制哑铃图(Dumbbell Chart)
-
line_chart(): 绘制线图(Line Chart)
-
lollipop_chart():绘制单一方向的棒棒糖图(Lollipop Chart)
-
pyramid_chart(): 绘制金字塔图(Pyramid Chart)
此外,R-ggcharts还提供theme_coffee()、theme_ggcharts()、theme_hermit()、theme_ng()、theme_nightblue() 多个主题,更多详细内容,可参考官网哈。
R-ggcharts 实例绘制展示
介绍完主要的绘图函数,我们还是进行实例展示,体验R-ggcharts包带给我们的绘图便捷性。
-
「bar charts」
我们首先对比下和常规ggplot2绘图的不同,以下为ggplot2 绘制柱形图代码:
library(dplyr)
library(ggplot2)
library(ggcharts)
data("biomedicalrevenue")

plot01_ggplot2 <- biomedicalrevenue %>%
  filter(year %in% c(2012, 2015, 2018)) %>%
  group_by(year) %>%
  top_n(10, revenue) %>%
  ungroup() %>%
  mutate(company = tidytext::reorder_within(company, revenue, year)) %>%
  ggplot(aes(company, revenue)) +
  geom_col() +
  coord_flip() +
  tidytext::scale_x_reordered() +
  facet_wrap(vars(year), scales = "free_y")
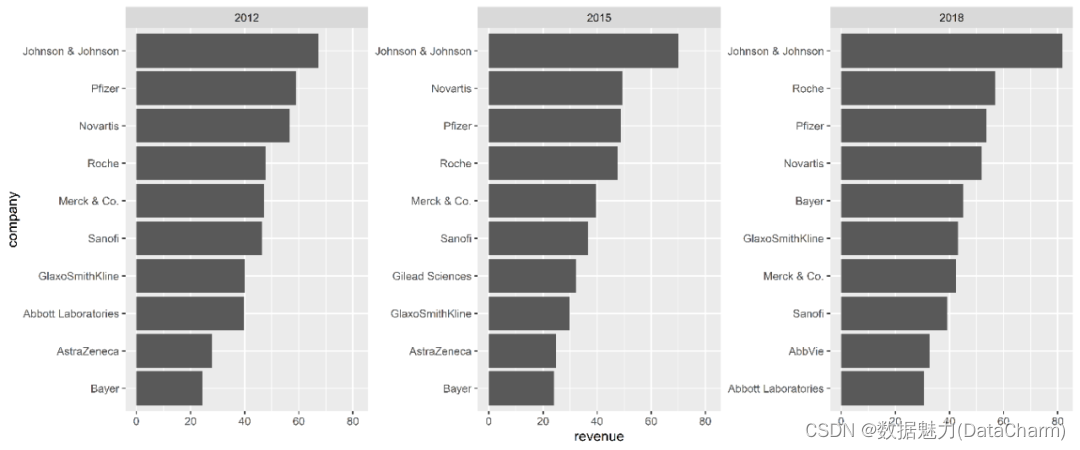
bar charts with ggplot2
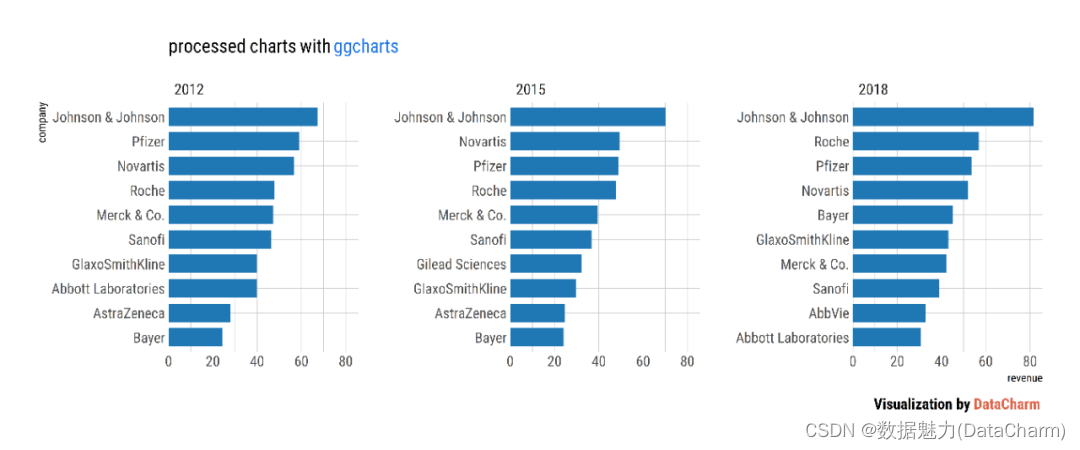
而使用ggcharts 进行绘制,不仅代码量减少,其颜值也大幅度提升:
plot01_ggcharts <- biomedicalrevenue %>%
  filter(year %in% c(2012, 2015, 2018)) %>%
  bar_chart(x = company, y = revenue, facet = year, top_n = 10)
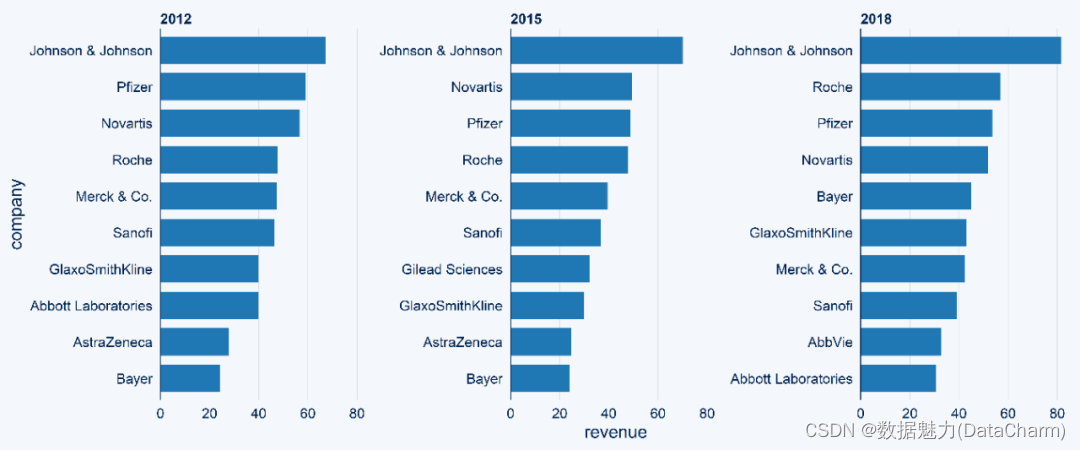
bar charts with ggcharts
如果我们结合主题包hrbrthemes进行更加细致的绘制,可得到如下结果:
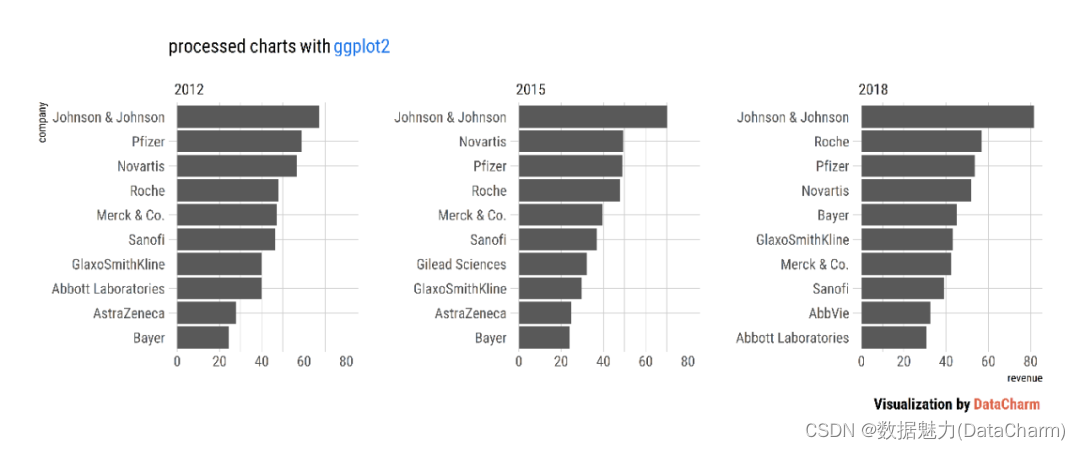
bar charts with hrbrthemes
bar charts with ggcharts and hrbrthemes
-
「Diverging Bar Chart」
这类型在使用ggplot2绘制时,往往需要较多的代码量进行绘制,而 ggcharts 则只需几行代码即可:
diverging_bar_chart <- diverging_bar_chart(mtcars_z, model, hpz, text_color = c("#1F77B4", "#FF7F0E")) +
  # 细节美化操作
  labs(
           subtitle = "processed charts with <span style='color:#1A73E8'>ggcharts</span>",
           caption = "Visualization by <span style='color:#DD6449'>DataCharm</span>")+
  # 添加主题
  hrbrthemes::theme_ipsum(base_family = "Roboto Condensed") +
  theme(
            plot.subtitle = element_markdown(hjust = 0,vjust = .5,size=15),
            plot.caption = element_markdown(face = 'bold',size = 12),
          )

diverging_bar_chart
-
「diverging_lollipop_chart」
diverging_lollipop_chart <- diverging_lollipop_chart(mtcars_z, model, hpz, text_color = c("#1F77B4", "#FF7F0E"))+
  # 细节美化操作
  labs(
           subtitle = "processed charts with <span style='color:#1A73E8'>ggcharts</span>",
           caption = "Visualization by <span style='color:#DD6449'>DataCharm</span>")+
  # 添加主题
  hrbrthemes::theme_ipsum(base_family = "Roboto Condensed") +
  theme(
            plot.subtitle = element_markdown(hjust = 0,vjust = .5,size=15),
            plot.caption = element_markdown(face = 'bold',size = 12),
          )

diverging_lollipop_chart
-
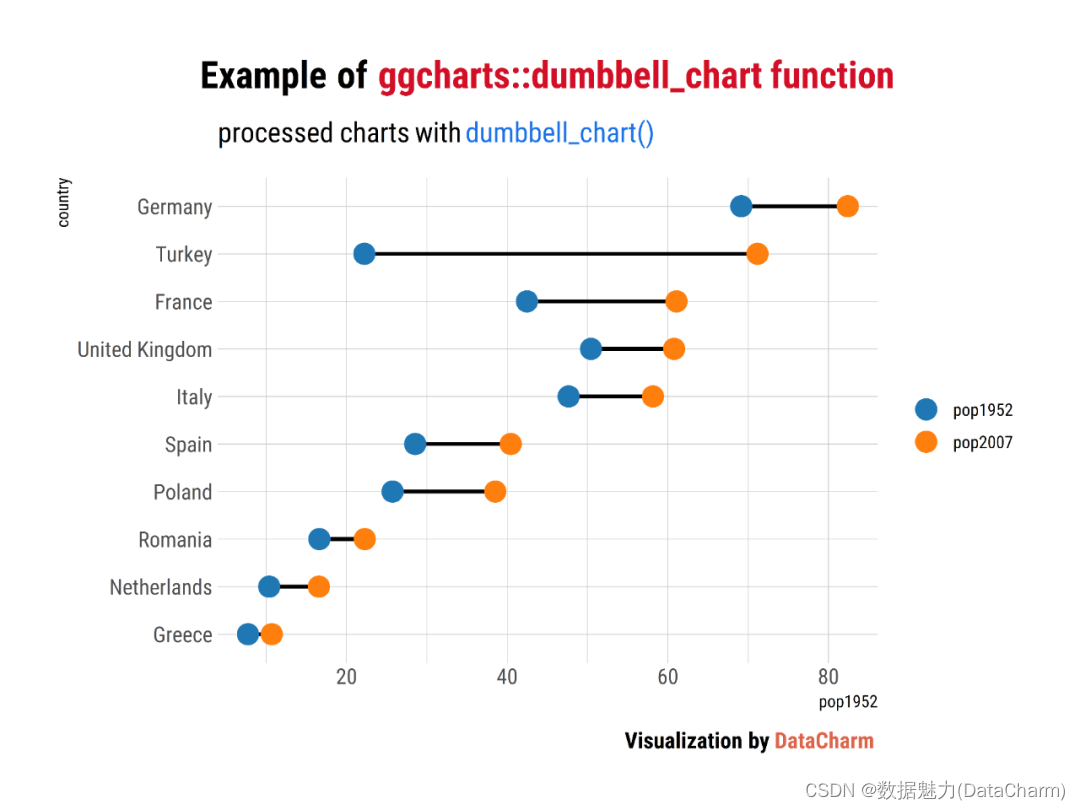
「dumbbell chart」
data(popeurope)
dumbbell_chart(popeurope, country, pop1952, pop2007, top_n = 10,line_color = "black",
               line_size = 1, point_size = 5) +
 # 细节美化操作
  labs(    title = "Example of <span style='color:#D20F26'>ggcharts::dumbbell_chart function</span>",
           subtitle = "processed charts with <span style='color:#1A73E8'>dumbbell_chart()</span>",
           caption = "Visualization by <span style='color:#DD6449'>DataCharm</span>")+
  # 添加主题
  hrbrthemes::theme_ipsum(base_family = "Roboto Condensed") +
  theme(    plot.title = element_markdown(hjust = 0.5,vjust = .5,color = "black",
                                     size = 20, margin = margin(t = 1, b = 12)),
            plot.subtitle = element_markdown(hjust = 0,vjust = .5,size=15),
            plot.caption = element_markdown(face = 'bold',size = 12),
          )
dumbbell chart
-
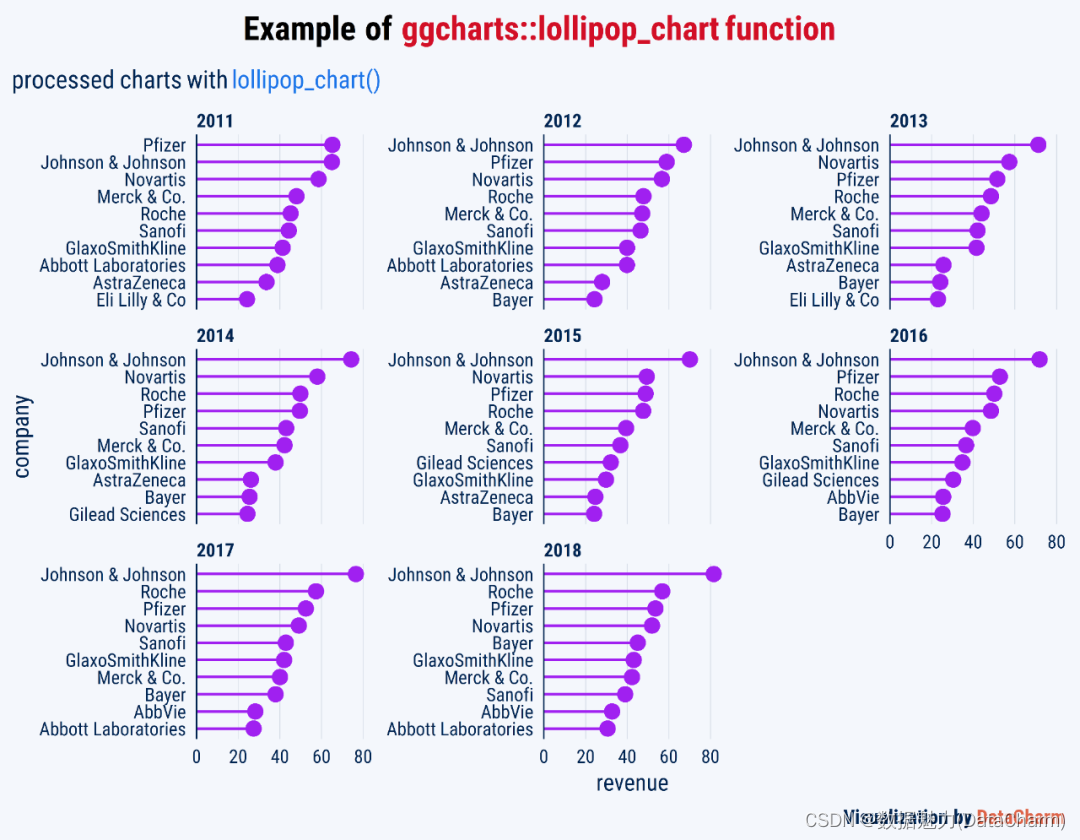
「lollipop_chart」
lollipop_chart(biomedicalrevenue, company, revenue, facet = year, line_color = "purple",top_n = 10) +
labs(    title = "Example of <span style='color:#D20F26'>ggcharts::lollipop_chart function</span>",
           subtitle = "processed charts with <span style='color:#1A73E8'>lollipop_chart()</span>",
           caption = "Visualization by <span style='color:#DD6449'>DataCharm</span>")+
theme(text = element_text(family = "Roboto Condensed"),
     plot.title = element_markdown(hjust = 0.5,vjust = .5,color = "black",face = "bold",
                                     size = 20, margin = margin(t = 1, b = 12)),
            plot.subtitle = element_markdown(hjust = 0,vjust = .5,size=15),
            plot.caption = element_markdown(face = 'bold',size = 12))
lollipop_chart
-
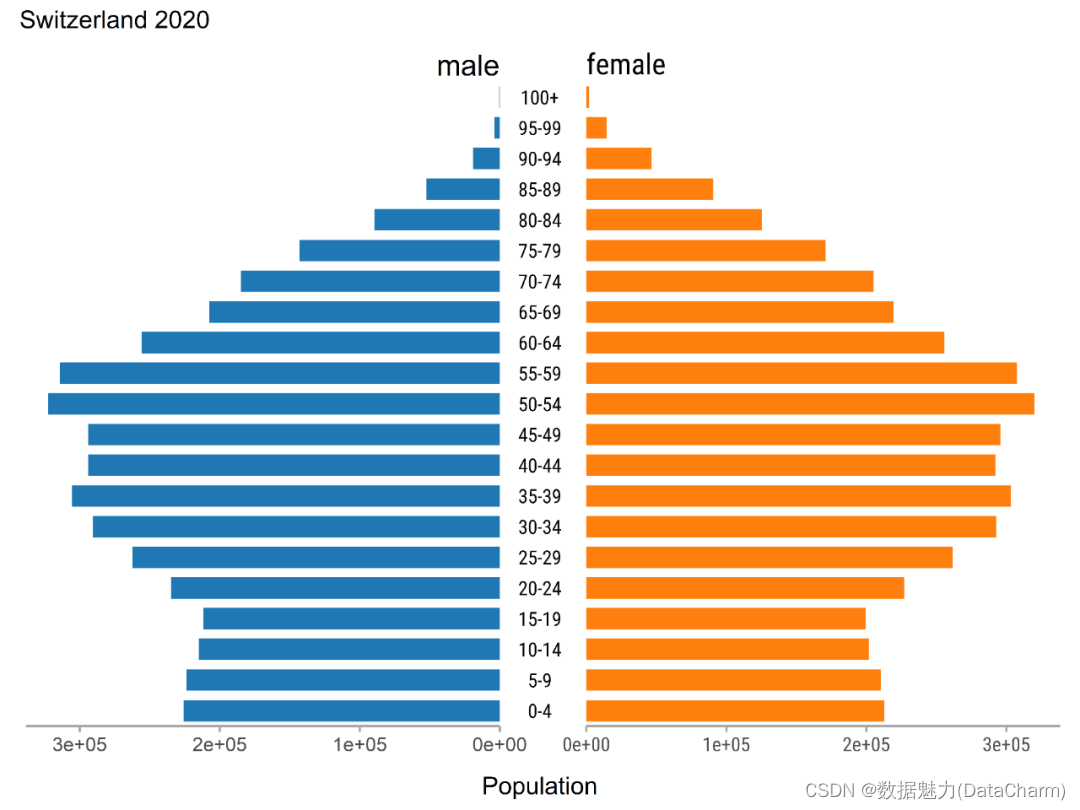
「Pyramid Chart」
data(popch)
pyramid_chart(popch, age, pop, sex,xlab = "Population", title = "Switzerland 2020")
Pyramid Chart
-
「主题设置」 ggcharts 包提供了多种主题,可视化绘制分别如下:
ggcharts_set_theme("theme_hermit")
bar_chart(data = diamonds, x = cut)
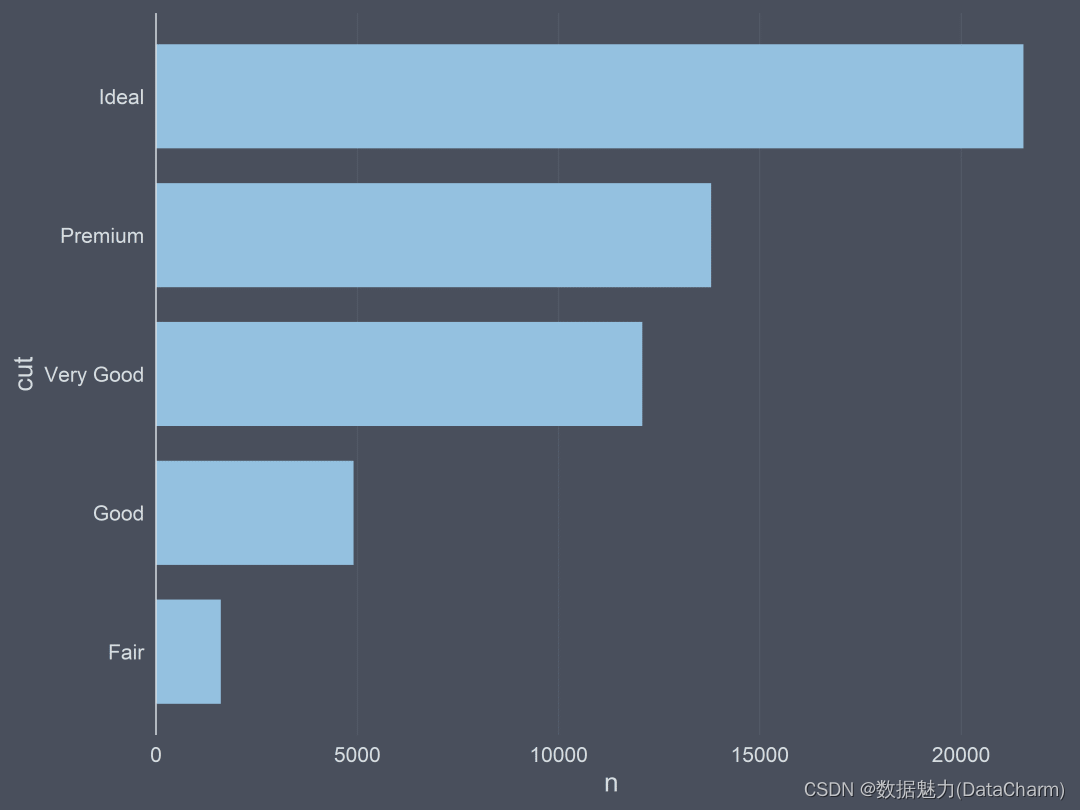
theme_hermit

theme_ng
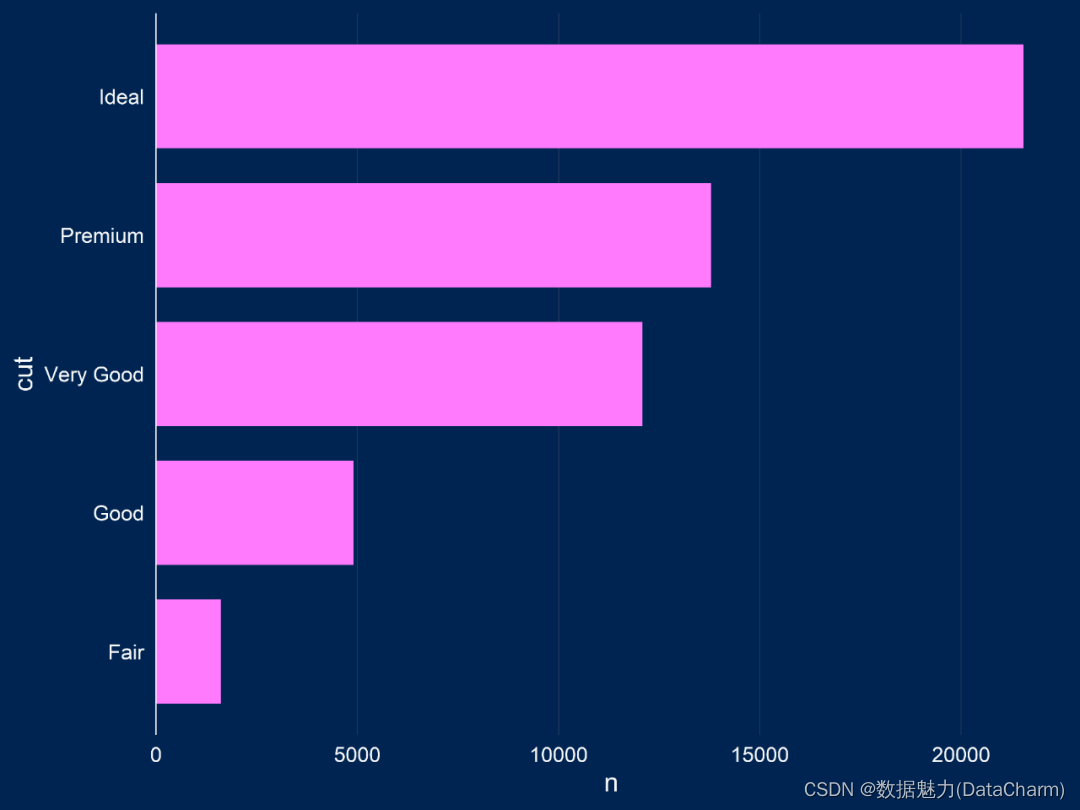
theme_nightblue
-
高亮标出 这是ggcharts的一大亮点,也是小编非常喜欢的一个
ggcharts_set_theme("theme_ng")
bar_chart(data = diamonds, x = cut,highlight = "Premium")+
#细节美化操作
  labs(    title = "Example of <span style='color:#D20F26'>ggcharts::highlight process</span>",
           subtitle = "processed charts with <span style='color:#1A73E8'>highlight</span>",
           caption = "Visualization by <span style='color:#DD6449'>DataCharm</span>")+
  # 添加主题
  theme(    text = element_text(family = "Roboto Condensed"),
            plot.title = element_markdown(hjust = 0.5,vjust = .5,color = "black",
                                     size = 20, margin = margin(t = 1, b = 12)),
            plot.subtitle = element_markdown(hjust = 0,vjust = .5,size=15),
            plot.caption = element_markdown(face = 'bold',size = 12),
          )
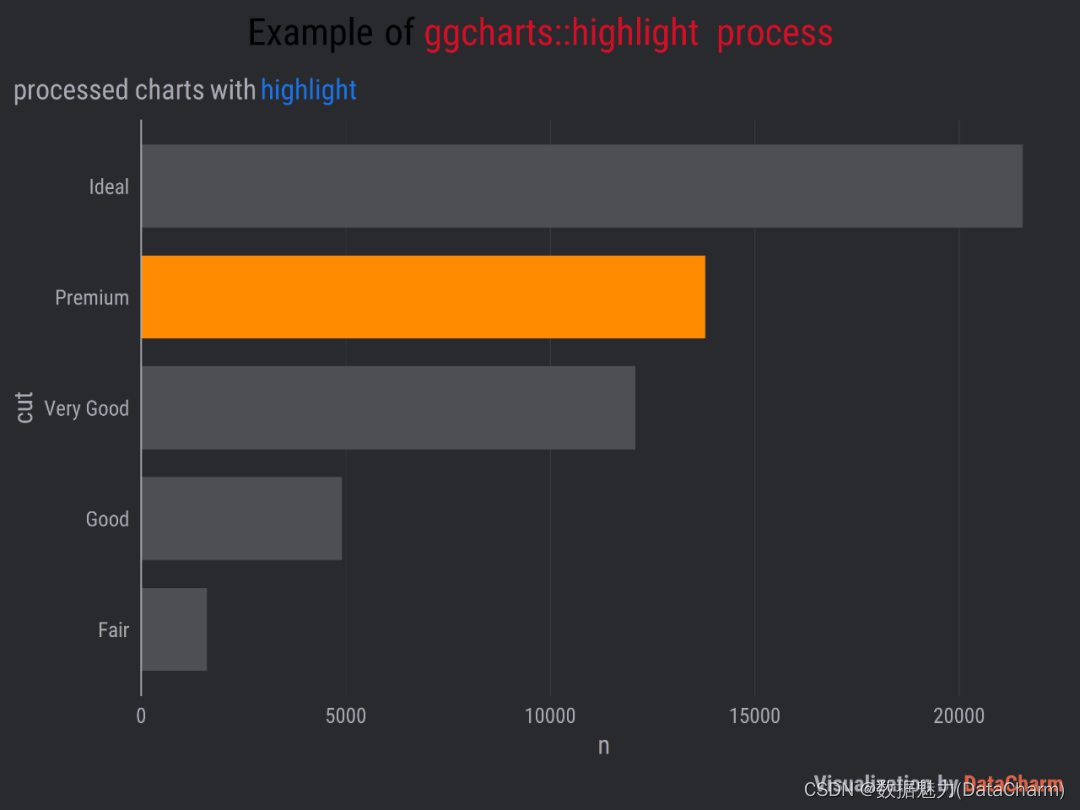
highlight process
更多详细内容,大家可去官网自行探索哈~~
总结
本期推文我们介绍一个绘制图表更加方便(少代码量,商业风)的优质绘图包,极大的简化那些复杂图表的绘制过程,希望大家可以喜欢~~


 2619
2619

 被折叠的 条评论
为什么被折叠?
被折叠的 条评论
为什么被折叠?
 到【灌水乐园】发言


