


 本文详细展示了如何在ECharts库中创建一个带有3D效果的立体柱状图和折线图,包括定制图形形状、颜色渐变和数据绑定等关键步骤。
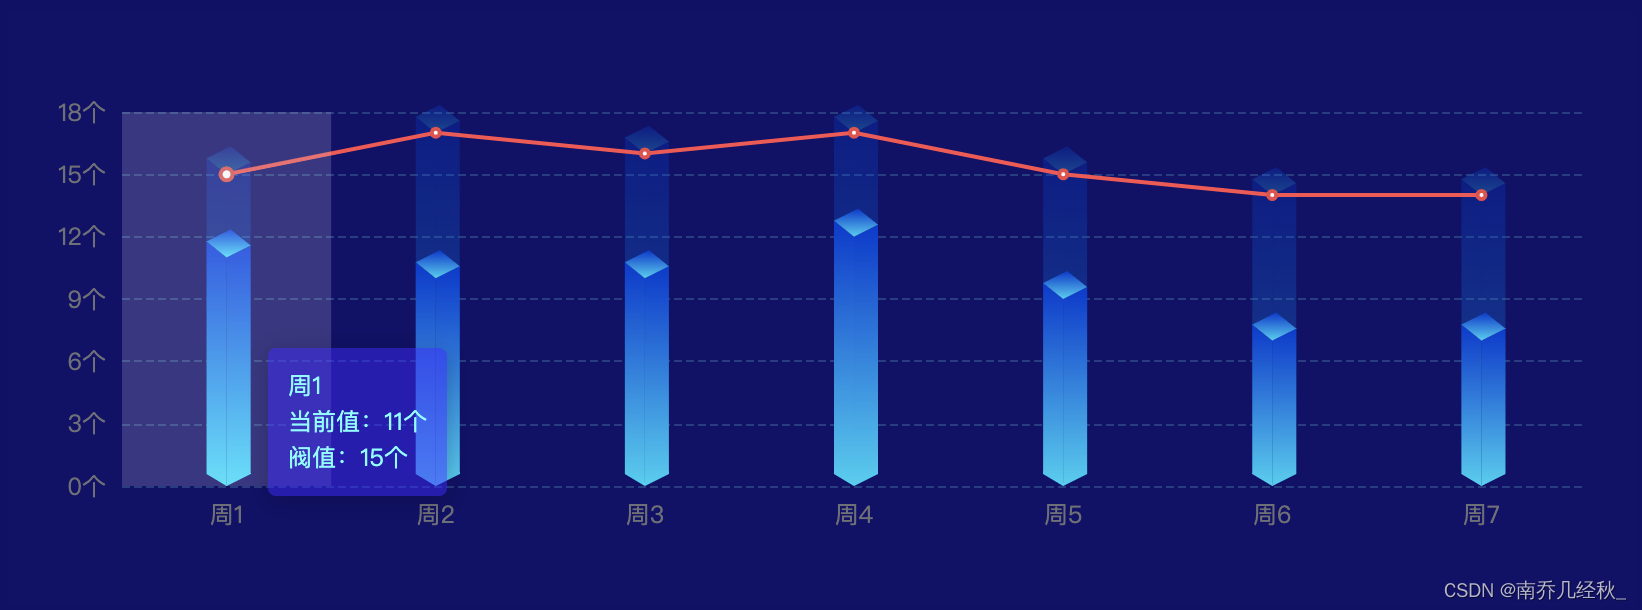
效果:
3D立体柱状图加折线
代码:
let config = {
  maxList: [15, 17, 16, 17, 15, 14, 14],
  valueList: [
    11, 10, 10, 12, 9, 7, 7
  ]
};
// 绘制左侧面
const CubeLeft = echarts.graphic.extendShape({
  shape: {
    x: 0,
    y: 0
  },
  buildPath: function (ctx, shape) {
    const xAxisPoint = shape.xAxisPoint;
    const c0 = [shape.x, shape.y];
    const c1 = [shape.x - 10, shape.y - 8];
    const c2 = [xAxisPoint[0] - 10, xAxisPoint[1] - 6];
    const c3 = [xAxisPoint[0], xAxisPoint[1]];
    ctx
      .moveTo(c0[0], c0[1])
      .lineTo(c1[0], c1[1])
      .lineTo(c2[0], c2[1])
      .lineTo(c3[0], c3[1])
      .closePath();
  }
});
// 绘制右侧面
const CubeRight = echarts.graphic.extendShape({
  shape: {
    x: 0,
    y: 0
  },
  buildPath: function (ctx, shape) {
    const xAxisPoint = shape.xAxisPoint;
    const c1 = [shape.x, shape.y];
    const c2 = [xAxisPoint[0], xAxisPoint[1]];
    const c3 = [xAxisPoint[0] + 12, xAxisPoint[1] - 6];
    const c4 = [shape.x + 12, shape.y - 6];
    ctx
      .moveTo(c1[0], c1[1])
      .lineTo(c2[0], c2[1])
      .lineTo(c3[0], c3[1])
      .lineTo(c4[0], c4[1])
      .closePath();
  }
});
// 绘制顶面
const CubeTop = echarts.graphic.extendShape({
  shape: {
    x: 0,
    y: 0
  },
  buildPath: function (ctx, shape) {
    const c1 = [shape.x, shape.y];
    const c2 = [shape.x + 12, shape.y - 6];
    const c3 = [shape.x + 2, shape.y - 14];
    const c4 = [shape.x - 10, shape.y - 8];
    ctx
      .moveTo(c1[0], c1[1])
      .lineTo(c2[0], c2[1])
      .lineTo(c3[0], c3[1])
      .lineTo(c4[0], c4[1])
      .closePath();
  }
});
// 注册
echarts.graphic.registerShape('CubeLeft', CubeLeft);
echarts.graphic.registerShape('CubeRight', CubeRight);
echarts.graphic.registerShape('CubeTop', CubeTop);
const { bgColors, colors, maxList, valueList } = config || {};
const MAX = maxList || [];
const VALUE = valueList || [];
option = {
  backgroundColor: '#140a69',
  color: ['#ED4848'],
  tooltip: {
    trigger: 'axis',
    backgroundColor: 'rgba(69, 14, 255,0.5)',
    borderWidth: '0',
    confine: true,
    textStyle: {
      fontSize: 12,
      color: '#6DFFFF'
    },
    axisPointer: {
      type: 'shadow'
    },
    formatter: function (params, ticket, callback) {
      const item = params[1];
      return (
        item.name +
        '<br />' +
        `当前值:${item.value}个` +
        '<br />' +
        `阀值:${params[0].value}个`
      );
    }
  },
  grid: {
    left: 25,
    right: 25,
    bottom: 40,
    top: 50,
    containLabel: true
  },
  xAxis: {
    type: 'category',
    data: [
      '周1',
      '周2',
      '周3',
      '周4',
      '周5',
      '周6',
      '周7',
    ],
    axisLine: {
      show: false
    },
    nameTextStyle: {
      color: '#9899A5'
    },
    axisTick: {
      show: false
    }
  },
  yAxis: {
    type: 'value',
    axisLabel: {
      formatter: '{value}个'
    },
    splitLine: {
      show: true, // 显示分隔线
      lineStyle: {
        type: 'dashed',
        color: 'rgb(109 255 249 / 20%)'
      }
    }
  },
  series: [
    {
      type: 'custom',
      renderItem: function (params, api) {
        const location = api.coord([api.value(0), api.value(1)]);
        var color = new echarts.graphic.LinearGradient(0, 0, 0, 1, [
          {
            offset: 0,
            color: (bgColors && bgColors[0]) || 'rgba(9, 51, 209, 0.3)'
          },
          {
            offset: 1,
            color: (bgColors && bgColors[1]) || 'rgba(0, 208, 242, 0.3)'
          }
        ]);
        return {
          type: 'group',
          children: [
            {
              type: 'CubeLeft',
              shape: {
                api,
                x: location[0],
                y: location[1],
                xAxisPoint: api.coord([api.value(0), 0])
              },
              style: {
                fill: color
              }
            },
            {
              type: 'CubeRight',
              shape: {
                api,
                x: location[0],
                y: location[1],
                xAxisPoint: api.coord([api.value(0), 0])
              },
              style: {
                fill: color
              }
            },
            {
              type: 'CubeTop',
              shape: {
                api,
                x: location[0],
                y: location[1],
                xAxisPoint: api.coord([api.value(0), 0])
              },
              style: {
                fill: color
              }
            }
          ]
        };
      },
      data: MAX
    },
    {
      type: 'custom',
      renderItem: (params, api) => {
        const location = api.coord([api.value(0), api.value(1)]);
        var color = new echarts.graphic.LinearGradient(0, 0, 0, 1, [
          {
            offset: 0,
            color: (colors && colors[0]) || '#0933D1'
          },
          {
            offset: 1,
            color: (colors && colors[1]) || '#00D0F2'
          }
        ]);
        return {
          type: 'group',
          children: [
            {
              type: 'CubeLeft',
              shape: {
                api,
                xValue: api.value(0),
                yValue: api.value(1),
                x: location[0],
                y: location[1],
                xAxisPoint: api.coord([api.value(0), 0])
              },
              style: {
                fill: color
              }
            },
            {
              type: 'CubeRight',
              shape: {
                api,
                xValue: api.value(0),
                yValue: api.value(1),
                x: location[0],
                y: location[1],
                xAxisPoint: api.coord([api.value(0), 0])
              },
              style: {
                fill: color
              }
            },
            {
              type: 'CubeTop',
              shape: {
                api,
                xValue: api.value(0),
                yValue: api.value(1),
                x: location[0],
                y: location[1],
                xAxisPoint: api.coord([api.value(0), 0])
              },
              style: {
                fill: color
              }
            }
          ]
        };
      },
      data: VALUE
    },
    {
      name: '阀值',
      data: MAX,
      type: 'line'
    }
  ]
};


 966
966

 被折叠的 条评论
为什么被折叠?
被折叠的 条评论
为什么被折叠?
 到【灌水乐园】发言


