Bokeh是一个Python库,用于在Web浏览器中创建交互式数据可视化。它以一种视觉上令人愉悦的方式提供了人类可读和快速的数据呈现。如果您以前在Python中使用过可视化,那么您可能使用过matplotlib。但是Bokeh不同于matplotlib。
要安装Bokeh,请在终端中输入以下命令。
pip install bokeh
为什么要使用Bokeh?
matplotlib和Bokeh的预期用途是完全不同的。Matplotlib创建静态图形,这些图形对于快速简单的可视化或创建出版质量的图像非常有用。Bokeh创建用于在网络上显示的可视化(无论是本地还是嵌入在网页中),最重要的是,可视化意味着高度交互。Matplotlib不提供这两个功能。
如果你想与你的数据进行视觉交互,或者你想将交互式视觉数据分发给网络观众,Bokeh是你的库!如果您的主要兴趣是生成最终的可视化以供发布,matplotlib可能更好,尽管Bokeh确实提供了一种创建静态图形的方法。
绘制一个简单的图形
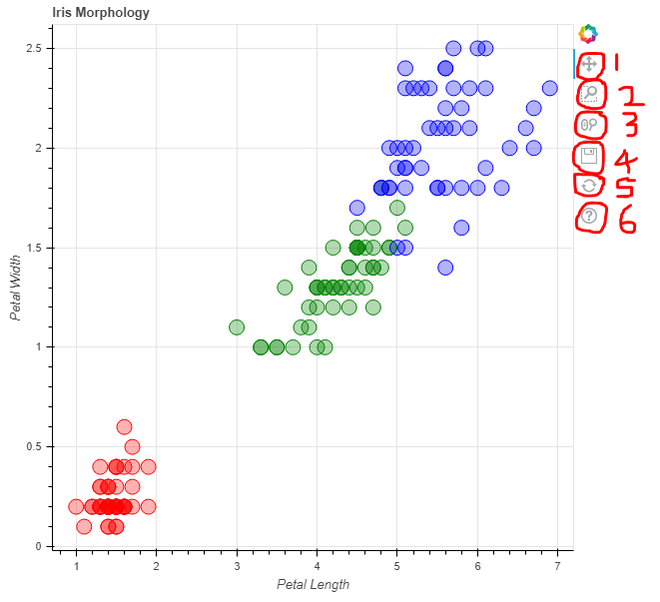
在这个例子中,我们将使用一个内置的数据集,即flowers数据集。我们可以使用circle()方法将每个数据点绘制为图上的圆,我们也可以指定自定义属性,如:
前两个元素必须分别是x轴和y轴上的数据。
color:动态分配颜色,如图所示。
fill_alpha:指定圆的不透明度。
size:指定每个圆的大小。
示例
from bokeh.plotting import figure, output_file, show
from bokeh.sampledata.iris import flowers

# assign custom colors to represent each
# class of data in a dictionary format
colormap = {'setosa': 'red', 'versicolor': 'green',
			'virginica': 'blue'}

colors = [colormap[x] for x in flowers['species']]

# title for the graph
p = figure(title="Iris Morphology")

# label on x-axis
p.xaxis.axis_label = 'Petal Length'

# label on y-axis
p.yaxis.axis_label = 'Petal Width'

# plot each datapoint as a circle
# with custom attributes.
p.circle(flowers["petal_length"],
		flowers["petal_width"],
		color=colors,
		fill_alpha=0.3,
		size=15)

# you can save the output as an
# interactive html file
output_file("iris1.html", title="iris.py example")

# display the generated plot of graph
show(p)

在上面的示例中,output_file()函数用于将生成的输出保存为html文件,因为bokeh使用web格式来提供交互式显示。最后使用show()函数显示生成的输出。
注意事项:
- 红色= Setosa,绿色= Versicolor,蓝色= Virginica
- 在每个可视化的右上角,都有bokeh提供的交互功能。它允许1.平移图,2.使用框选择进行缩放,3.使用滚轮缩放,4.保存,5.复位,6.帮助
绘制条形图
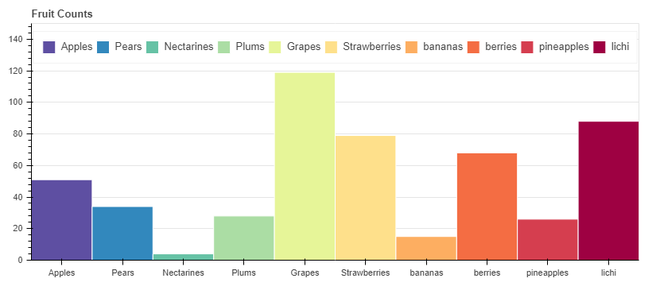
在这个例子中,我们将使用自定义创建的数据集,使用代码本身的列表,即水果数据集。output_file()函数用于将生成的输出保存为html文件,因为bokeh使用web格式。我们可以使用ColumnDataSource()函数将创建的自定义数据集(两个列表)映射为字典格式。 figure()函数用于初始化图形图形,以便可以在其上绘制数据,具有各种参数,例如:
- x_range:定义x轴上的数据。
- plot_width,plot_height:定义图形的宽度和高度。
- toolbar_location:定义工具栏的位置。
- title:定义图的标题。
这里我们使用简单的竖线来表示数据,因此我们使用vbar()方法,并在其中传递不同的参数来为竖线分配各种属性,例如:
- x:x轴方向的数据
- top:y轴方向的数据
- width:定义每个条形的宽度
- source:数据来源
- legend_field:显示数据中存在的类的列表
- line_color:定义图形中线条的颜色
- fill_color:定义数据类的不同颜色
最后使用show()函数显示生成的输出。
from bokeh.io import output_file, show
from bokeh.models import ColumnDataSource
from bokeh.palettes import Spectral10
from bokeh.plotting import figure
from bokeh.transform import factor_cmap


output_file("fruits_bar_chart.html") #output save file name

# creating custom data
fruits = ['Apples', 'Pears', 'Nectarines',
		'Plums', 'Grapes', 'Strawberries',
		'bananas','berries','pineapples','litchi']
counts = [51, 34, 4, 28, 119, 79, 15, 68, 26, 88]

# mapping counts with classes as a dictionary
source = ColumnDataSource(data=dict(fruits=fruits,
									counts=counts))

# initializing the figure
p = figure(x_range=fruits,
		plot_width=800,
		plot_height=350,
		toolbar_location=None,
		title="Fruit Counts")

# assigning various attributes to plot
p.vbar(x='fruits', top='counts',
	width=1, source=source,
	legend_field="fruits",
	line_color='white',
	fill_color=factor_cmap('fruits',
							palette=Spectral10,
							factors=fruits))

p.xgrid.grid_line_color = None
p.y_range.start = 0
p.y_range.end = 150
p.legend.orientation = "horizontal"
p.legend.location = "top_center"

# display output
show(p)

注意:这是一个静态图,也是由bokeh提供的,类似于matplotlib。


 1461
1461


 被折叠的 条评论
为什么被折叠?


