


模拟地震波传播:利用数值计算方法和 matplotlib,模拟地震发生后地震波在不同介质中的传播过程,以图形化展示波的传播情况。
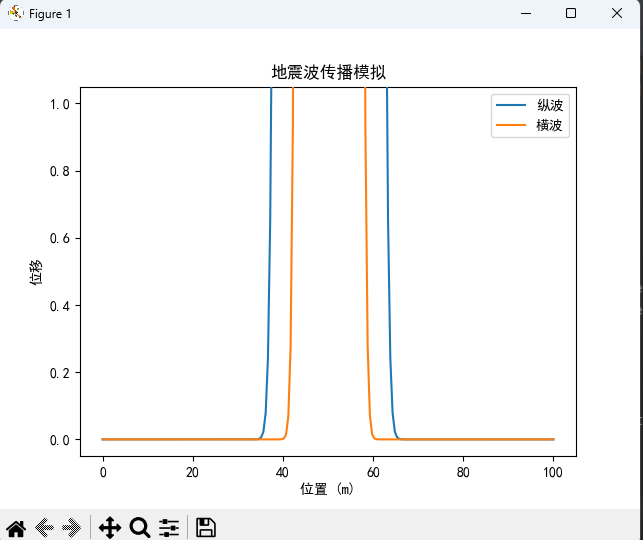
import numpy as np
import matplotlib.pyplot as plt
from matplotlib.animation import FuncAnimation

# 设置 matplotlib 支持中文
plt.rcParams['font.sans-serif'] = ['SimHei']  # 使用黑体字体
plt.rcParams['axes.unicode_minus'] = False  # 解决负号显示问题

# 物理参数
L = 100.0  # 模拟区域的长度 (m)
T = 20.0  # 模拟的总时间 (s)
dx = 0.5  # 空间步长 (m)
dt = 0.01  # 时间步长 (s)
c_p = 5.0  # 纵波速度 (m/s)
c_s = 3.0  # 横波速度 (m/s)

# 计算网格点数和时间步数
nx = int(L / dx)
nt = int(T / dt)

# 初始化位移数组
u_p = np.zeros((nt, nx))  # 纵波位移
u_s = np.zeros((nt, nx))  # 横波位移

# 初始条件(地震源)
source_location = int(nx / 2)
u_p[0, source_location] = 1.0
u_s[0, source_location] = 1.0

# 有限差分法更新位移
for n in range(0, nt - 1):
    for i in range(1, nx - 1):
        # 更新纵波位移
        u_p[n + 1, i] = 2 * (1 - c_p ** 2 * dt ** 2 / dx ** 2) * u_p[n, i] - u_p[n - 1, i] + \
                        c_p ** 2 * dt ** 2 / dx ** 2 * (u_p[n, i + 1] + u_p[n, i - 1])
        # 更新横波位移
        u_s[n + 1, i] = 2 * (1 - c_s ** 2 * dt ** 2 / dx ** 2) * u_s[n, i] - u_s[n - 1, i] + \
                        c_s ** 2 * dt ** 2 / dx ** 2 * (u_s[n, i + 1] + u_s[n, i - 1])

# 设置图形
fig, ax = plt.subplots()
x = np.linspace(0, L, nx)
line_p, = ax.plot(x, u_p[0, :], label='纵波')
line_s, = ax.plot(x, u_s[0, :], label='横波')
ax.set_xlabel('位置 (m)')
ax.set_ylabel('位移')
ax.set_title('地震波传播模拟')
ax.legend()


# 动画更新函数
def update(frame):
    line_p.set_ydata(u_p[frame, :])
    line_s.set_ydata(u_s[frame, :])
    return line_p, line_s,


# 创建动画
ani = FuncAnimation(fig, update, frames=nt, interval=20, blit=True)

# 显示动画
plt.show()


 450
450

 被折叠的 条评论
为什么被折叠?
被折叠的 条评论
为什么被折叠?
 到【灌水乐园】发言


