


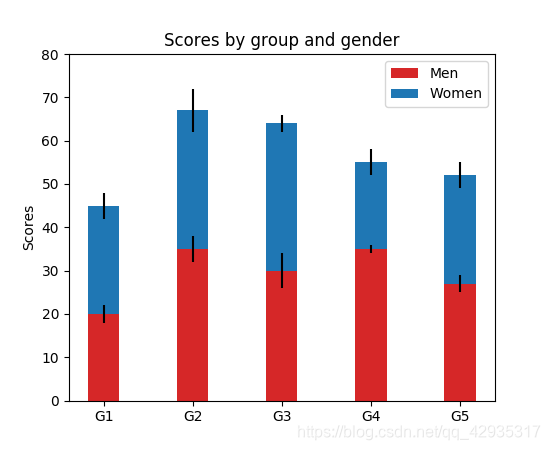
 这段代码展示了如何使用Python的matplotlib库创建一个带有误差线的堆叠柱状图。图表显示了男性和女性在五个不同组别的得分,每个组别都有误差范围。代码中定义了男性和女性的平均得分以及标准差,然后通过plt.bar函数绘制柱状图,并用plt.errorbar添加误差线。最后,设置了图表的标题、标签和图例,以及显示了图表。
绘制带有误差线的柱状图,代码比较简单就不再解释了
# a stacked bar plot with errorbars
import numpy as np
import matplotlib.pyplot as plt


N = 5
menMeans = (20, 35, 30, 35, 27)
womenMeans = (25, 32, 34, 20, 25)

menStd = (2, 3, 4, 1, 2)
womenStd = (3, 5, 2, 3, 3)

ind = np.arange(N)    # the x locations for the groups
width = 0.35       # the width of the bars: can also be len(x) sequence

p1 = plt.bar(ind, menMeans, width, color='#d62728', yerr=menStd)
p2 = plt.bar(ind, womenMeans, width,
             bottom=menMeans, yerr=womenStd)

plt.ylabel('Scores')
plt.title('Scores by group and gender')
plt.xticks(ind, ('G1', 'G2', 'G3', 'G4', 'G5'))
plt.yticks(np.arange(0, 81, 10))
plt.legend((p1[0], p2[0]), ('Men', 'Women'))

plt.show(
代码运行效果如下


 1179
1179

 被折叠的 条评论
为什么被折叠?
被折叠的 条评论
为什么被折叠?
 到【灌水乐园】发言


