


clear all;close all;
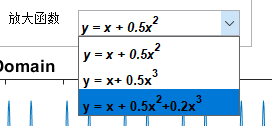
dd = {'<html><b><font color ="black"> y = x + 0.5x<sup>2</sup></b>';
'<html><b><font color ="black"> y = x+ 0.5x<sup>3</sup></b>';
'<html><b><font color ="black"> y = x + 0.5x<sup>2</sup>+0.2x<sup>3</sup></b>'};
figure('name','','menubar','none','numbertitle','off',...
'position',[600 200 600 600],'color',[1 1 1]);
pp = uipanel('parent',gcf,'Title','参数选择','units',...
'pixel','position',[10 550 500 50],'Backgroundcolor',[1 1 1]);
ff1=uicontrol('parent',pp,'style','popupmenu','string',num2str([1:10]'),...
'position',[50 0 50 30],'units','pixel' ,'foregroundcolor',[0 0 0],'fontsize',8,...
'Value',3,'callback',@getf);
ff2=uicontrol('parent',pp,'style','popupmenu','string',num2str([1:10]'),'Backgroundcolor',[1 1 1],...
'position',[150 0 50 30],'units','pixel' ,'foregroundcolor',[0 0 0],'fontsize',8,...
'Value',5,'callback',@getf);
fff1=uicontrol('parent',pp,'style','text','string','F1(Hz)','Backgroundcolor',[1 1 1],...
'position',[5 0 50 30],'units','pixel' ,'foregroundcolor',[0 0 0],'fontsize',8);
fff2=uicontrol('parent',pp,'style','text','string','F2(Hz)','Backgroundcolor',[1 1 1],...
'position',[100 0 50 30],'units','pixel' ,'foregroundcolor',[0 0 0],'fontsize',8);
fff3=uicontrol('parent',pp,'style','text','string','放大函数','Backgroundcolor',[1 1 1],...
'position',[300 0 50 30],'units','pixel' ,'foregroundcolor',[0 0 0],'fontsize',8);
fff33=uicontrol('parent',pp,'style','popupmenu','string',dd,'Backgroundcolor',[1 1 1],...
'position',[360 0 130 30],'units','pixel' ,'foregroundcolor',[0 0 0],'fontsize',8,...
'callback',@getf);
%% 参数设置
% 两个正弦波叠加,频率分别为3Hz和5Hz
warning off
global f1 f2 ff1 ff2 fff33
fs = 100;
ts = 1/fs;
t = 0:ts:10;
f1 = ff1.Value;
f2 = ff2.Value;
sig1 = sin(2*pi*f2*t)+sin(2*pi*f1*t);
signal = sig1+0.5*sig1.*sig1;
% signal = repmat(sig2,1,10);
len = length(signal);
df = fs/len;%频域间隔
spectrum = fftshift(abs(fft(signal)));
subplot(2,1,1);%两行一列分图,第一幅图
plot(t,signal);
get(gca,'position');
set(gca,'position',[ 0.1300 0.5338 0.7750 0.3412])
title('timeDomain');
subplot(2,1,2);
spectrum = spectrum(round(len/2):len);
stem(0:df:df*(len-round(len/2)),spectrum,'MarkerSize',2);%横坐标修正的单边频谱
get(gca,'position');
set(gca,'position',[0.1300 0.08 0.7750 0.3412])
title('frequenceDomain');
[yy xx] = findpeaks(spectrum);
for i =1:length(xx)
text((xx(i)+2)*df,yy(i),[num2str(round(xx(i)/10))])
end
%%
function getf(~,~)
global f1 f2 ff1 ff2 fff33
f1 = ff1.Value;
f2 = ff2.Value;
coeffient = fff33.Value;
fs = 100;
ts = 1/fs;
t = 0:ts:10;
f1 = ff1.Value;
f2 = ff2.Value;
sig1 = sin(2*pi*f2*t)+sin(2*pi*f1*t);
if coeffient == 1
signal = sig1+0.5*sig1.*sig1;
elseif coeffient == 2
signal = sig1+0.5*sig1.*sig1.*sig1;
else
signal = sig1+0.2*sig1.*sig1.*sig1+0.5*sig1.*sig1;
end
% signal = repmat(sig2,1,10);
len = length(signal);
df = fs/len;%频域间隔
spectrum = fftshift(abs(fft(signal)));
subplot(2,1,1);%两行一列分图,第一幅图
plot(t,signal);
get(gca,'position');
set(gca,'position',[ 0.1300 0.5338 0.7750 0.3412])
title('timeDomain');
subplot(2,1,2);
spectrum = spectrum(round(len/2):len);
stem(0:df:df*(len-round(len/2)),spectrum,'MarkerSize',2);%横坐标修正的单边频谱
get(gca,'position');
set(gca,'position',[0.1300 0.08 0.7750 0.3412])
title('frequenceDomain');
[yy xx] = findpeaks(spectrum);
for i =1:length(xx)
text((xx(i)+2)*df,yy(i),[num2str(round(xx(i)/10))])
end
end

重点看这里:
dd = {'<html><b><font color ="black"> y = x + 0.5x<sup>2</sup></b>';
    '<html><b><font color ="black"> y = x+ 0.5x<sup>3</sup></b>';
    '<html><b><font color ="black"> y = x + 0.5x<sup>2</sup>+0.2x<sup>3</sup></b>'};
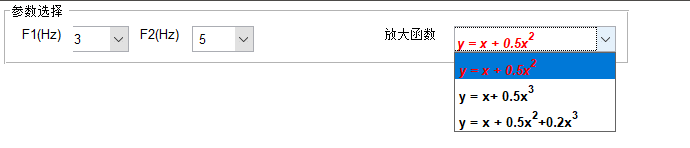
在MATLAB中,只有少数地方能够用LaTeX语言控制文本,在一般的Text里面还需要用HTML来控制,例如:
dd = {'<html><b><em><font color ="black"> y = x + 0.5x<sup>2</sup></b></em>';%<em>表示斜体强调
    '<html><b><font color ="black"> y = x+ 0.5x<sup>3</sup></b>';
    '<html><b><font color ="black"> y = x + 0.5x<sup>2</sup>+0.2x<sup>3</sup></b>'};
第一行为斜体加粗,第二行为斜体
<sup>3</sup> 表示上标
<sub>3</sub> 表示下标
<b>This text is bold</b> 表示加粗
<i>This text is italic</i> 斜体
<small>This text is small</small> 小字号
<big>This text is big</big> 大字号
更多属性查看


 1805
1805


 被折叠的 条评论
为什么被折叠?
被折叠的 条评论
为什么被折叠?
 到【灌水乐园】发言


