


这是我们python课程要求我们制作一个项目,用python爬取结果并作数据展示。我们使用requests的方法对房价的信息做了爬取,一下就是我们所爬取的网页

我们做这个项目主要分为以下几个步骤
1 网页爬取过程
我们使用类的方法经行了封装在直接输入城市名的时候就可以直接get到数据
class reptile:
    def __init__(self):
        self.__city = '天津'
        self.__header = {
            'User-Agent': 'Mozilla/5.0 (Windows NT 10.0; Win64; x64) AppleWebKit/537.36 (KHTML, like Gecko) Chrome/96.0.4664.55 Safari/537.36 Edg/96.0.1054.43'
        }

    def up_data(self, city):
        if city != '':
            self.__city = city
        else:
            print('没有得到新的城市名。')

    def write_in(self, data, *, fileName='', title='', time=False):
        # 数据写入
        flag = False
        with open(fileName, 'w', encoding='utf-8') as fp:
            if not title == '':
                fp.write(title + '\n')
            if time:
                for i, j in data:
                    if flag:
                        fp.write('\n')
                    else:
                        flag = True
                    fp.write(str(get_really_time(i)) + ':')
                    fp.write(str(j))
            else:
                for i, j in data.items():
                    if flag:
                        fp.write('\n')
                    else:
                        flag = True
                    fp.write(i + ' ')
                    for k in j:
                        fp.write(k + ' ')


    def show_all(self):
        oneyear_m()
        main()

    def get_photo_data(self):  # 获取目标城市的总体价格走势图的数据
        url = 'http://' + get_first(self.__city) + '.fangjia.com/trend/yearData?'
        param = {
            'defaultCityName': self.__city,
            'districtName': '',
            'region': '',
            'block': '',
            'keyword': ''
        }
        res = requests.get(url=url, params=param, headers=self.__header).json()
        data = res['series']
        d = data[0]['data']
        # 文件写入
        self.write_in(d, fileName='zoushi.txt', time=True)

    def get_which(self, choose='up'):
        url = 'http://' + get_first(self.__city) + '.fangjia.com/zoushi'

        page_txt = requests.get(url=url, headers=self.__header).text
        if choose == 'up':
            ex = '<div class="trend trend03">.*?<tbody>(.*?)<tbody>'
        else:
            ex = '<div class="trend trend03" style="border-bottom:none;">.*?<tbody>(.*?)</tbody>'
        url_list = str(re.findall(ex, page_txt, re.S)[0])
        ex = '<tr class=".*?">(.*?)</tr>'
        all = str(re.findall(ex, url_list, re.S))
        ex_name = '<td class="td02"><a href=".*?">(.*?)</a></td>'
        ex_data = '<td>(.*?)</td>'
        need_name = re.findall(ex_name, all, re.S)
        need_data = re.findall(ex_data, all, re.S)
        need_data = [i for i in need_data if not i == '元/㎡' and not i == '周度']
        d = {}
        i = 1
        for house_name in need_name:
            d[house_name] = need_data[4 * (i - 1):4 * i]
            i += 1
        self.write_in(d, fileName='data_' + choose + '.txt')
2 数据可视化
我们主要爬取的内容包括了房价的走势,上月的价格,本月的价格,和历史最高的价格和涨幅,等信息做了爬取并用matplotlib 画出了一个折线图并将其保存下来结果呈现 。以成都为例 爬取成都一年来的房价走势。
def oneyear_m():
    x = []
    y = []
    with open("zoushi.txt", 'r', encoding='utf-8') as data1:
        for line in data1.read().split("\n"):
            data1_line = line.split(":")
            x.append(data1_line[0][5:])
            y.append(int(data1_line[1]))
    plt.figure(figsize=(28, 10))
    plt.title('一年变化图')  # 折线图标题
    plt.rcParams['font.sans-serif'] = ['SimHei']  # 显示汉字
    plt.xlabel('时间')  # x轴标题
    plt.ylabel('价格   (元/㎡)')  # y轴标题
    plt.plot(x, y, marker='o', markersize=5)  # 绘制折线图,添加数据点,设置点的大小
    for a, b in zip(x, y):
        plt.text(a, b, b, ha='center', va='bottom', fontsize=10)  # 设置数据标签位置及大小
    plt.legend(['走势'])  # 设置折线名称
    plt.savefig('一年变化图.jpg')
    plt.show()
同时在建立其他几个项目的同时我们直接定义了一个函数将需要的参数传入函数进行画图避免了一个图一个函数导致的代码冗余
def paint(x, y,flag):  # 小区上月价格折线图
    plt.figure(figsize=(10, 5))
    plt.title(flag)  # 折线图标题
    plt.rcParams['font.sans-serif'] = ['SimHei']  # 显示汉字
    plt.xlabel('时间')  # x轴标题
    plt.ylabel('价格   (元/㎡)')  # y轴标题
    plt.plot(x, y, marker='o', markersize=5)  # 绘制折线图,添加数据点,设置点的大小
    for a, b in zip(x, y):
        plt.text(a, b, b, ha='center', va='bottom', fontsize=10)  # 设置数据标签位置及大小
    plt.legend(['方案'])  # 设置折线名称
    plt.savefig(flag+'.jpg')
    plt.show()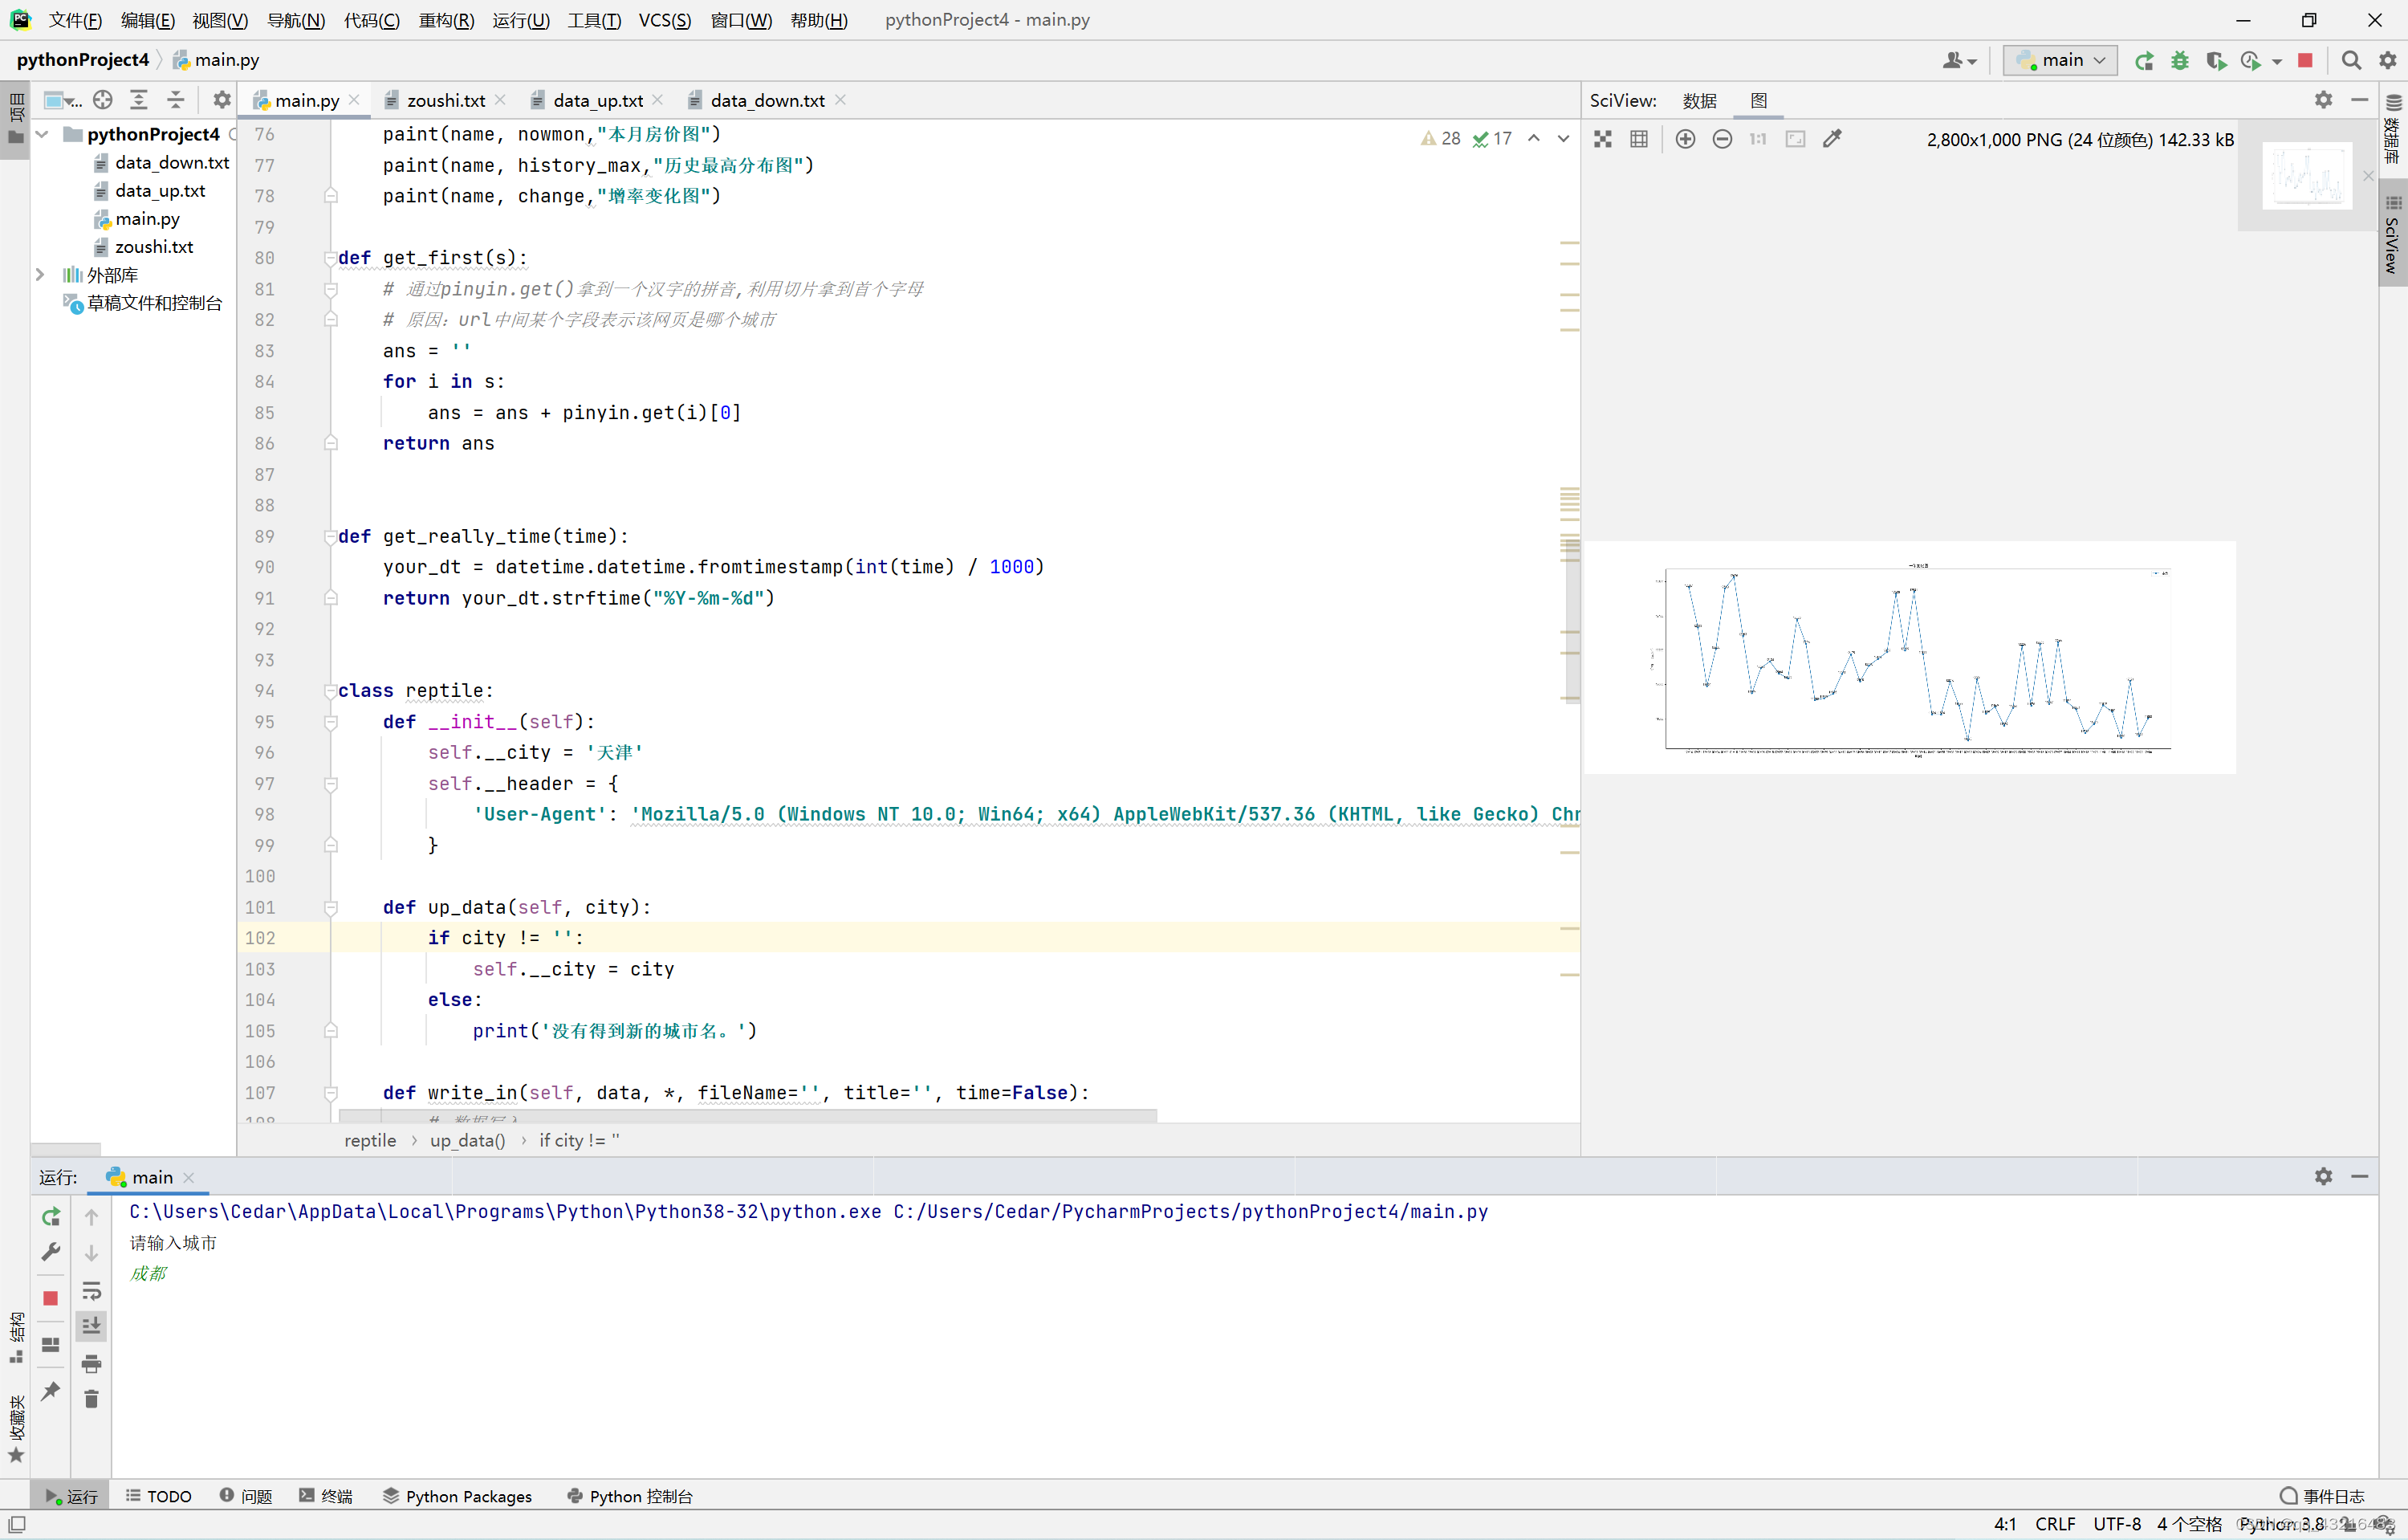
其他的爬取结果展示如下:

3. 我们在制作这个项目的时候也遇到了一些常见的问题供大家分享:
比如我么在分析数据的时候使用了正则表达式,在使用正则表达式的过程中会遇到很多的问题,不是很好处理。在这里可以推荐使用BeautifulSoup的方法会更加简单如果大家需要学习正则表达式推荐一个文章 正则表达式 或者 是学习使用BeautifulSoup的方法这两篇博客都是比较推荐的解析的方法
还有个问题就是在使用matplotlib画图并保存的时候需要注意 plt.savefig()需要放在
plt.show()的前面,不然会导致生成出来的图片是空白,我们开始就遇到了这个问题,生成的图片一直是空白,后面才发现更改了之后一下就生成了一张折线图
下面更新了画图的方式
我们之前使用的matplotlib的方法来画折线图,后来发现不是特别好,于是我们改成了 pygal 库的方法来画图更新画图主题部分如下:
def paint(x, y, y1, y2, name1, name2, name3, types):  # 小区上月价格折线图
    line_chart = pygal.Line(x_label_rotation=250, height=250, show_minor_x_labels=True, style=NeonStyle)
    line_chart.title = types + "房价分析"
    line_chart.x_labels = x
    line_chart.x_labels_major = x
    line_chart.add(name1, y)
    line_chart.add(name2, y1)
    line_chart.add(name3, y2)
    line_chart.render_to_file(types + "房价分析" + '.html')
整体代码
import datetime
import requests
import pinyin
import re
import os
from pygal.style import NeonStyle
import pygal

line_chart = pygal.Bar(height=250, style=NeonStyle)


def oneyear_m():
    x = []
    y = []
    line_chart = pygal.Line(x_label_rotation=250, height=250, show_minor_x_labels=True, style=NeonStyle)
    with open("zoushi.txt", 'r', encoding='utf-8') as data1:
        for line in data1.read().split("\n"):
            data1_line = line.split(":")
            x.append(data1_line[0][5:])
            y.append(int(data1_line[1]))
    line_chart.title = '房价走势'
    line_chart.x_labels = x
    line_chart.x_labels_major = x[::10]
    line_chart.add('年变化图', y)
    line_chart.render_to_file("data.html")


def paint(x, y, y1, y2, name1, name2, name3, types):  #
    line_chart = pygal.Line(x_label_rotation=250, height=250, show_minor_x_labels=True, style=NeonStyle)
    line_chart.title = types + "房价分析"
    line_chart.x_labels = x
    line_chart.x_labels_major = x
    line_chart.add(name1, y)
    line_chart.add(name2, y1)
    line_chart.add(name3, y2)
    line_chart.render_to_file(types + "房价分析" + '.html')


def paint_s(x, y, name, types):
    line_chart = pygal.Line(x_label_rotation=250, height=250, show_minor_x_labels=True, style=NeonStyle)
    line_chart.title = types + name
    line_chart.x_labels = x
    line_chart.x_labels_major = x[::10]
    line_chart.add(types + name, y)
    # html = HTML(base_html.format(rendered_chart=line_chart.render(is_unicode=True)))
    line_chart.render_to_file(types + name + '.html')


def getdata_txt(txt):
    name = []
    lastmon = []
    nowmon = []
    history_max = []
    change = []
    for line in txt.read().split("\n"):
        lines = line.split(" ")
        name.append(lines[0])
        lastmon.append(int(lines[1]))
        nowmon.append(int(lines[2]))
        history_max.append(int(lines[3]))
        front = int(lines[1])
        end = int(lines[2])
        if front > end:
            temp = front - end
            change.append(-round(float(temp / front), 4))
        else:
            temp = end - front
            change.append(round(float(temp / front), 4))
    return name, lastmon, nowmon, history_max, change


def main():
    txt = open("data_up.txt", "r", encoding='utf-8')
    name, lastmon, nowmon, history_max, change = getdata_txt(txt)
    paint(name, lastmon, nowmon, history_max, "上月房价图", "本月房价图", "历史最高房价", "涨价")
    paint_s(name, change, "增率变化图", "涨价")
    txt = open("data_down.txt", "r", encoding='utf-8')
    name, lastmon, nowmon, history_max, change = getdata_txt(txt)
    paint(name, lastmon, nowmon, history_max, "上月房价图", "本月房价图", "历史最高房价", "降价")
    paint_s(name, change, "增率变化图", "降价")


def get_first(s):
    # 通过pinyin.get()拿到一个汉字的拼音,利用切片拿到首个字母
    # 原因:url中间某个字段表示该网页是哪个城市
    ans = ''
    for i in s:
        if i == '重':
            ans = ans + 'c'
        else:
            ans = ans + pinyin.get(i)[0]
    return ans


def get_really_time(time):
    # 从AJAX拿到的时间数据是距离1970-1-1的毫秒数值,需要转换。
    your_dt = datetime.datetime.fromtimestamp(int(time) / 1000)
    return your_dt.strftime("%Y-%m-%d")


class reptile:
    def __init__(self):
        # 默认城市是天津,防止出现没有正确输入导致爬取失败
        self.__city = '天津'
        self.__header = {
            'User-Agent': 'Mozilla/5.0 (Windows NT 10.0; Win64; x64) AppleWebKit/537.36 (KHTML, like Gecko) Chrome/96.0.4664.55 Safari/537.36 Edg/96.0.1054.43'
        }

    def up_data(self, city):
        # 更新爬取的城市
        if city != '':
            self.__city = city
        else:
            print('没有得到新的城市名。')

    def write_in(self, data, *, fileName='', title='', time=False):
        # data是需要写入的数据,fileName是文件路径名包括文件格式
        # title是文件写入的第一行数据,用于记录从网页上拿取的数据都是什么含义
        # time只是我用来标记是否是走势的数据
        # 数据写入
        flag = False
        with open(fileName, 'w', encoding='utf-8') as fp:
            if not title == '':
                fp.write(title + '\n')
            if time:
                for i, j in data:
                    if flag:
                        fp.write('\n')
                    else:
                        flag = True
                    fp.write(str(get_really_time(i)) + ':')
                    fp.write(str(j))
            else:
                for i, j in data.items():
                    if flag:
                        fp.write('\n')
                    else:
                        flag = True
                    fp.write(i + ' ')
                    for k in j:
                        fp.write(k + ' ')

    def show_all(self):
        # 小组成员写的展示,封装进来
        oneyear_m()
        main()

    def get_photo_data(self):  # 获取目标城市的总体价格走势图的数据
        # 得到url
        url = 'http://' + get_first(self.__city) + '.fangjia.com/trend/yearData?'
        # 总体价格走势的数据是一个AJAX的请求,需要对应的参数,装在字典param
        param = {
            'defaultCityName': self.__city,
            'districtName': '',
            'region': '',
            'block': '',
            'keyword': ''
        }
        # 发起get请求,通过json拿到数据对象
        res = requests.get(url=url, params=param, headers=self.__header).json()
        # 将对象中key为series中的值拿出来
        data = res['series']
        d = data[0]['data']
        # 文件写入
        self.write_in(d, fileName='zoushi.txt', time=True)

    def get_which(self, choose='up'):
        # choose只是我用来标识爬取涨幅还是跌幅的数据标记
        # 因为涨幅和跌幅在第一次爬取片段的时候需要些的正则表达式不一样
        url = 'http://' + get_first(self.__city) + '.fangjia.com/zoushi'

        page_txt = requests.get(url=url, headers=self.__header).text
        # 选择正则表达式
        if choose == 'up':
            ex = '<div class="trend trend03">.*?<tbody>(.*?)<tbody>'
        else:
            ex = '<div class="trend trend03" style="border-bottom:none;">.*?<tbody>(.*?)</tbody>'
        url_list = str(re.findall(ex, page_txt, re.S)[0])
        ex = '<tr class=".*?">(.*?)</tr>'
        all = str(re.findall(ex, url_list, re.S))
        ex_name = '<td class="td02"><a href=".*?">(.*?)</a></td>'
        ex_data = '<td>(.*?)</td>'
        need_name = re.findall(ex_name, all, re.S)
        need_data = re.findall(ex_data, all, re.S)
        # 不要一些没用的字段
        need_data = [i for i in need_data if not i == '元/㎡' and not i == '周度']
        d = {}
        i = 1
        for house_name in need_name:
            d[house_name] = need_data[4 * (i - 1):4 * i]
            i += 1
        self.write_in(d, fileName='data_' + choose + '.txt')


if __name__ == '__main__':  # 程序入口

    a = reptile()
    postion = input("请输入城市\n")

    if not os.path.exists(postion):
        os.mkdir(postion)
    os.chdir(postion)
    a.up_data(postion)
    a.get_which()
    a.get_which('down')
    a.get_photo_data()
    a.show_all()
这篇博客本身是用于期末作业,大佬勿喷


 1915
1915


 被折叠的 条评论
为什么被折叠?
被折叠的 条评论
为什么被折叠?
 到【灌水乐园】发言


