


标题
%图标题中显示变量
figure;
a=1;
title(['figure ' num2str(a)]);
一、作图细节与技巧
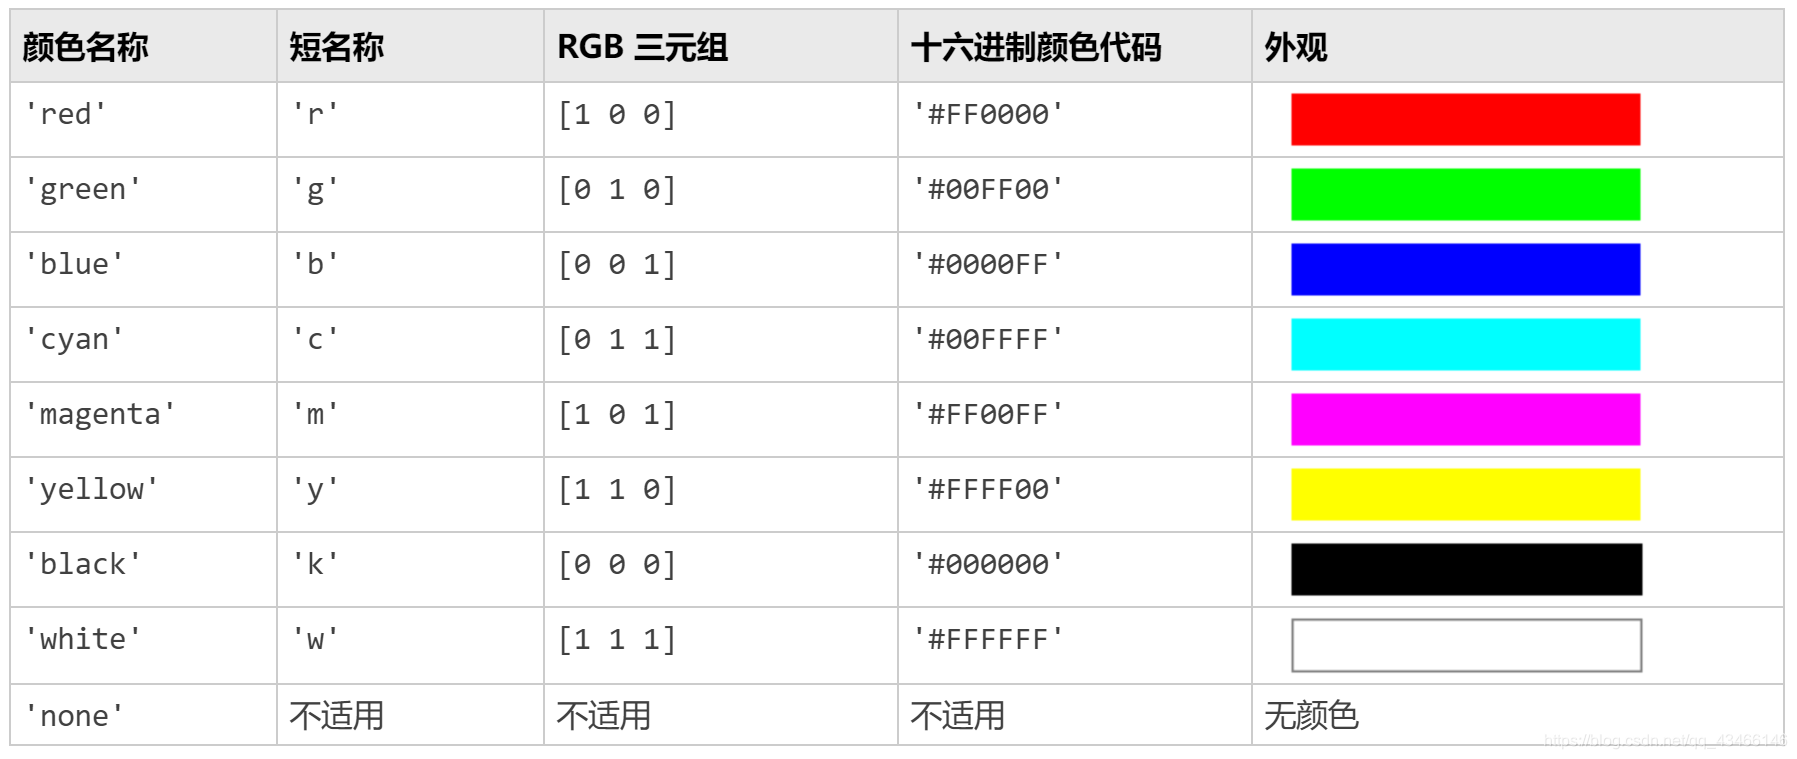
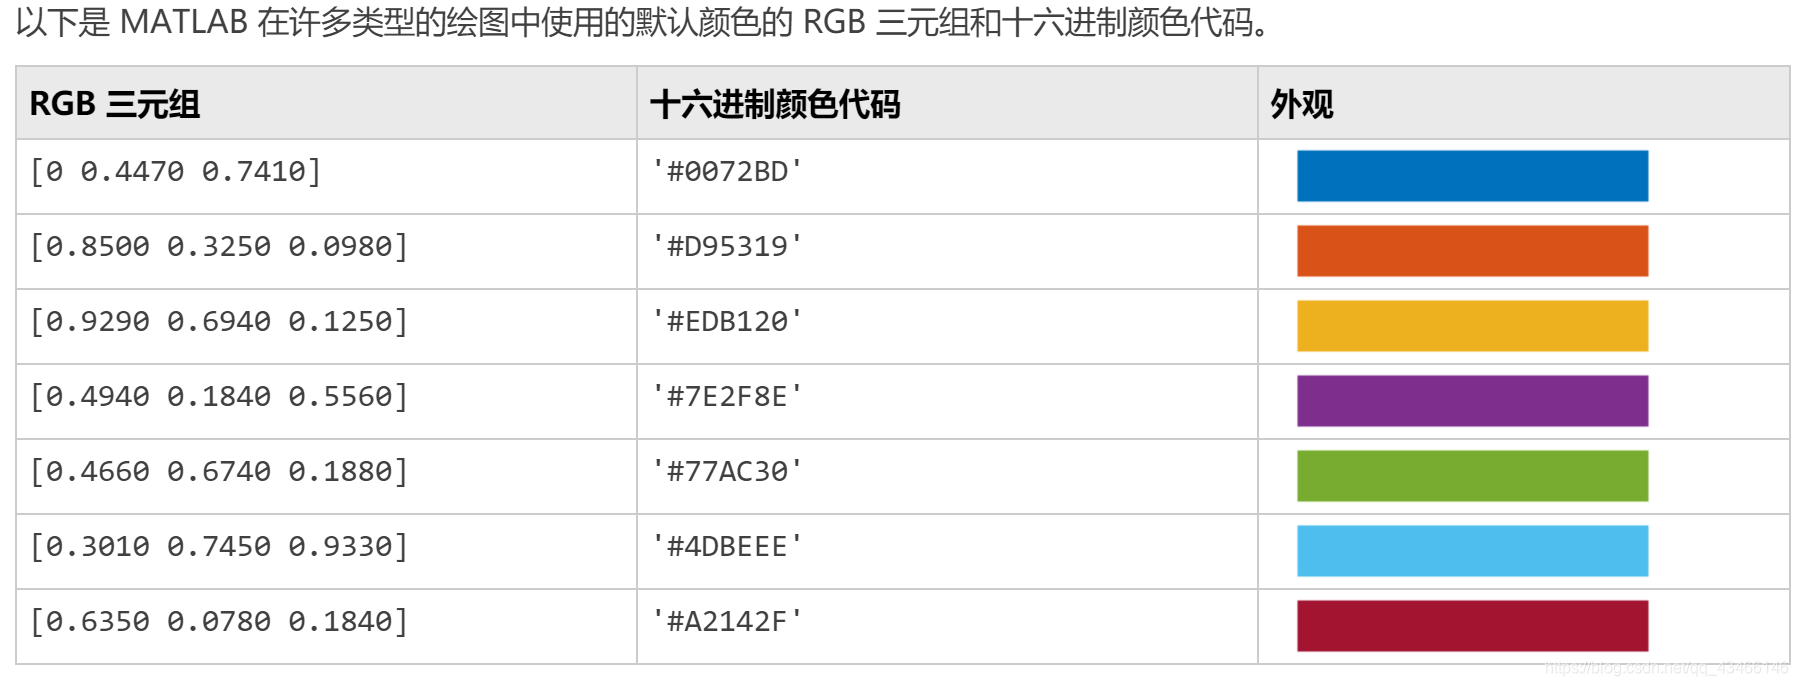
1. 点、线属性
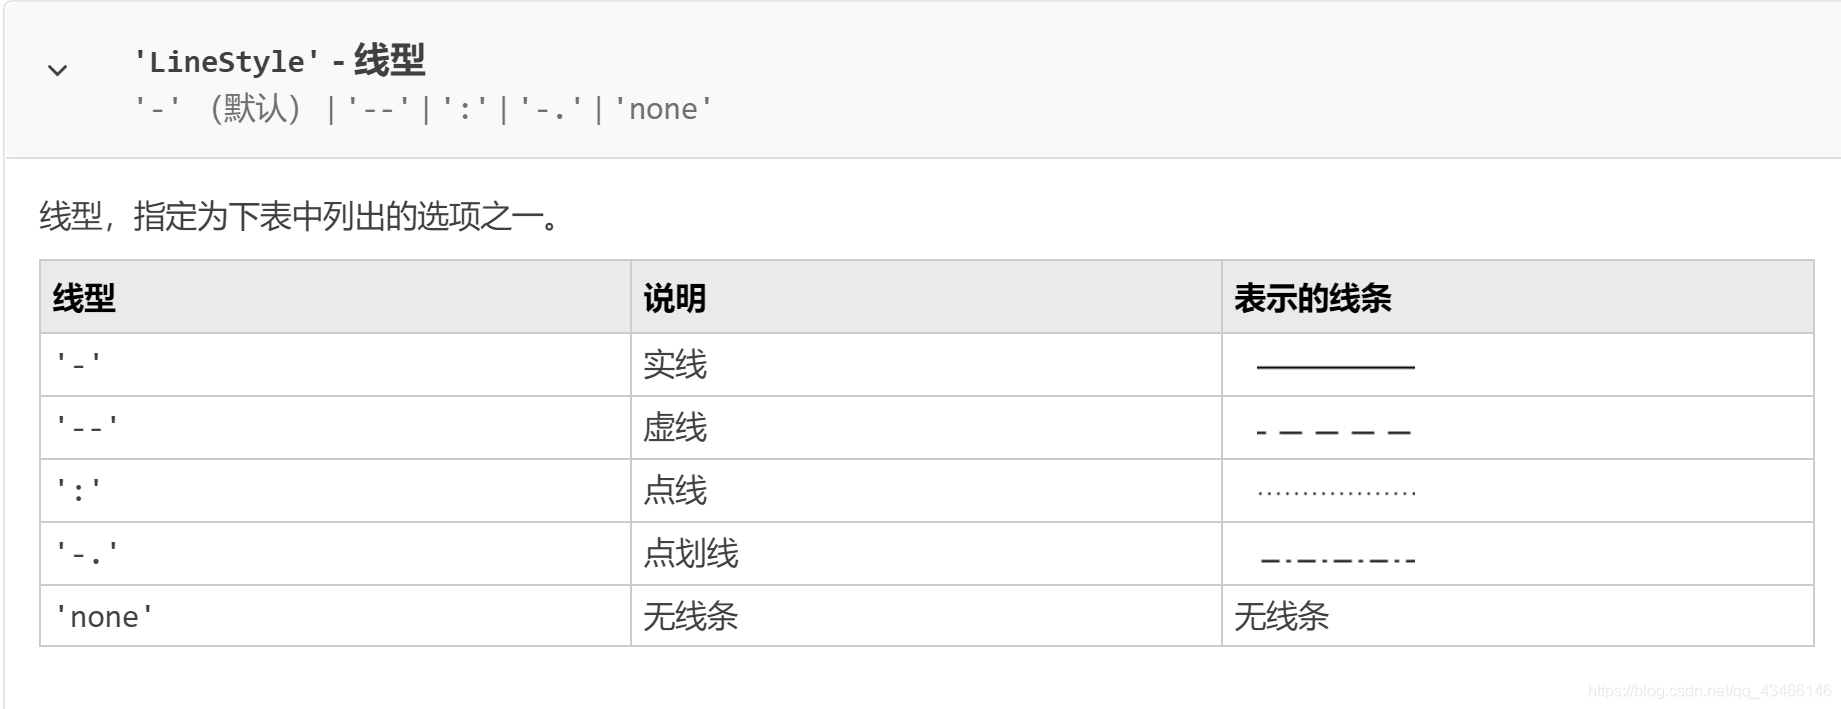
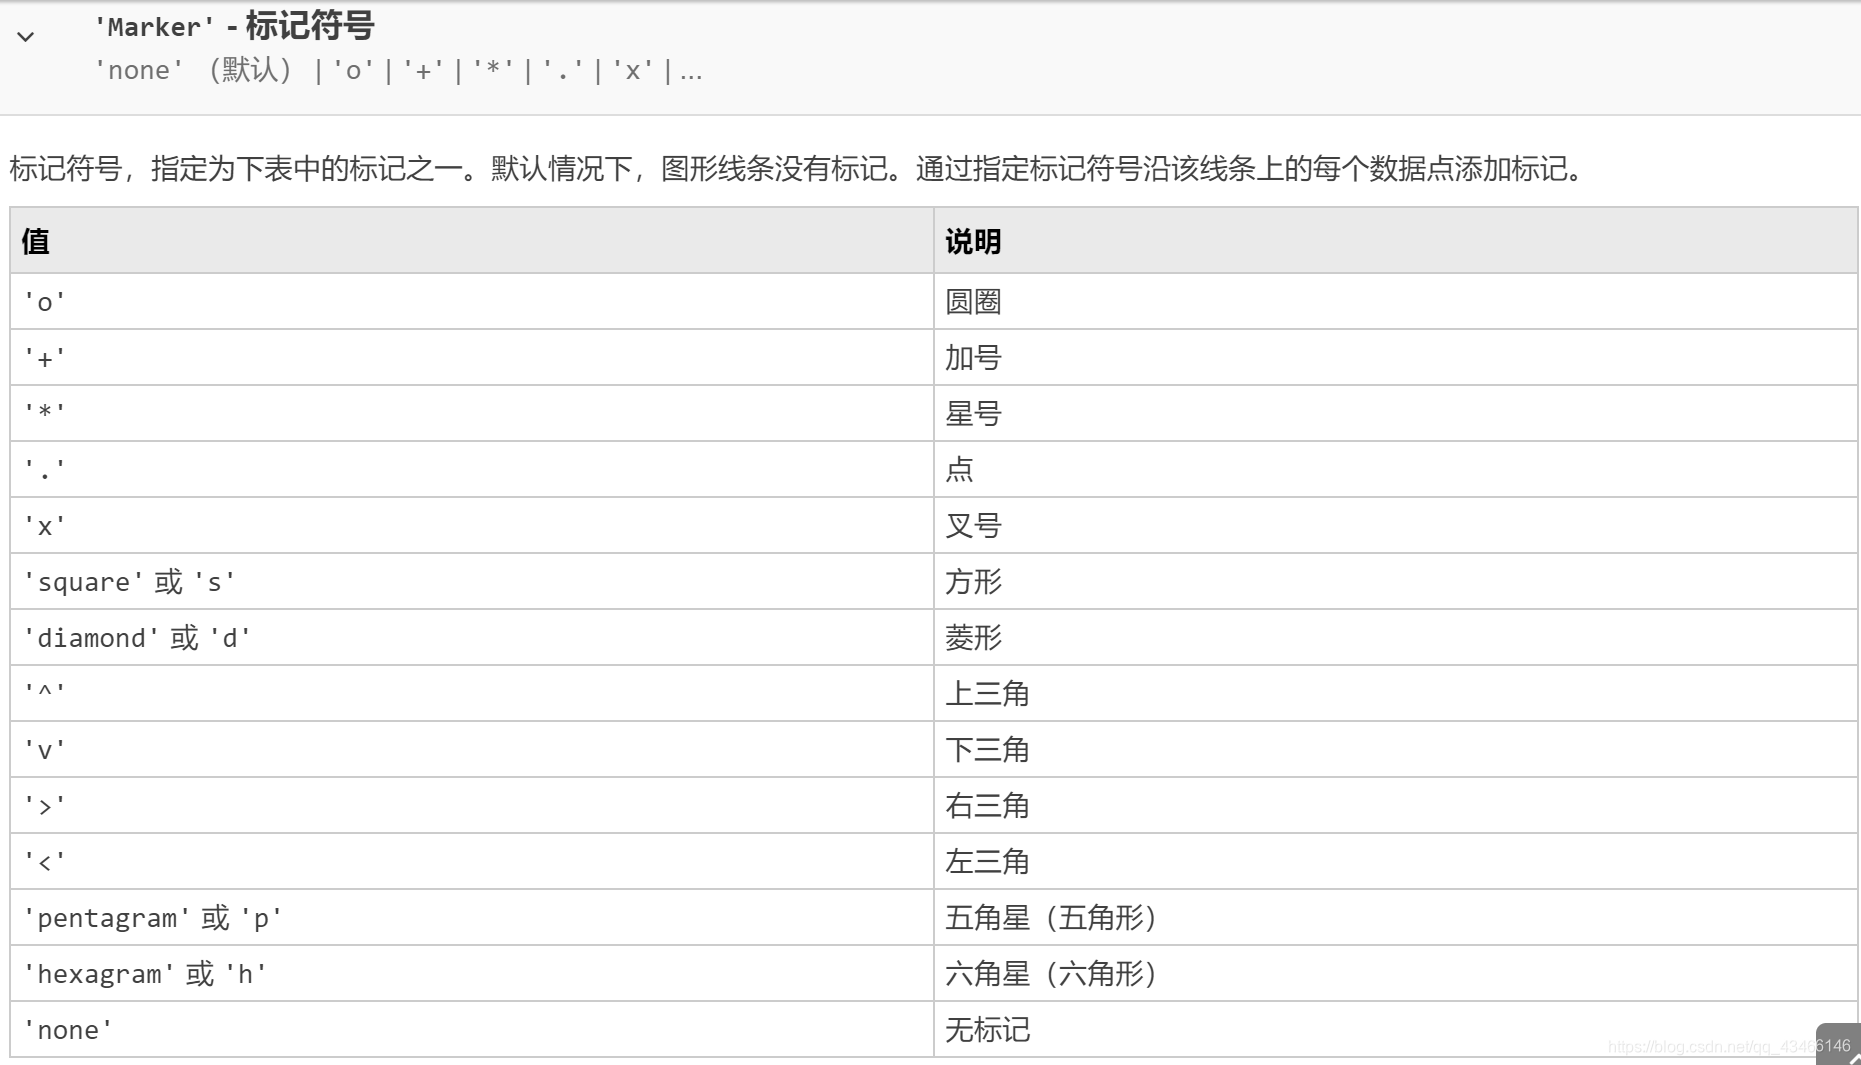
点、线形状颜色选择
2. 画布范围
axis tight;%自动填充整个画布
3. 坐标轴显示方式
(转载自https://jingyan.baidu.com/article/14bd256e4e426cbb6d2612fd.html)
Matlab对矩阵画图时,有两种坐标轴的显示方式 axis ij 和axis xy
axis ij :矩阵轴模式,原点在左上角,i轴是竖直的,由顶至底标数,j轴是水平的,从左往右标数。如图所示。
Matlab默认的也是这种模式,因为它跟矩阵的行列相对应,从左往右,从上而下,第一个数在左上角。i,j的值也正好对应着矩阵的行和列。所以出图后不加 axis ij和axis xy 语句,结果默认为axis ij模式。
 最低0.47元/天 解锁文章


 2801
2801

 被折叠的 条评论
为什么被折叠?
被折叠的 条评论
为什么被折叠?
 到【灌水乐园】发言


