


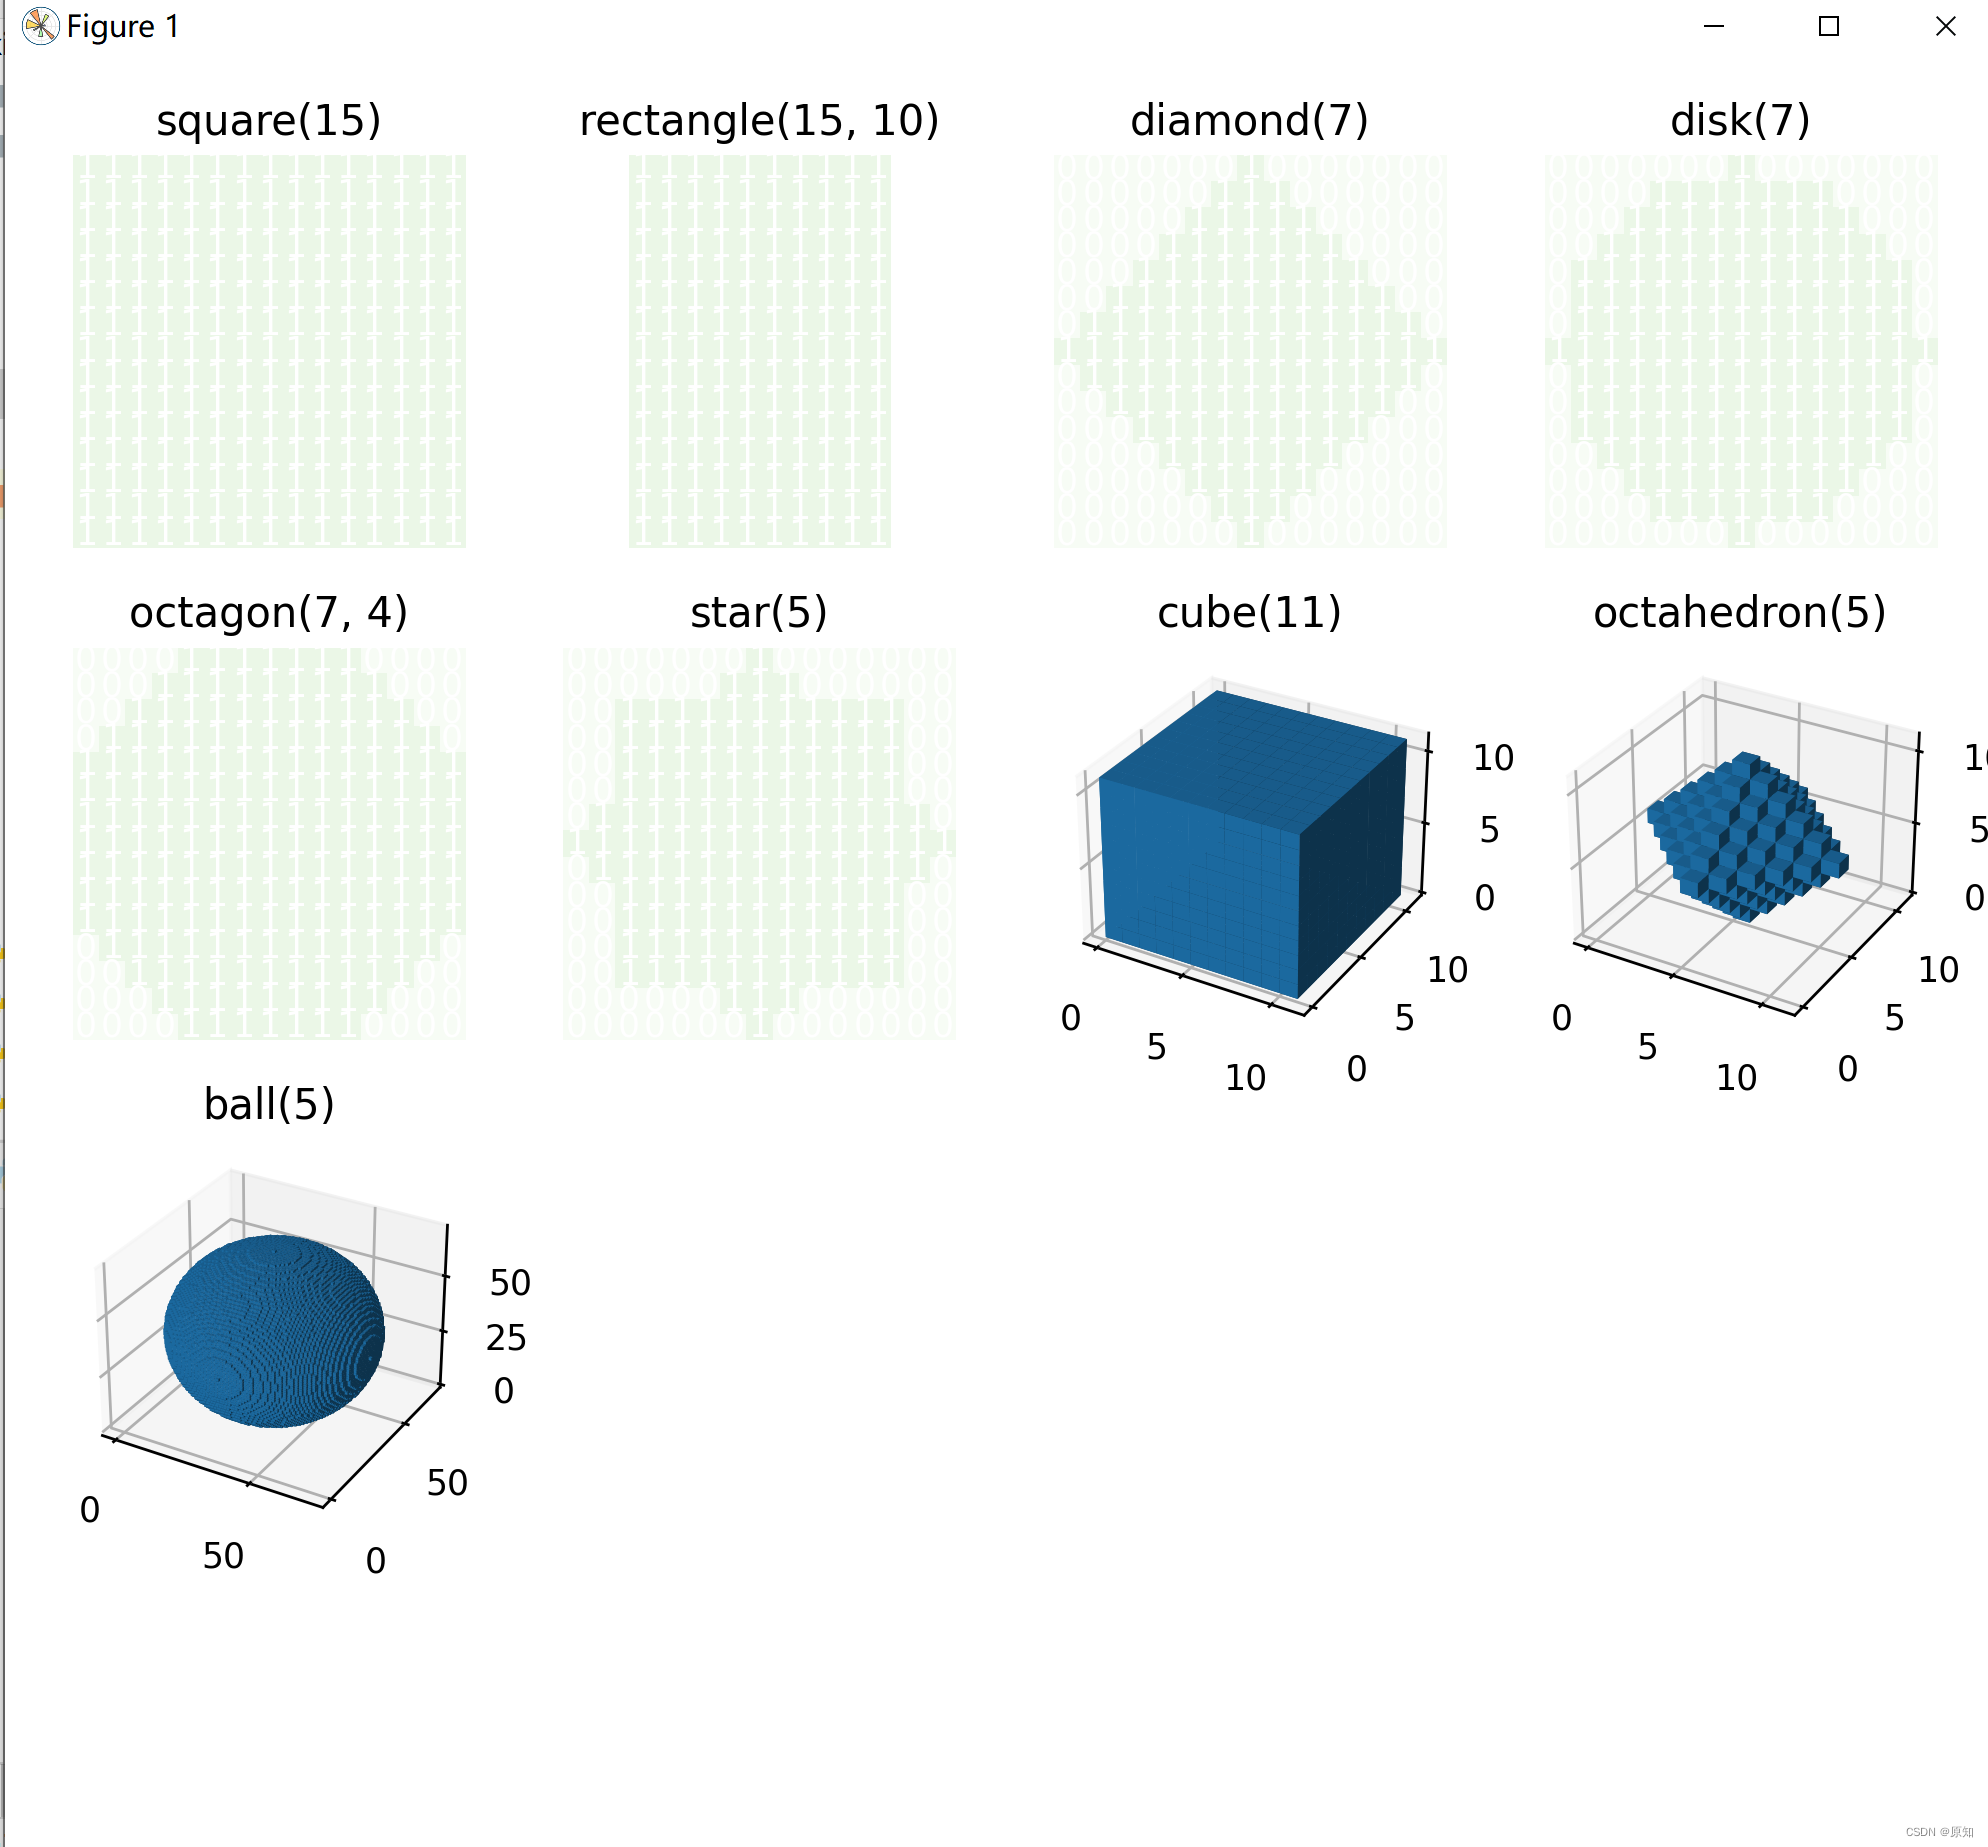
1、生成结构化元素
这个例子展示了如何使用skimage中的函数。生成结构元素的形态学。每个图的标题表示函数的调用。
import numpy as np
import matplotlib.pyplot as plt
from mpl_toolkits.mplot3d import Axes3D

from skimage.morphology import (square, rectangle, diamond, disk, cube,
                                octahedron, ball, octagon, star)
#正方形、长方形、菱形、圆盘、立方体、八面体、球体、八角形、星形
# Generate 2D and 3D structuring elements.
struc_2d = {
    "square(15)": square(15),
    "rectangle(15, 10)": rectangle(15, 10),
    "diamond(7)": diamond(7),
    "disk(7)": disk(7),
    "octagon(7, 4)": octagon(7, 4),
    "star(5)": star(5)
}

struc_3d = {
    "cube(11)": cube(11),
    "octahedron(5)": octahedron(5),
    "ball(5)": ball(35),
"ball(5)": ball(35),
}

# Visualize the elements.
fig = plt.figure(figsize=(8, 8))

idx = 1
#tems()函数以列表返回可遍历的(键值)元组数组。
'''
plt.text(x, y, string, weight="bold", color="b")
x: 注释文本内容所在位置的横坐标
y:注释文本内容所在位置的纵坐标
string:注释文本内容,struc[i, j]为数0、1
weight:注释文本内容的粗细风格
'''
for title, struc in struc_2d.items():
    ax = fig.add_subplot(4, 4, idx)#3行3列,位置为
    ax.imshow(struc, cmap="Greens", vmin=0, vmax=12)#ax参数用于限定数值的范围,只将vmin和vmax之间的值进行映射,用法如下
    for i in range(struc.shape[0]):
        for j in range(struc.shape[1]):
            ax.text(j, i, struc[i, j], ha="center", va="center", color="w")
    ax.set_axis_off()
    ax.set_title(title)
    idx += 1

for title, struc in struc_3d.items():
    ax = fig.add_subplot(4, 4, idx, projection=Axes3D.name)
    ax.voxels(struc)
    ax.set_title(title)
    idx += 1

fig.tight_layout()
plt.show()
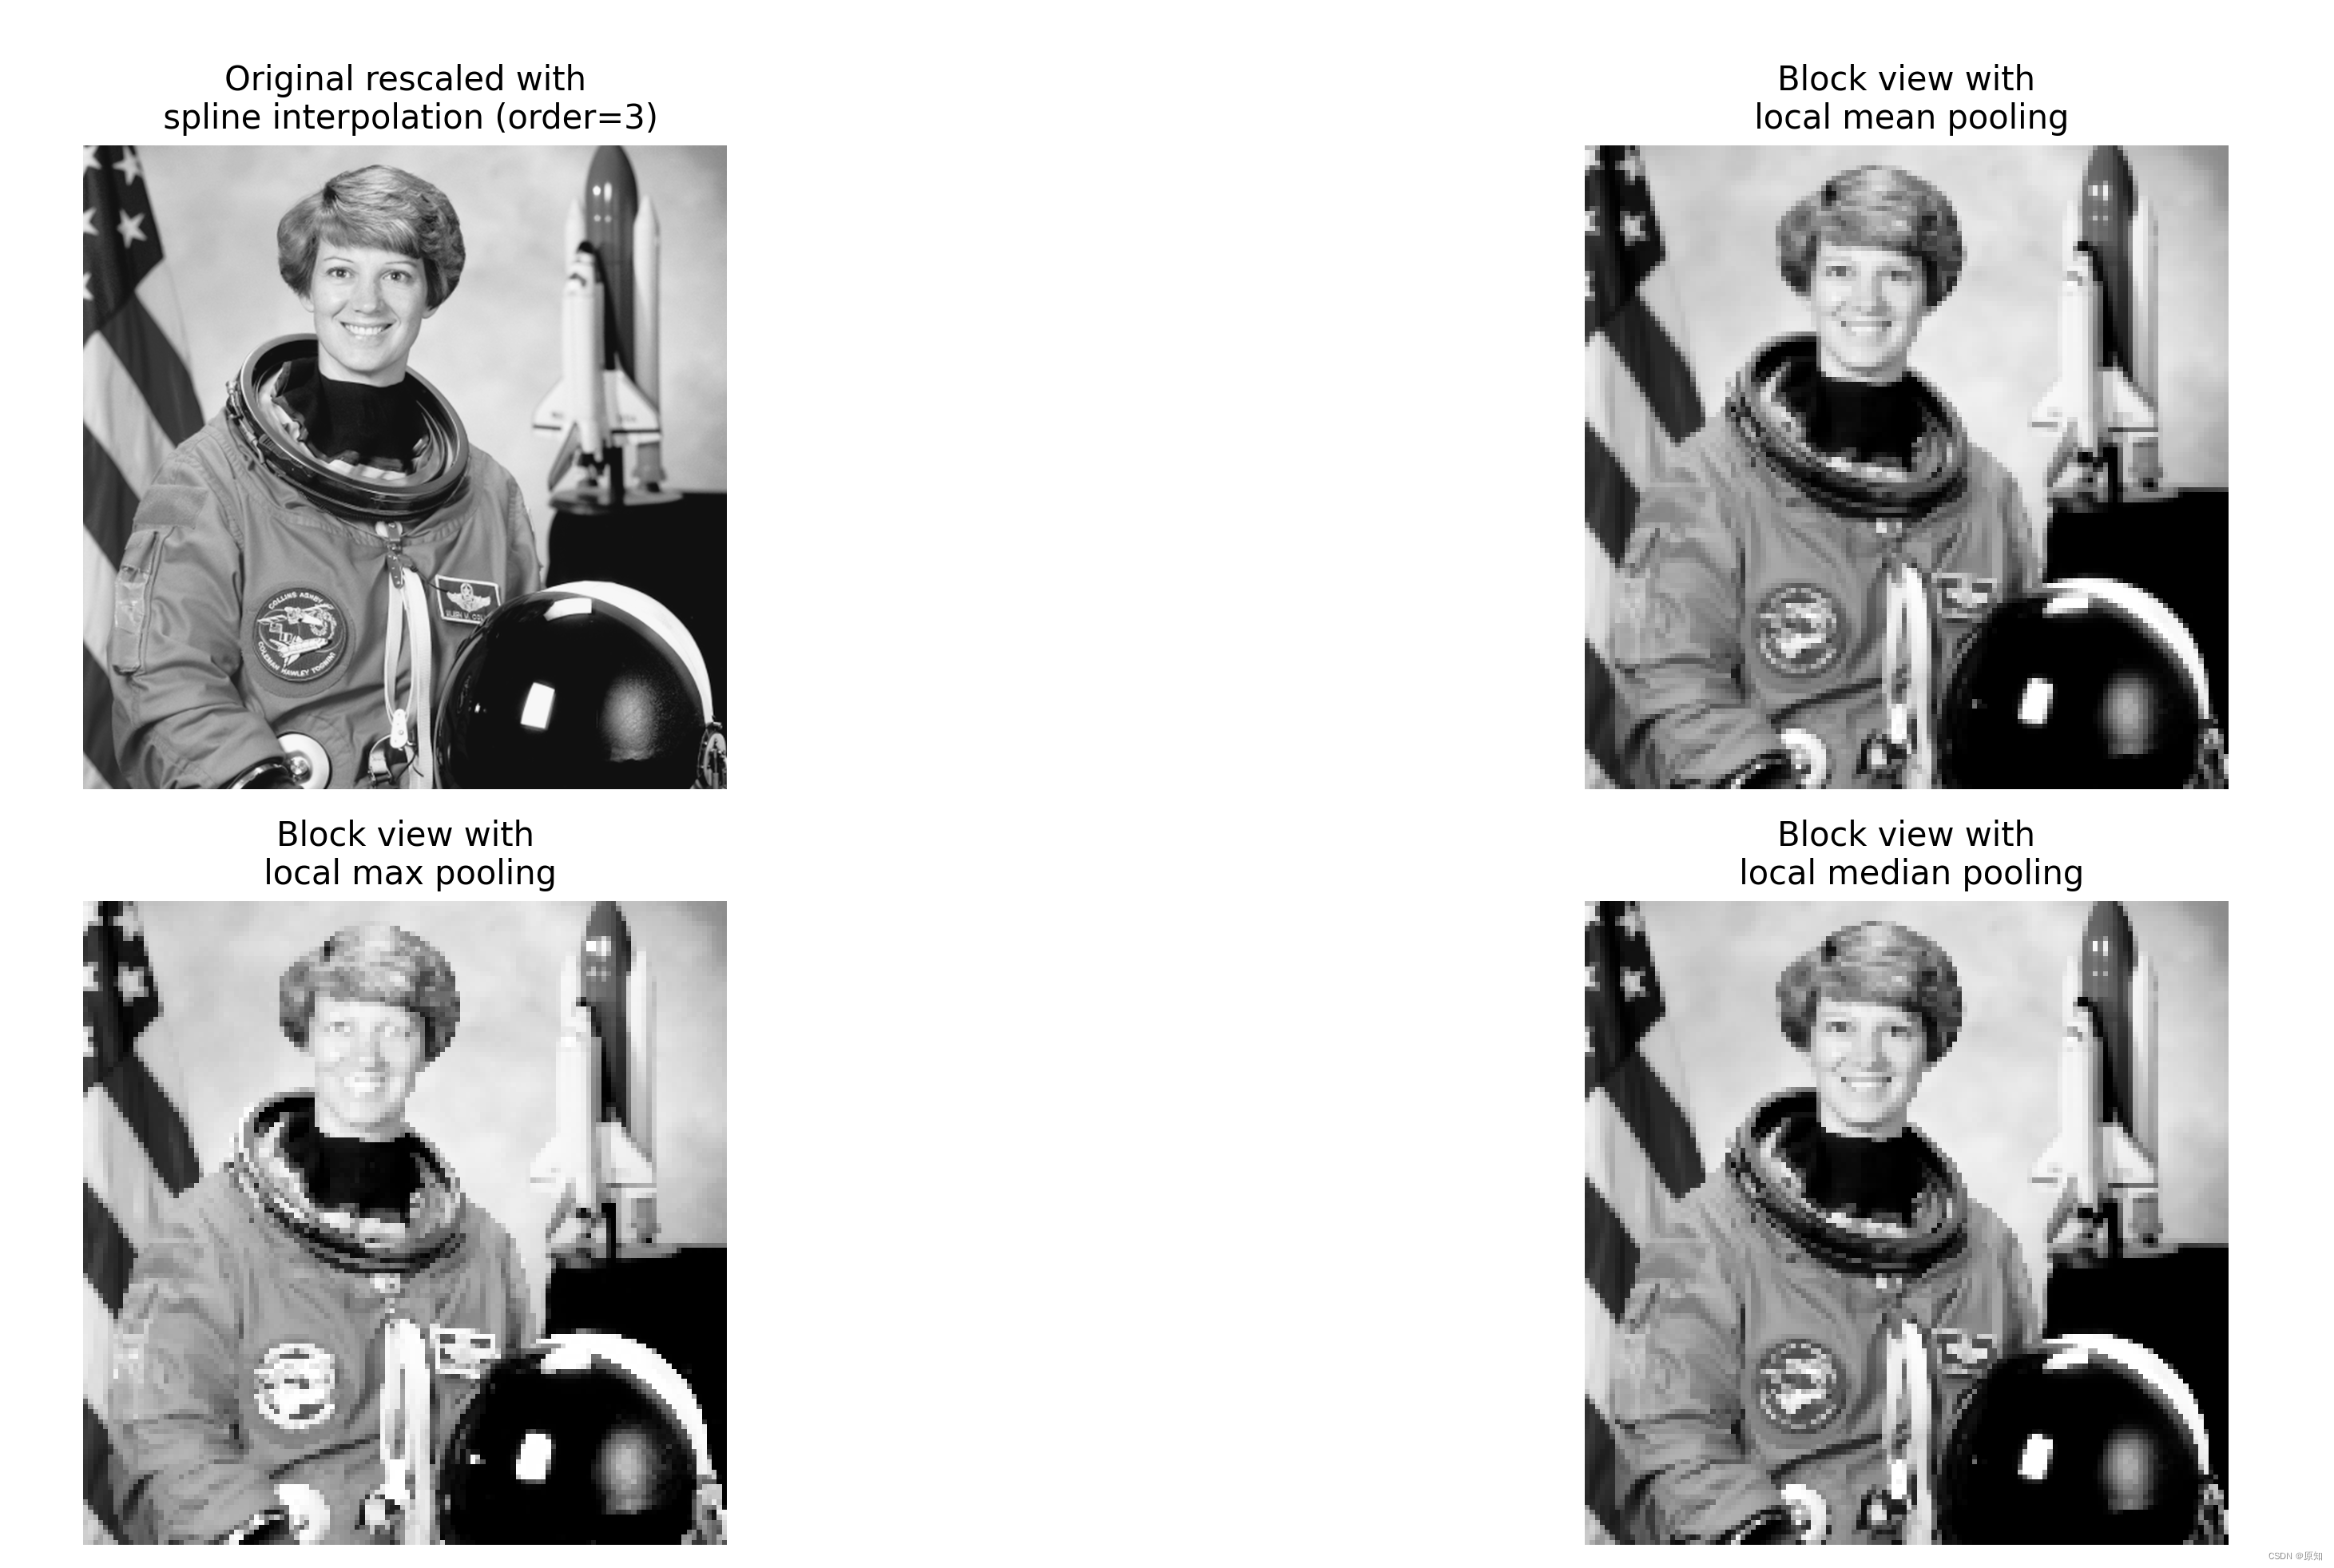
2、图像/阵列上的块视图
这个例子演示了skimage.util()中的view_as_blocks的使用。当一个人想对非重叠图像块执行局部操作时,块视图是非常有用的。我们用skimage中的astronaut。数据,并将其“切分”为方方面面。然后,在每个块上,我们要么汇集该块的平均值,最大值或中值。结果显示在一起,连同一个三阶的样条插值的原始宇航员图像缩放。
import numpy as np
from scipy import ndimage as ndi
from matplotlib import pyplot as plt
import matplotlib.cm as cm

from skimage import data
from skimage import color
from skimage.util import view_as_blocks


# get astronaut from skimage.data in grayscale
l = color.rgb2gray(data.astronaut())
#img=skimage.io.imread('11.jpg',)
#l = color.rgb2gray(img)
# size of blocks
block_shape = (4,4)

#将宇航员图片分为矩阵块(大小为block_shape)
view = view_as_blocks(l, block_shape)

# 最后两个维度合二为一,变为数组方便操作
#img.shape[0]:图像的垂直尺寸(高度) img.shape[1]:图像的水平尺寸(宽度)
flatten_view = view.reshape(view.shape[0], view.shape[1], -1)

# 通过取每个块的“均值”、“最大值”或“中值”重新采样图像。mean()函数功能:求取均值
mean_view = np.mean(flatten_view, axis=2)
max_view = np.max(flatten_view, axis=2)
median_view = np.median(flatten_view, axis=2)

# 画子图,sharex和sharey:表⽰坐标轴的属性是否相同
fig, axes = plt.subplots(2, 2, figsize=(8, 8), sharex=True, sharey=True)
ax = axes.ravel()#将多维数据展平为⼀维数据,它相当于 reshape(-1, order=order) 。

'''
https://vimsky.com/examples/usage/python-scipy.ndimage.zoom.html
https://www.jianshu.com/p/909851f46411
ndi.zoom(input,zoom,output=None,order,mode='constant',cval=0.0,prefilter=True)缩放数组。使用请求顺序的样条插值对数组进行缩放。
input: 以数组形式输入图片
zoom:浮点数或数组。如果是一个浮点数,对每一个轴放缩相同的倍数。如果是一个数组,则对每一个轴分配一个值。
output:输出,默认为None
order:整型(范围0-5)样条插值的顺序,默认为3。详见后续
'''
l_resized = ndi.zoom(l, 2, order=3)
ax[0].set_title("Original rescaled with\n spline interpolation (order=3)")
ax[0].imshow(l_resized, extent=(-0.5, 128.5, 128.5, -0.5),
             cmap=cm.Greys_r)

ax[1].set_title("Block view with\n local mean pooling")
ax[1].imshow(mean_view, cmap=cm.Greys_r)

ax[2].set_title("Block view with\n local max pooling")
ax[2].imshow(max_view, cmap=cm.Greys_r)

ax[3].set_title("Block view with\n local median pooling")
ax[3].imshow(median_view, cmap=cm.Greys_r)

for a in ax:
    a.set_axis_off()

fig.tight_layout()
plt.show()
3、使用简单的 NumPy 操作来处理图像
此脚本说明了如何使用基本的 NumPy 操作,例如切片、屏蔽和花式索引,以修改图像的像素值。
#使用基本的 NumPy 操作,例如切片、屏蔽和花式索引,以修改图像的像素值。
import numpy as np
from skimage import data
import matplotlib.pyplot as plt

#读入,camera是ndarray的数组
camera = data.camera()
camera[:10] = 0#第0-9位设为0
mask = camera < 87#‘< ’为条件语句,只能返回“真假”。将camera中像素值<87的位置记为true,其余为false
camera[mask] = 255#再利用mask所标记的位置(true和false),将值为true的值设为255
inds_x = np.arange(len(camera))#横坐标0-511,arange(a,b,c)函数产生a~b(不包括b),间隔为c的一个数组,参511为终点,起点取0,步长取默认值1。
inds_y = (4 * inds_x) % len(camera)#生成步长为4的数组,纵坐标
camera[inds_x, inds_y] = 0 #按inds_x, inds_y的值将像素置为零
l_x, l_y = camera.shape[0], camera.shape[1]#读取矩阵长度
print(l_x,l_y)
X, Y = np.ogrid[:l_x, :l_y]#产生两个长为512的二维数组
print(X,Y)
outer_disk_mask = (X - l_x / 2)**2 + (Y - l_y / 2)**2 > (l_x / 2)**2#生成圆形的网格坐标
camera[outer_disk_mask] = 0 # 对网格坐标赋,除圆以外的都变为黑色的

plt.figure(figsize=(4, 4)) # 建立figure的尺寸比例
plt.imshow(camera, cmap='gray') # 显示图像
plt.axis('off')
plt.show()


 1916
1916


 被折叠的 条评论
为什么被折叠?
被折叠的 条评论
为什么被折叠?
 到【灌水乐园】发言


