


 文章介绍了如何在MATLAB中利用alchemyst/ternplot和STernary函数创建和定制三元相图,包括设置刻度、散点图和折线图的绘制,以及调整图表样式和颜色。
三元相图(Ternary Plot)
三元相图(Ternary Plot)是一种用于表示三个变量之间关系的图表。它通常被用于化学、地质、生态学、环境科学等领域,用于表示三种组分或属性在一个系统中的相对量或比例。
三元相图以一个三角形为基础,其中每个顶点代表系统中的一种组分或属性,因此三元相图也被称为三角图或三角坐标图。
方法1:函数alchemyst/ternplot
下载一:MATLAB中文帮助-alchemyst/ternplot
下载二:GitHub-alchemyst/ternplot
1.1 案例1:
方法2:STernary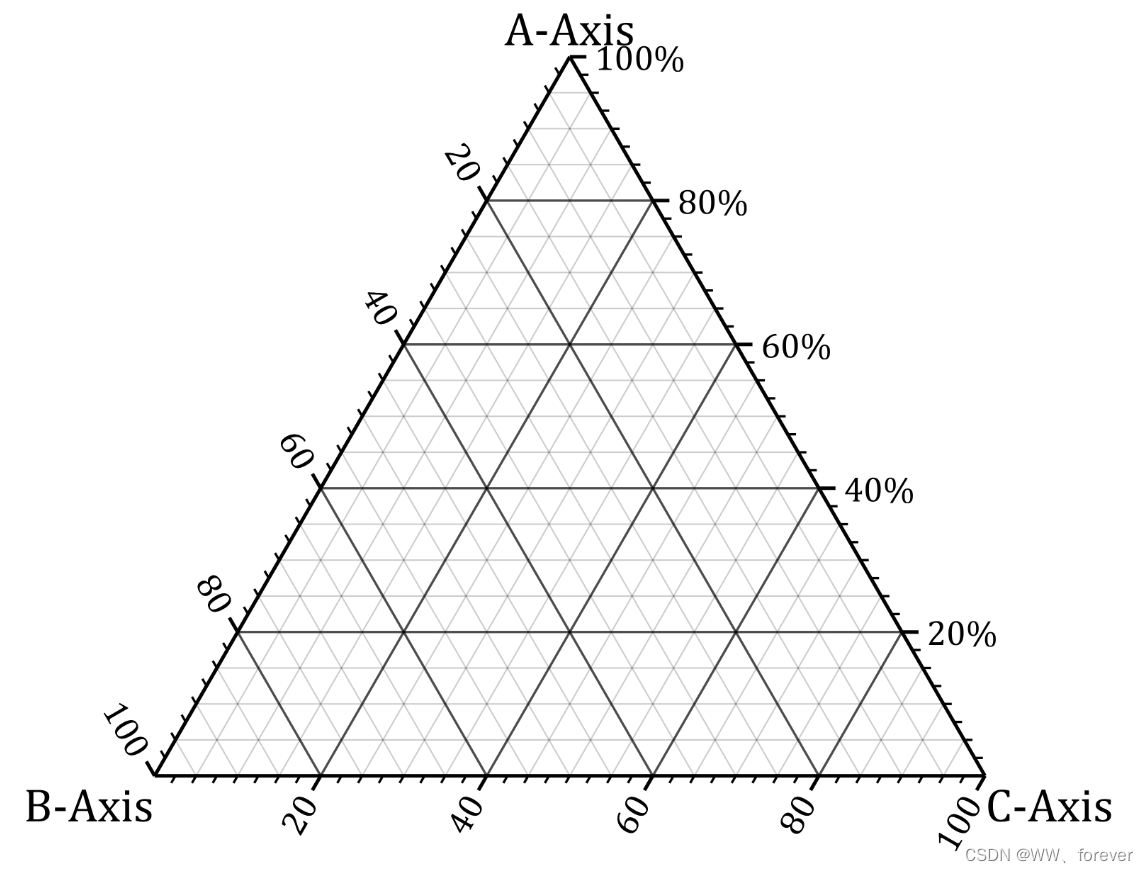
MATLAB代码如下:
%% 基础设置:

figure(2);
% 初始化三元相图(Init ternary plot)
STA2=STernary();

% 设置刻度值/网格值/刻度标签
% 'GridValues'/'TickValues'
% 'MinorGridValues'/'MinorTickValues'
% 'A_TickLabelStr'/'B_TickLabelStr'/'C_TickLabelStr'
STA2.set('MinorGridValues',5:5:100)
STA2.set('MinorTickValues',2.5:2.5:100)
STA2.set('A_TickLabelStr',{'20%','40%','60%','80%','100%'})

% 设置轴刻度标签字体和颜色
set(STA1,'A_TickLabel','Color',[0,0,0],'FontSize',14,'fontname','Times New Roman')
set(STA1,'B_TickLabel','Color',[0,0,0],'FontSize',14,'fontname','Times New Roman')
set(STA1,'C_TickLabel','Color',[0,0,0],'FontSize',14,'fontname','Times New Roman')
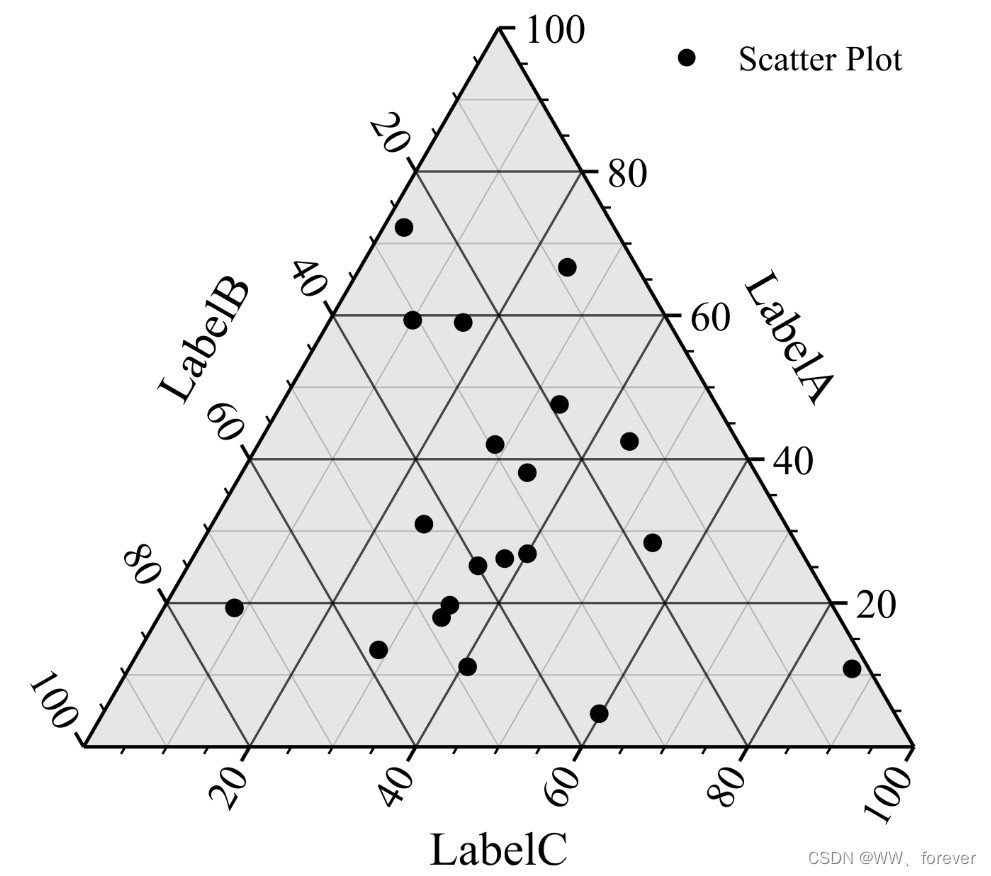
2.1 案例1:散点图
成图如下:
MATLAB代码如下:
clc
close all
clear
%% 基础设置
pathFigure= '.\Figures\' ;

%% 开始绘图-散点图

A=rand(1,20);
B=rand(1,20);
C=rand(1,20);

figure(1);
% 初始化三元相图(Init ternary plot)
STA1=STernary();

% 绘制散点图(Draw scatter plot)
STA1.SScatter(A,B,C,40,'filled','CData',[0,0,0]);

% 背景色变为灰色(Set the background color to gray)
set(STA1,'Color',[.9,.9,.9]);
hl = legend("Scatter Plot");
set(hl,'Box','off','location','NorthEast','FontSize',12,'FontName','Times New Roman');

% 设置A轴刻度标签字体和颜色
set(STA1,'A_TickLabel','Color',[0,0,0],'FontSize',14,'fontname','Times New Roman')
set(STA1,'B_TickLabel','Color',[0,0,0],'FontSize',14,'fontname','Times New Roman')
set(STA1,'C_TickLabel','Color',[0,0,0],'FontSize',14,'fontname','Times New Roman')

% 设置标签文本(Set Label string)
set(STA1,'A_Label','String','LabelA','fontname','Times New Roman');
set(STA1,'B_Label','String','LabelB','fontname','Times New Roman');
set(STA1,'C_Label','String','LabelC','fontname','Times New Roman');
% 将标签移动到侧边(Move the label to the side)
STA1.label2Side();

str= strcat(pathFigure, "Figure1", '.tiff');
print(gcf, '-dtiff', '-r600', str);
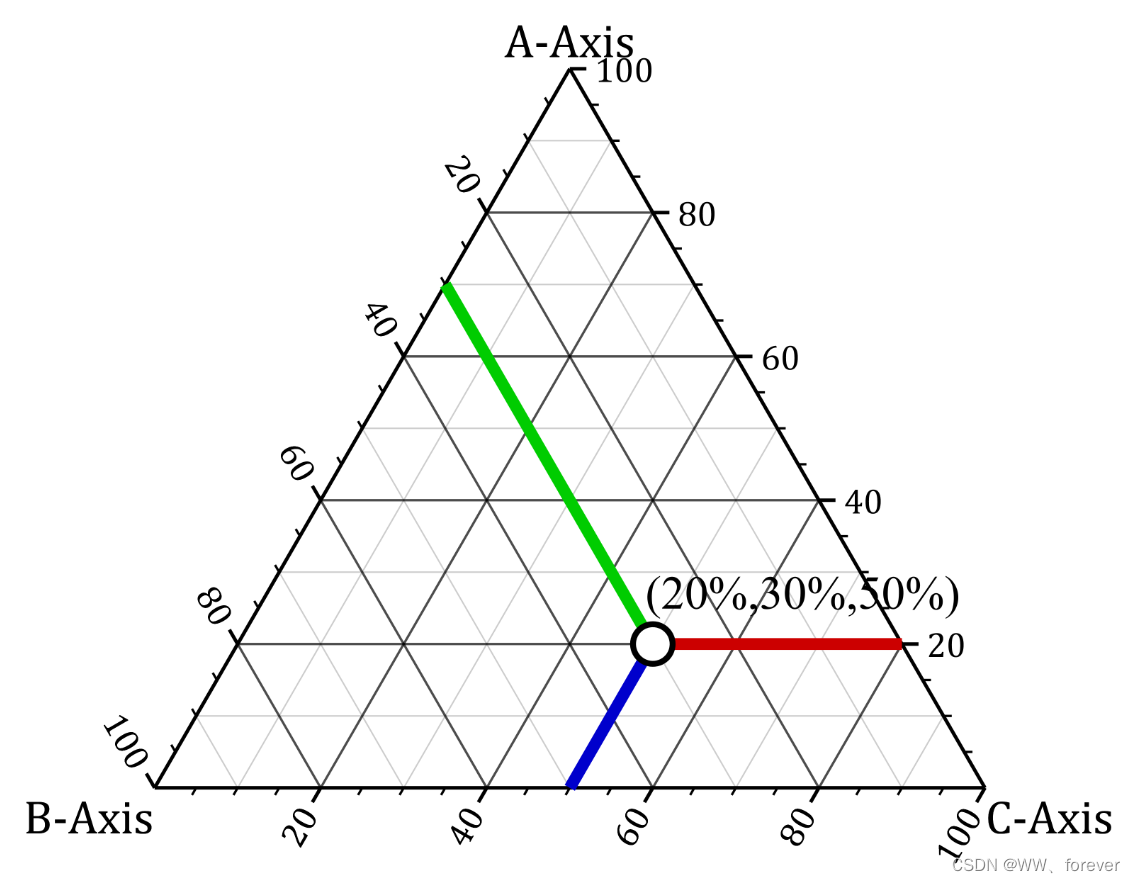
2.2 案例2:折线图
成图如下:
MATLAB代码如下:
%% 绘图-折线图

figure(3);
% 初始化三元相图(Init ternary plot)
STA3=STernary();

% 初始化三元相图(Init ternary plot)
STA3=STernary();

% 绘制折线图及散点(Draw lines and scatter)
STA3.SPlot([2,2],[3,0],[5,8],'LineWidth',4,'Color',[.8,0,0]);
STA3.SPlot([2,7],[3,3],[5,0],'LineWidth',4,'Color',[0,.8,0]);
STA3.SPlot([2,0],[3,5],[5,5],'LineWidth',4,'Color',[0,0,.8]);
STA3.SScatter(2,3,5,180,'filled','CData',[1,1,1],'MarkerEdgeColor',[0,0,0],'LineWidth',2);

% 绘制文本(Draw text)
STA3.SText(2+1,3,5,'(20%,30%,50%)','FontSize',16,'FontName','Times New Roman')

% 设置轴刻度标签字体和颜色
set(STA1,'A_TickLabel','Color',[0,0,0],'FontSize',14,'fontname','Times New Roman')
set(STA1,'B_TickLabel','Color',[0,0,0],'FontSize',14,'fontname','Times New Roman')
set(STA1,'C_TickLabel','Color',[0,0,0],'FontSize',14,'fontname','Times New Roman')
参考
MATLAB | 如何用MATLAB如何绘制各式各样精致的三元相图(ternary plot)


 1003
1003

 被折叠的 条评论
为什么被折叠?
被折叠的 条评论
为什么被折叠?
 到【灌水乐园】发言


