


import numpy as np
import torch
import matplotlib.pyplot as plt
# 糖尿病预测研判
#加载数据
x=np.loadtxt("D:\Anaconda\Lib\site-packages\sklearn\datasets\data\diabetes_data.csv",delimiter=' ',dtype=np.float32)#加载训练集合
y=np.loadtxt("D:\Anaconda\Lib\site-packages\sklearn\datasets\data\diabetes_target.csv",delimiter=',',dtype=np.float32)#加载训练集合
x_data = torch.from_numpy(x)
y_data = torch.from_numpy(y)
y_data = torch.sigmoid(y_data) #加载的y_data数据集 数据是一个实数,不是0~1区间的概率,所以需要用激活函数得出对应的概率
#错误代码: all elements of target should be between 0 and 1
print("X_shape:", x_data.shape) #读取矩阵的形状 442*10
print("y_shape:", y_data.shape) #读取矩阵的形状 442*1
#Define Model .............................................................#
class Model(torch.nn.Module):
def __init__(self):
super( Model, self).__init__()
self.linear1= torch.nn.Linear(10,8) #w_shape:10*8
self.linear2 = torch.nn.Linear(8,4) #w_shape:8*4
self.linear3 = torch.nn.Linear(4,1) #w_shape:4*1
self.sigmoid = torch.nn.Sigmoid()
def forward(self,x):
x = self.sigmoid(self.linear1(x))
x = self.sigmoid(self.linear2(x))
y_pred = self.sigmoid(self.linear3(x))
return y_pred
#实例化
model = Model()
#Define loss functions and optimizer........................................................................#
criterion = torch.nn.BCELoss(reduction='mean') #老师使用的是torch.nn.BCELoss(size_average=False)但是我使用这个损失太大了
optimizer = torch.optim.SGD(model.parameters(),lr=0.1) #lr为学习率,因为0.01太小了,我改成了0.1
#plot
x_axis = []
y_axis = []
##start training.............................................................................................#
for epoch in range(1000):
y_pred = model(x_data)
y_pred = y_pred.squeeze()
loss = criterion(y_pred,y_data)
optimizer.zero_grad()
loss.backward()
optimizer.step()
#记录绘图数据
if epoch%200 == 0:
print('epoch:',epoch,'loss:',loss.item())
x_axis.append(epoch + 1)
y_axis.append(loss.item())
#drawing.....................................................................................................#
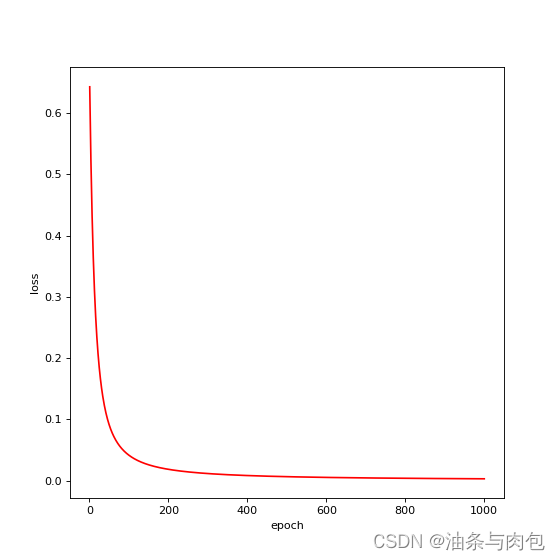
plt.figure(figsize=(7, 7), dpi=80) # 创建画布
plt.plot(x_axis,y_axis, color='r', linestyle='-', label='loss value', ) # 绘制折线图,点划线
plt.xlabel('epoch') #设置图x轴标签
plt.ylabel('loss') #设置图y轴标签
plt.show() #显示图
Loss value & Epoch picture


 203
203


 被折叠的 条评论
为什么被折叠?
被折叠的 条评论
为什么被折叠?
 到【灌水乐园】发言


