


1. 思路
- 遍历轮廓的像素值,求取依次相连的位置
- 根据离散点求曲率以及曲率点的方向
2. 获取边缘点的坐标
参考链接:https://blog.csdn.net/qq_36614557/article/details/115315449
def findpoint(x_arr, y_arr, x_next, y_next):
	n = len(x_arr)
	f = 1
	for i in range(n):
		if x_arr[i] == x_next and y_arr[i] == y_next:
			f = 0
			break
	return f

# 依次获取边缘轮廓上的点
def getAllPoint(img, img_c3):
	_, bw_img = cv2.threshold(img, 0, 1, cv2.THRESH_BINARY)
	thin_img = morphology.skeletonize(bw_img)
	thin_img = thin_img.astype(np.uint8) * 255

	x = []
	y = []
	sx, sy = np.where(thin_img==255)
	sx_first = sx[0]
	sy_first = sy[0]
	x.append(sx_first)
	y.append(sy_first)
	dir=[[-1,-1],[-1,0],[-1,1],[0,1],[1,1],[1,0],[1,-1],[0,-1]]

	while True:
		f = 0
		for i in range(8):
			if thin_img[sx_first + dir[i][0]][sy_first + dir[i][1]] == 255 and findpoint(x, y, (sx_first + dir[i][0]), (sy_first + dir[i][1])):
				sx_first +=  dir[i][0]
				sy_first +=  dir[i][1]
				f = 1
				break
		if f == 0:
			break
		if sx_first == x[0] and sy_first == y[0]:
			break
		x.append(sx_first)
		y.append(sy_first)

	# for i in range(len(x)):
	# 	cv2.circle(img_c3, (y[i], x[i]), 1, (0, 0, 255), -1)
	# cv2.imshow('img', img_c3)
	# cv2.waitKey(0)
	return x, y
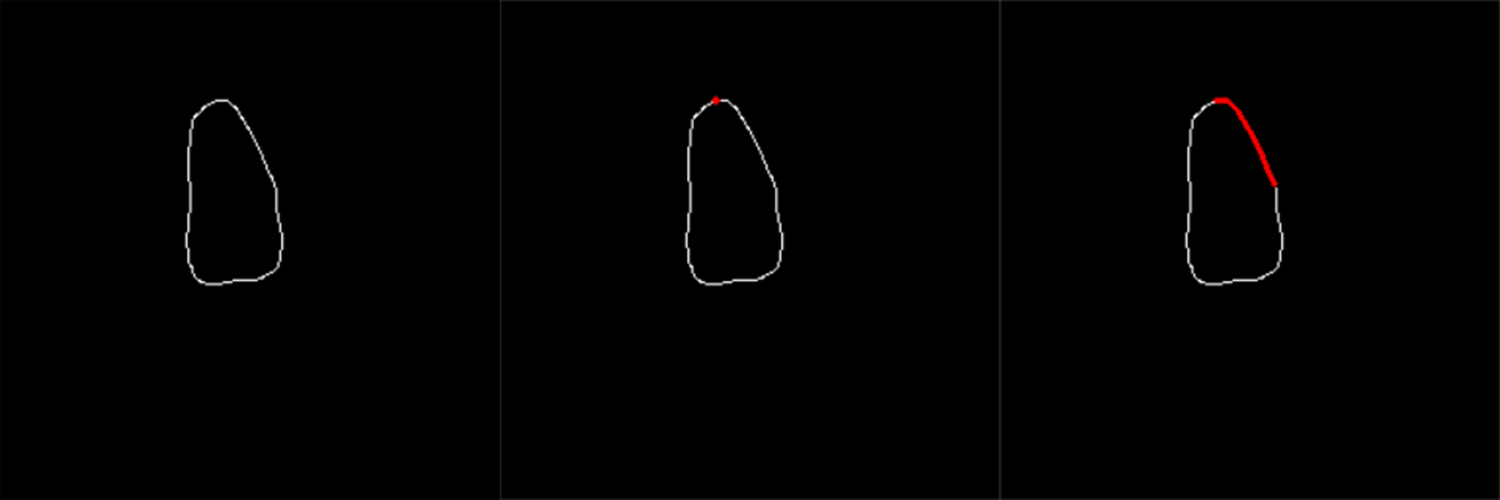
将遍历的点映射到原始图像上,效果图如下:
2. 利用离散点求曲率以及方向
参考:https://zhuanlan.zhihu.com/p/72083902
def PJcurvature(x,y):
    """
    input  : the coordinate of the three point
    output : the curvature and norm direction
    refer to https://github.com/Pjer-zhang/PJCurvature for detail
    """
    t_a = LA.norm([x[1]-x[0],y[1]-y[0]])
    t_b = LA.norm([x[2]-x[1],y[2]-y[1]])

    M = np.array([
        [1, -t_a, t_a**2],
        [1, 0,    0     ],
        [1,  t_b, t_b**2]
    ])

    a = np.matmul(LA.inv(M),x)
    b = np.matmul(LA.inv(M),y)

    kappa = 2*(a[2]*b[1]-b[2]*a[1])/(a[1]**2.+b[1]**2.)**(1.5)
    norm_direction = [b[1],-a[1]]/np.sqrt(a[1]**2.+b[1]**2.)

    return kappa, norm_direction
3. 运行
import cv2
import copy
import numpy as np
from skimage import morphology
import numpy.linalg as LA
import matplotlib.pyplot as plt
import math


def findpoint(x_arr, y_arr, x_next, y_next):
	n = len(x_arr)
	f = 1
	for i in range(n):
		if x_arr[i] == x_next and y_arr[i] == y_next:
			f = 0
			break
	return f


def PJcurvature(x,y):
    """
    input  : the coordinate of the three point
    output : the curvature and norm direction
    refer to https://github.com/Pjer-zhang/PJCurvature for detail
    """
    t_a = LA.norm([x[1]-x[0],y[1]-y[0]])
    t_b = LA.norm([x[2]-x[1],y[2]-y[1]])

    M = np.array([
        [1, -t_a, t_a**2],
        [1, 0,    0     ],
        [1,  t_b, t_b**2]
    ])

    a = np.matmul(LA.inv(M),x)
    b = np.matmul(LA.inv(M),y)

    kappa = 2*(a[2]*b[1]-b[2]*a[1])/(a[1]**2.+b[1]**2.)**(1.5)
    norm_direction = [b[1],-a[1]]/np.sqrt(a[1]**2.+b[1]**2.)

    return kappa, norm_direction


# 依次获取边缘轮廓上的点
def getAllPoint(img, img_c3):
	_, bw_img = cv2.threshold(img, 0, 1, cv2.THRESH_BINARY)
	thin_img = morphology.skeletonize(bw_img)
	thin_img = thin_img.astype(np.uint8) * 255

	x = []
	y = []
	sx, sy = np.where(thin_img==255)
	sx_first = sx[0]
	sy_first = sy[0]
	x.append(sx_first)
	y.append(sy_first)
	dir=[[-1,-1],[-1,0],[-1,1],[0,1],[1,1],[1,0],[1,-1],[0,-1]]

	while True:
		f = 0
		for i in range(8):
			if thin_img[sx_first + dir[i][0]][sy_first + dir[i][1]] == 255 and findpoint(x, y, (sx_first + dir[i][0]), (sy_first + dir[i][1])):
				sx_first +=  dir[i][0]
				sy_first +=  dir[i][1]
				f = 1
				break
		if f == 0:
			break
		if sx_first == x[0] and sy_first == y[0]:
			break
		x.append(sx_first)
		y.append(sy_first)

	# for i in range(len(x)):
	# 	cv2.circle(img_c3, (y[i], x[i]), 1, (0, 0, 255), -1)
	# cv2.imshow('img', img_c3)
	# cv2.waitKey(0)
	return x, y

# 计算点之间的欧氏距离
def euclidean_Dis(x1, y1, x2, y2):
	d12 = np.sqrt((x1 - x2)**2 + (y1 - y2)**2)
	return d12

# 计算直线方程
def getLineFunc(x1, y1, x2, y2, tmp_x, num):
    k = (y2 - y1) / (x2 - x1)
    line_k = - (1 / k)
    b1 = y1 - line_k*x1
    b2 = y2 - line_k*x2
    L = np.abs(b1-b2)
    step_L = L / 20
    if line_k < 0:
        if b1 < b2:
            tmp_y = line_k * tmp_x + (b1 + step_L * num)
        else:
            tmp_y = line_k * tmp_x + (b2 + step_L * num)
    else:
        if b1 > b2:
            tmp_y = line_k * tmp_x + (b1 - step_L * num)
        else:
            tmp_y = line_k * tmp_x + (b2 - step_L * num)
    return tmp_y


def AutoEF(gray_ED, gray_ES):
    ED_ES_arr = [gray_ED, gray_ES]
    ED_ES_value = []
    for i in range(2):
        gray = ED_ES_arr[i]
        LV_img = copy.deepcopy(gray)
        LV_img[LV_img != 255] = 0
        LV_img_Gaussian = cv2.GaussianBlur(LV_img, (3, 3), 1)
        LV_img_Gaussian[LV_img_Gaussian > 0] = 255
        LV_img_uint8 = LV_img_Gaussian.astype("uint8")
        LV_edge = cv2.Canny(LV_img_uint8, 1, 1)
        # cv2.imwrite("ED.png", LV_edge)

        img_c3 = np.expand_dims(LV_edge, axis=2).repeat(3, axis=2)

        # # 计算曲率
        arr_x, arr_y = getAllPoint(LV_edge, img_c3)
        step_point = 8
        j = 0
        p = step_point
        ka = []
        no = []
        po = []
        for i in range(len(arr_x)):
            if i <  step_point:
                input_x = None
                input_y = None
                idx_first = len(arr_x) - p
                idx_cur = i
                idx_next = i + step_point
                input_x = [arr_x[idx_first], arr_x[idx_cur], arr_x[idx_next]]
                input_y = [arr_y[idx_first], arr_y[idx_cur], arr_y[idx_next]]
                p -= 1
            if i <  len(arr_x) - step_point and i >= step_point:
                input_x = None
                input_y = None
                idx_first = i - step_point
                idx_cur = i
                idx_next = i + step_point
                input_x = [arr_x[idx_first], arr_x[idx_cur], arr_x[idx_next]]
                input_y = [arr_y[idx_first], arr_y[idx_cur], arr_y[idx_next]]
            if i >= len(arr_x) - step_point:
                idx_first = i - step_point
                idx_cur = i
                idx_next = j
                input_x = [arr_x[idx_first], arr_x[idx_cur], arr_x[idx_next]]
                input_y = [arr_y[idx_first], arr_y[idx_cur], arr_y[idx_next]]
                j += 1
            kappa, norm_direction = PJcurvature(input_x, input_y)

            if kappa > 0.1:
                po.append([arr_x[idx_cur], arr_y[idx_cur]])     # 保持位置
                ka.append(kappa)                                # 保持斜率
                no.append(norm_direction)                       # 保持方向
                # cv2.circle(img_c3, (arr_y[idx_cur], arr_x[idx_cur]), 1, (0, 0, 255), -1)


        # 显示曲率方向
        po = np.array(po)
        no = np.array(no)
        ka = np.array(ka)

        # plt.imshow(img_c3)
        # plt.quiver(po[:,1], po[:,0], ka*no[:,0],ka*no[:,1], color='r', angles='uv',scale_units='xy',scale=0.01)  # uv表示方向, xy位置参数,此时uv表示其增量
        # plt.show()

        # cv2.imshow('img', img_c3)
        # cv2.waitKey(0)

        # 分堆,将三块区域分开
        x = po[:, 0]
        y = po[:, 1]
        arr_1 = []
        arr_2 = []
        arr_3 = []
        arr_4 = []
        cls_1_p = []
        cls_2_p = []
        cls_3_p = []
        cls_4_p = []
        x1 = x[0]
        y1 = y[0]
        arr_1.append([x1, y1])
        cls_1_p.append(ka[0])
        for i in range(1, len(x)):
            x2 = x[i]
            y2 = y[i]
            d = euclidean_Dis(x1, y1, x2, y2)
            if d < 10:
                arr_1.append([x2, y2])
                cls_1_p.append(ka[i])
            else:
                arr_2.append([x2, y2])
                cls_2_p.append(ka[i])

        cls_2_p = np.array(cls_2_p)
        arr_2 = np.array(arr_2)
        array_x = arr_2[:, 0]
        array_y = arr_2[:, 1]
        point_x1 = array_x[0]
        point_y1 = array_y[0]
        arr_4.append([point_x1, point_y1])
        cls_4_p.append(cls_2_p[0])
        for j in range(1, len(array_x)):
            point_x2 = array_x[j]
            point_y2 = array_y[j]
            d1 = euclidean_Dis(point_x1, point_y1, point_x2, point_y2)
            if d1 < 10:
                arr_4.append([point_x2, point_y2])
                cls_4_p.append(cls_2_p[j])
            else:
                arr_3.append([point_x2, point_y2])
                cls_3_p.append(cls_2_p[j])


        # 获取三个区域的数组 心尖和二尖瓣  找到每个区域中曲率最大的值
        # 分堆后的位置
        cls_1 = np.array(arr_1)
        cls_2 = np.array(arr_3)
        cls_3 = np.array(arr_4)
        # 分堆后对应的概率
        cls_1_arrp = cls_1_p
        cls_2_arrp = cls_3_p
        cls_3_arrp = cls_4_p

        cls_1_tem = copy.deepcopy(cls_1_arrp)
        cls_2_tem = copy.deepcopy(cls_2_arrp)
        cls_3_tem = copy.deepcopy(cls_3_arrp)
        for _ in range(1):
            if len(cls_1) == 1:
                cls_1_max_pos = cls_1[0]
            else:
                number1 = max(cls_1_tem)
                index1 = cls_1_tem.index(number1)
                cls_1_tem[index1] = -np.inf
                cls_1_max_pos = cls_1[index1]
            if len(cls_2) == 1:
                cls_2_max_pos = cls_2[0]
            else:
                number2 = max(cls_2_tem)
                index2 = cls_2_tem.index(number2)
                cls_2_tem[index2] = -np.inf
                cls_2_max_pos = cls_2[index2]
            if len(cls_3) == 1:
                cls_3_max_pos = cls_3[0]
            else:
                number3 = max(cls_3_tem)
                index3 = cls_3_tem.index(number3)
                cls_3_tem[index3] = -np.inf
                cls_3_max_pos = cls_3[index3]


        final_pos = np.array([cls_1_max_pos, cls_2_max_pos, cls_3_max_pos])
        mid_x = (cls_2_max_pos[0] + cls_3_max_pos[0]) // 2
        mid_y = (cls_2_max_pos[1] + cls_3_max_pos[1]) // 2

        # 显示三点的连线
        for i in range(3):
            final_x, final_y = final_pos[i][0], final_pos[i][1]
            cv2.circle(img_c3, (final_y, final_x), 1, (0, 0, 255), -1)
            cv2.line(img_c3, (cls_2_max_pos[1], cls_2_max_pos[0]), (cls_3_max_pos[1], cls_3_max_pos[0]), (0, 0, 255), 1, lineType=cv2.LINE_AA)
            cv2.line(img_c3, (cls_1_max_pos[1], cls_1_max_pos[0]), (mid_y, mid_x), (0, 0, 255), 1, lineType=cv2.LINE_AA)


        # 遍历 找线段与边缘的近似交点
        line_x1, line_y1 = cls_1_max_pos[0], cls_1_max_pos[1]
        line_x2, line_y2 = mid_x, mid_y
        arr_tmp_x = arr_x
        arr_tmp_y = arr_y
        S_sum = 0
        line_num = 0
        for num in range(1, 20):
            arr_tmp = []
            arr_loss = []
            for i in range(len(arr_tmp_x)):
                pix_x = arr_tmp_x[i]
                pix_y = arr_tmp_y[i]
                result_y  = getLineFunc(line_x1, line_y1, line_x2, line_y2, pix_x, num)
                loss = abs(result_y - pix_y)
                arr_loss.append(loss)
                arr_tmp.append([pix_x, pix_y])

            t = copy.deepcopy(arr_loss)
            arr_tmp = np.array(arr_tmp)
            L_x = arr_tmp[:, 0]
            L_y = arr_tmp[:, 1]
            new_arr_loss = []
            new_arr_tmp = []
            for _ in range(4):
                number = min(t)
                index = t.index(number)
                t[index] = np.inf
                new_arr_loss.append(number)
                new_arr_tmp.append([L_x[index], L_y[index]])
            new_arr_tmp = np.array(new_arr_tmp)
            new_L_x = new_arr_tmp[:, 0]
            new_L_y = new_arr_tmp[:, 1]
            # 待优化  四个点中选两个直线更加垂直于直线(求斜率进行判断)
            for i in range(len(new_L_x)):
                d_1 = euclidean_Dis(new_L_x[0], new_L_y[0], new_L_x[i], new_L_y[i])
                if d_1 > 10:
                    cv2.circle(img_c3, (new_L_y[i], new_L_x[i]), 1, (0, 0, 255), -1)
                    cv2.line(img_c3, (new_L_y[0], new_L_x[0]), (new_L_y[i], new_L_x[i]), (0, 0, 255), 1, lineType=cv2.LINE_AA)
                    line_L = np.sqrt((new_L_y[i] - new_L_y[0])**2 + (new_L_x[i] - new_L_x[0]) ** 2)
                    line_num += 1
                    # 圆盘面积
                    S = math.pi * ((line_L / 2) ** 2)
                    S_sum += S
                    break

        # 二尖瓣连线的长度
        line_last = np.sqrt((cls_2_max_pos[1] - cls_3_max_pos[1])**2 + (cls_2_max_pos[0] - cls_3_max_pos[0]) ** 2)
        # 心尖与二尖瓣连线中点的长度
        line_max = np.sqrt((line_y1 - line_y2)**2 + (line_x1 - line_x2) ** 2)
        line_num = line_num + 1
        print(line_num)
        S_sum = S_sum + math.pi * ((line_last / 2) ** 2)
        # EF的计算 圆盘面积之和乘
        V_value = (S_sum * line_max) / line_num
        ED_ES_value.append(V_value)
        # print(EF_value)
        cv2.imshow('img', img_c3)
        cv2.waitKey(0)
    EF = (ED_ES_value[0] - ED_ES_value[1]) / ED_ES_value[0]
    EF = str(EF * 100)[:5] + "%"

    return EF


img = cv2.imread("ED_img.png")
gray_ED = cv2.cvtColor(img, cv2.COLOR_BGR2GRAY)
img1 = cv2.imread("ES_img.png")
gray_ES = cv2.cvtColor(img1, cv2.COLOR_BGR2GRAY)
EF = AutoEF(gray_ED, gray_ES)
print(EF)


 1万+
1万+


 被折叠的 条评论
为什么被折叠?
被折叠的 条评论
为什么被折叠?
 到【灌水乐园】发言


