


概念引入
Axes/Subplot概念:

Axes/Subplot的异同:
共同点:两者都相当于画布figure上的画纸ax,概念上是相同的。
不同点:两者在创建画纸ax上略有不同。
Axes创建方式:
plt.axes(rect,projection=None,polar=False,**kwargs)
Parameters:
rect : None or 列表 = [left, bottom, width, height],取值范围为0到1
projection : 投影类型
分别使用subplot和axes创建子图
示例一,使用add_subplot()方法
1)导包
import numpy as np
import matplotlib.pyplot as plt
2)创建示例数据
# 创建示例数据
x = np.arange(1, 10, 0.1)  # start = 1, end = 10, step = 0.1
y1 = np.sin(x)
y2 = np.cos(x)
3)使用add_subplot()方法创建子图
fig = plt.figure(figsize=(16, 9))  # 创建一个画布

ax1 = fig.add_subplot(211)  # 创建子图1
ax1.plot(x, y1, 'r', linestyle='--')

ax2 = fig.add_subplot(212)  # 创建子图2
ax2.plot(x, y2, 'b', linestyle='-.')

示例二,使用subplot()方法创建子图
plt.figure(figsize=(16, 9))  # 创建一个画布

# 使用subplot创建
plt.subplot(211)
plt.plot(x, y1, 'r', linestyle='--')

plt.subplot(212)
plt.plot(x, y2, 'b', linestyle='-.')
或:
plt.figure(figsize=(16, 9))  # 创建一个画布

# 使用subplot创建
ax1 = plt.subplot(211)
ax1.plot(x, y1, 'r', linestyle='--')

ax2 = plt.subplot(212)
ax2.plot(x, y2, 'b', linestyle='-.')

示例三,使用add_axes()方法创建子图
# 创建示例数据
x = np.arange(1, 10, 0.1)  # start = 1, end = 10, step = 0.1
y1 = 1 / x
y2 = np.cos(x)


# ------------------画图------------------

fig = plt.figure(figsize=(16, 9))  # 创建一个画布

ax1 = fig.add_axes([0.1, 0.1, 0.6, 0.75])
ax1.plot(x, y1, 'b', linestyle='-.')

ax2 = fig.add_axes([0.38, 0.5, 0.3, 0.3])
ax2.plot(x, y2, 'r', linestyle='--')
示例四,使用axes()方法创建子图
plt.figure(figsize=(16, 9))  # 创建一个画布

ax1 = plt.axes([0.1, 0.1, 0.6, 0.75])
ax1.plot(x, y1, 'b', linestyle='-.')

ax2 = plt.axes([0.38, 0.5, 0.3, 0.3])
ax2.plot(x, y2, 'r', linestyle='--')

非规则拼图
# 非规则拼图
fig = plt.figure(figsize=(16, 9))  # 创建一个画布
ax1 = fig.add_subplot(221)  # 创建子图1
ax2 = fig.add_subplot(222)  # 创建子图2
ax3 = fig.add_subplot(212)  # 创建子图3

ax1.plot(x, np.sin(x), 'r', linestyle='-.')
ax2.plot(x, np.cos(x), 'b', linestyle='--')
ax3.plot(x, np.log(x), 'g', )

或
# 非规则拼图
fig = plt.figure(figsize=(16, 9))  # 创建一个画布
ax1 = fig.add_subplot(221)  # 创建子图1
ax2 = fig.add_subplot(223)  # 创建子图2
ax3 = fig.add_subplot(122)  # 创建子图3

ax1.plot(x, np.sin(x), 'r', linestyle='-.')
ax2.plot(x, np.cos(x), 'b', linestyle='--')
ax3.plot(x, np.log(x), 'g', )

画你的第一张地图
四种投影:
等经纬度投影(PlateCarree)(默认)、兰伯特投影(Lambert)、墨卡托投影(Mercator)、极射赤面投影
class cartopy.crs.Projection,定义投影类
1)等经纬度投影
class cartopy.crs.PlateCarree(central_longitude=0.0, globe=None)
Parameters:
central_longitude:中心经度
2)兰伯特投影
class cartopy.crs.LambertConformal(central_longitude=-96.0, central_latitude=39.0, false_easting=0.0, false_northing=0.0, secant_latitudes=None, standard_parallels=None, globe=None, cutoff=-30)
3)墨卡托投影
class cartopy.crs.Mercator(central_longitude=0.0, min_latitude=-80.0, max_latitude=84.0, globe=None, latitude_true_scale=0.0)
4)极射赤面投影
class cartopy.crs.Stereographic(central_latitude=0.0, central_longitude=0.0, false_easting=0.0, false_northing=0.0, true_scale_latitude=None, globe=None)
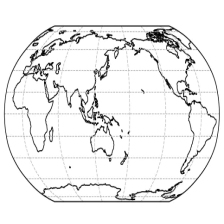
在上述基础知识铺垫后,你就可以画你的第一张地图了!让我们先画一张世界地图吧!
1)导入本次画图所需要的包
import matplotlib.pyplot as plt
import cartopy.crs as ccrs
2)画一张世界地图
fig = plt.figure(figsize=(16, 8))  # 设置画布

proj = ccrs.PlateCarree()  # 创建一个投影
ax = plt.axes(projection=proj)  # 创建一个画纸, 并指明投影类型
ax.coastlines()  # 画海岸线
plt.show()  # 显示图像

在上述代码中,你就画出了第一张地图,但是这张图还明显缺少刻度信息,在下面的代码中将添加坐标信息。
(部分语句参考链接:https://matplotlib.org/3.3.2/api/ticker_api.html)
1)导包
import numpy as np
import matplotlib.pyplot as plt
import cartopy.crs as ccrs
from cartopy.mpl.ticker import LongitudeFormatter, LatitudeFormatter  # 刻度格式
import matplotlib.ticker as mticker  # 添加网格线
2)画图
fig = plt.figure(figsize=(16, 8))  # 设置画布

proj = ccrs.PlateCarree()  # 创建一个投影
ax = plt.axes(projection=proj)  # 创建一个画纸, 并指明投影类型
ax.coastlines()  # 画海岸线


# 设置范围
extent = [-180, 180, -90, 90]

# 设置刻度
dx = 60
dy = 30
offset = min(dx, dy)

xticks = np.arange(extent[0], extent[1] + offset, dx)  # 创建x轴刻度
yticks = np.arange(extent[2], extent[3] + offset, dy)  # 创建y轴刻度


# 添加刻度
ax.set_xticks(xticks, crs=ccrs.PlateCarree())
ax.set_yticks(yticks, crs=ccrs.PlateCarree())

# 设置刻度字体大小

# 方法一
# ax.tick_params(axis='x', labelsize=15)
ax.tick_params(labelsize=15)

# 方法二
# plt.xticks(fontsize = 15)
# plt.yticks(fontsize = 15)

# 设置刻度格式为经纬度格式
ax.xaxis.set_major_formatter(LongitudeFormatter(zero_direction_label=True))
ax.yaxis.set_major_formatter(LatitudeFormatter())

# 设置画图范围
ax.set_extent(extent)

# 添加网格线
# gl = ax.gridlines(crs=proj, draw_labels=False, linewidth=1, linestyle=':', color='k', alpha=0.8)
# gl.xlocator = mticker.FixedLocator(xticks)  # 设置
# gl.ylocator = mticker.FixedLocator(yticks)

将刻度设置封装为函数方便调用
# # 函数封装,方便调用

def add_geo_ticks(ax, proj, extent, lat_span = 5, lon_span = 5):
    '''
        在图中添加刻度信息

        Version 1.0

    '''

    from cartopy.mpl.ticker import LongitudeFormatter, LatitudeFormatter  # 刻度格式


    offset = min(lon_span, lat_span)

    xticks = np.arange(extent[0], extent[1] + offset, lon_span)  # 创建x轴刻度
    yticks = np.arange(extent[2], extent[3] + offset, lat_span)  # 创建y轴刻度

    # 添加刻度
    ax.set_xticks(xticks, crs=proj)
    ax.set_yticks(yticks, crs=proj)

    # 设置刻度格式为经纬度格式
    ax.xaxis.set_major_formatter(LongitudeFormatter(zero_direction_label=True))
    ax.yaxis.set_major_formatter(LatitudeFormatter())

    # 设置画图范围
    ax.set_extent(extent)
上述代码变为:
fig = plt.figure(figsize=(16, 8))  # 设置画布

proj = ccrs.PlateCarree()  # 创建一个投影
ax = plt.axes(projection=proj)  # 创建一个画纸, 并指明投影类型
ax.coastlines()  # 画海岸线


# 设置范围
extent = [-180, 180, -90, 90]

# 添加地理坐标
add_geo_ticks(ax, proj, extent, lat_span = 30, lon_span = 60)

# 设置刻度字体大小
ax.tick_params(labelsize=15)
添加地理特征
cartopy包里自带了七种特征,它们分别如下:
(参考链接:https://scitools.org.uk/cartopy/docs/latest/matplotlib/feature_interface.html#cartopy.feature.LAND)
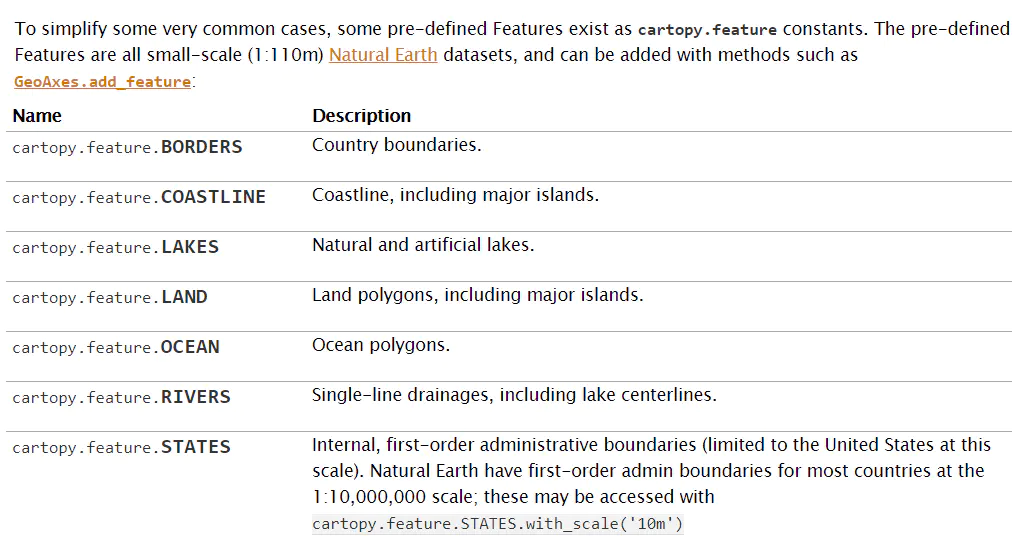
add_feature()函数说明:
参考(https://scitools.org.uk/cartopy/docs/v0.16/matplotlib/geoaxes.html#cartopy.mpl.geoaxes.GeoAxes.add_feature)

添加地理特征代码:
import cartopy.feature as cfeature

fig = plt.figure(figsize=(16, 8))  # 设置画布

proj = ccrs.PlateCarree()  # 创建一个投影
ax = plt.axes(projection=proj)  # 创建一个画纸, 并指明投影类型
ax.coastlines()  # 画海岸线


# 设置范围
extent = [-180, 180, -90, 90]

# 添加地理坐标
add_geo_ticks(ax, proj, extent, lat_span = 30, lon_span = 60)

# 设置刻度字体大小
ax.tick_params(labelsize=15)


ax.add_feature(cfeature.LAND)
ax.add_feature(cfeature.OCEAN)
ax.add_feature(cfeature.COASTLINE)
ax.add_feature(cfeature.BORDERS, linestyle=':')
ax.add_feature(cfeature.LAKES, alpha=0.5)
ax.add_feature(cfeature.RIVERS)


 2952
2952


 被折叠的 条评论
为什么被折叠?
被折叠的 条评论
为什么被折叠?
 到【灌水乐园】发言


