


library(repr)
options(repr.plot.width=10,repr.plot.height=3)
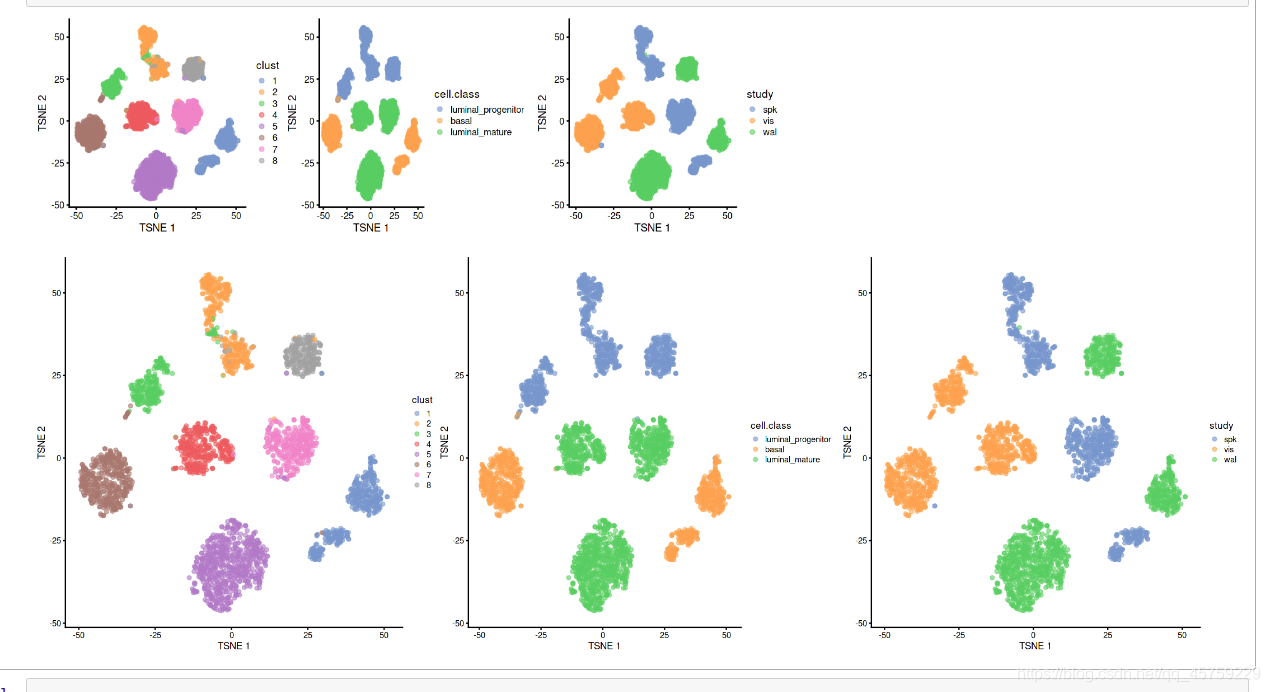
print(cowplot::plot_grid(scater::plotTSNE(bct.mBN, colour_by = "clust"),
scater::plotTSNE(bct.mBN, colour_by = "cell.class"),
scater::plotTSNE(bct.mBN, colour_by = "study"),nrow = 1))#
options(repr.plot.width=18,repr.plot.height=6)
print(cowplot::plot_grid(scater::plotTSNE(bct.mBN, colour_by = "clust"),
scater::plotTSNE(bct.mBN, colour_by = "cell.class"),
scater::plotTSNE(bct.mBN, colour_by = "study"),nrow = 1))#


 217
217


 被折叠的 条评论
为什么被折叠?
被折叠的 条评论
为什么被折叠?
 到【灌水乐园】发言


