


需求:实现排行榜的柱状图
思路:由于是排行榜 所以y轴刻度值不固定 我才用使用index索引值 去对应显示的图标
yAxis 下面的formatter定义格式 rich定义样式
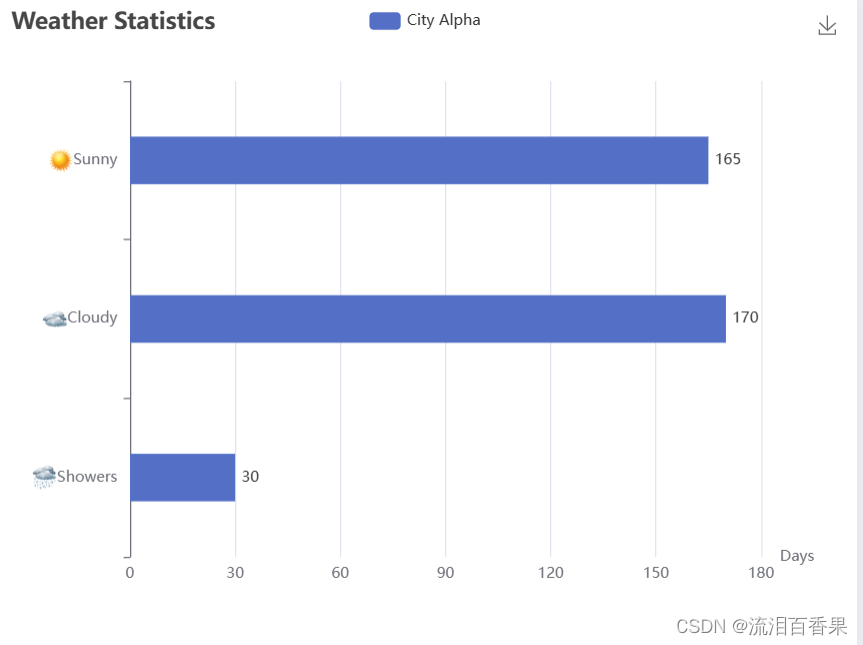
效果图:
const weatherIcons = {
  0: ROOT_PATH + '/data/asset/img/weather/sunny_128.png',
  1: ROOT_PATH + '/data/asset/img/weather/cloudy_128.png',
  2: ROOT_PATH + '/data/asset/img/weather/showers_128.png'
};
const seriesLabel = {
  show: true
};
option = {
  title: {
    text: 'Weather Statistics'
  },
  tooltip: {
    trigger: 'axis',
    axisPointer: {
      type: 'shadow'
    }
  },
  legend: {
    data: ['City Alpha', 'City Beta', 'City Gamma']
  },
  grid: {
    left: 100
  },
  toolbox: {
    show: true,
    feature: {
      saveAsImage: {}
    }
  },
  xAxis: {
    type: 'value',
    name: 'Days',
    axisLabel: {
      formatter: '{value}'
    }
  },
  yAxis: {
    type: 'category',
    inverse: true,
    data: ['Sunny', 'Cloudy', 'Showers'],
    axisLabel: {
       inside:true,        // 标签刻度朝内
            margin:0,           // 清除默认间距
            padding:[0,10,0,0], // 右边内边距10
            textStyle:{
                align:'right'   // 文字右对齐
            },
      formatter: function (value,index) {
        //index 对应的是rich里面的具体样式
        return '{' + index + '| }{value|' + value + '}';
      },
   rich: {
        value: {
          lineHeight: 30,
          align: 'center'
        },


       0: {
          height: 20,
          align: 'left',

          backgroundColor: {
            image: weatherIcons[0]
          }
        },
        1: {
          height: 20,
          align: 'center',
          backgroundColor: {
            image: weatherIcons[1]
          }
        },
        2: {
          height: 20,
          align: 'center',
          backgroundColor: {
            image: weatherIcons[2]
          }
        }
      }
    }
  },
  series: [
    {
      name: 'City Alpha',
      type: 'bar',
      data: [165, 170, 30],

        stack: 'Total',
      label: { //label值是否显示
        show: true,
        position: 'right'//显示位置
      },
        barWidth: "30%",
      markPoint: {
        symbolSize: 1,
        symbolOffset: [0, '50%'],
        label: {

          // backgroundColor: 'rgb(242,242,242)',
          borderColor: '#aaa',
          color:'#f00',
          // borderWidth: 1,
          borderRadius: 4,
          // padding: [4, 10],

          // shadowBlur: 5,
          // shadowColor: '#000',
          // shadowOffsetX: 0,
          // shadowOffsetY: 1,
          position: 'right',
          distance: 20,

        },

      }
    },

  ]
};


 1016
1016


 被折叠的 条评论
为什么被折叠?
被折叠的 条评论
为什么被折叠?
 到【灌水乐园】发言


