


💥💥💞💞欢迎来到本博客❤️❤️💥💥
🏆博主优势:🌞🌞🌞博客内容尽量做到思维缜密,逻辑清晰,为了方便读者。
⛳️座右铭:行百里者,半于九十。
📋📋📋本文目录如下:🎁🎁🎁
目录
💥1 概述
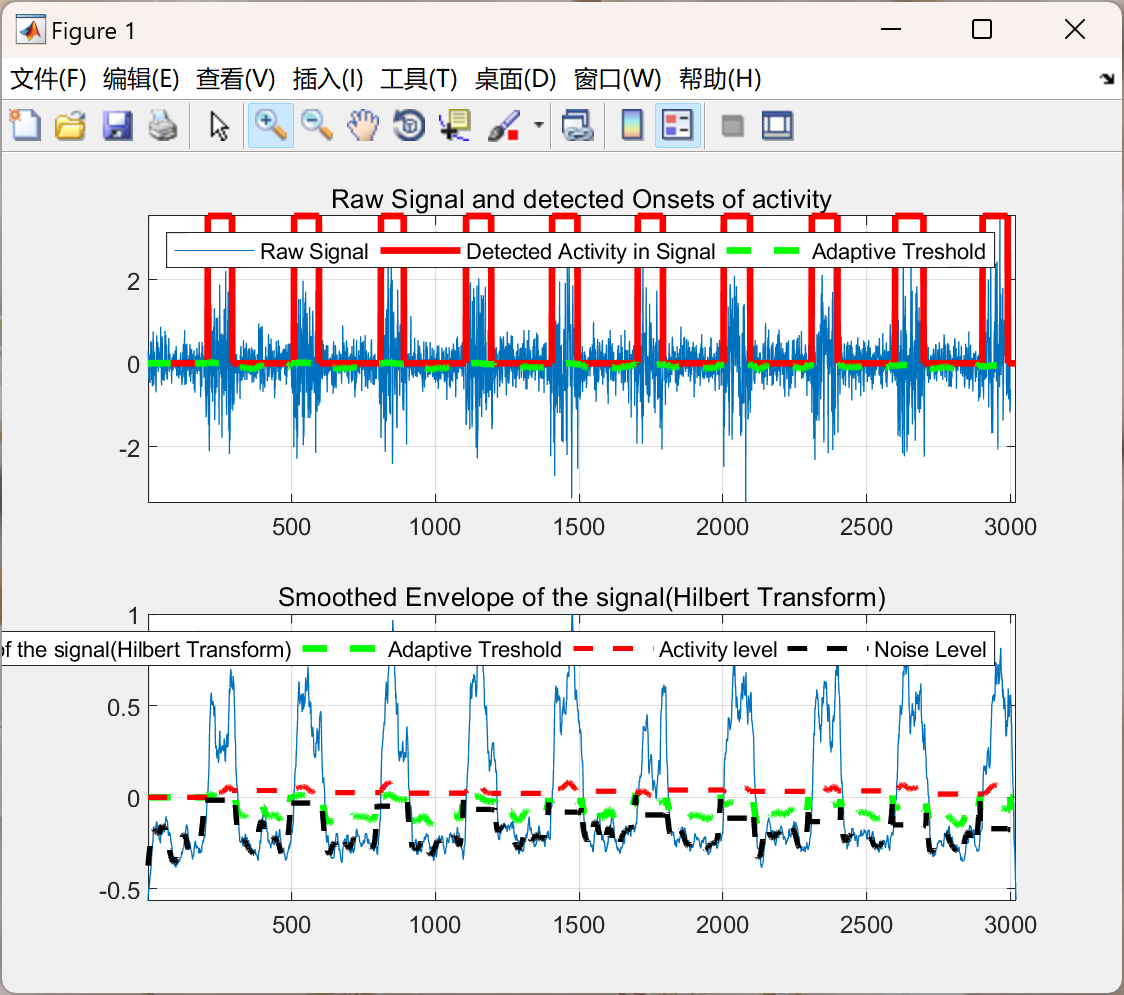
本研究旨在探讨利用 Hilbert transform 技术实现对噪声信号中活动的自动检测。Hilbert transform 作为一种有效的数学工具,能够对信号进行处理和分析。通过该方法,可以从复杂的噪声背景中提取出有价值的信息,准确识别出信号中的活动部分。这一技术在众多领域具有重要应用,如通信、生物医学工程、声学等,有望提高信号处理的准确性和效率,为相关领域的研究和实际应用提供有力支持。
📚2 运行结果
部分代码:
function alarm = envelop_hilbert(y,Smooth_window,threshold_style,DURATION,gr)
%% function alarm = envelop_hilbert(y,Smooth_window,threshold_style,DURATION,gr)
%% ======================= Inputs ================================ %%
% y = Raw input signal to be analyzed
% Smooth_window :this is the window length used for smoothing your signal
% in terms of number of samples
% threshold_style : set it 1 to have an adaptive threshold OR set it 0
% to manually select the threshold from a plot
% DURATION : Number of the samples that the signal should stay in terms of
% number of samples
% gr = make it 1 if you want a plot and 0 when you dont want a plot

%===========================================
% Tuning parameters for the best results;
%===========================================
% 1. DURATION is correlated to your sampling frequency, you can use a multiple
% of your sampling frequency e.g. round(0.050*SamplingFrequency)
% 2. Smooth_window is correlated to your sampling frequency, you can use a multiple
% of your sampling frequency e.g. round(0.0500*SamplingFrequency), this is
% the window length used for smoothing your signal

%% ======================= Outputs ================================== %%
% alarm : vector resembeling the active parts of the signal
%% ======================= Method =================================== %%
% Calculates the analytical signal with the help of hilbert transfrom,
% takes the envelope and smoothes the signal. Finally , with the help of an
% adaptive threshold detects the activity of the signal where at least a
% minimum number of samples with the length of
% (DURATION) Samples should stay above the threshold). The threshold is a
% computation of signal noise and activity level which is updated online.

%% Example and Demo
% To run demo mode simply execute the following line without any input;
% Example 1 :
% alarm = envelop_hilbert()
% The script generates one artificial signal and analysis that
% v = repmat([.1*ones(200,1);ones(100,1)],[10 1]); % generate true variance profile
% y = sqrt(v).*randn(size(v));

% Example 2 : For real world signals with a certain Sampling frequency
% called (Fs) (In this example a smoothing window with length 200 msec,)
% alarm = envelop_hilbert(signal,round(0.050*Fs),1,round(0.020*Fs),1)


%%

%--------------------------- input handling ---------------------------%
if nargin < 5
    gr = 1;
    if nargin < 4
        DURATION = 20;                                                     % default
        if nargin < 3
           threshold_style = 1;                                            % default 1 , means it is done automatic
           if nargin < 2
             Smooth_window = 20;                                           % default for smoothing length
             if  nargin < 1
               v = repmat([.1*ones(200,1);ones(100,1)],[10 1]);            % generate true variance profile
               y = sqrt(v).*randn(size(v));
             end

           end
        end
    end
end

%% ======= calculate the analytical signal and get the envelope ====== %%
test=y(:);
analytic = hilbert(test);
env = abs(analytic);

%% =========== take the moving average of analytical signal =========== %%
env = conv(env,ones(1,Smooth_window)/Smooth_window);                       % smooth
env = env(:) - mean(env);                                                  % get rid of offset
env = env/max(env);                                                        % normalize


%% ====================== threshold the signal =============== %%
if threshold_style == 0
   hg=figure;plot(env);title('Select a threshold on the graph')
   [~,THR_SIG] =ginput(1);
   close(hg);
end
% ------------------------- Threshold Style ---------------------- %
if threshold_style
   THR_SIG = 4*mean(env);
end

nois = mean(env)*(1/3);                                 % noise level
threshold = mean(env);                                  % signal level

% ------------------- Initialize Buffers -------------------------%
thres_buf  = zeros(1,length(env)-DURATION);
nois_buf = zeros(1,length(env)-DURATION);
THR_buf = zeros(1,length(env));
h=1;
🎉3 参考文献
文章中一些内容引自网络,会注明出处或引用为参考文献,难免有未尽之处,如有不妥,请随时联系删除。
[1]李贤山,田宇,魏理林,等.基于PSO-MCKD的弧齿锥齿轮声信号辅助检测方法[J/OL].机械传动:1-8[2024-08-26].http://kns.cnki.net/kcms/detail/41.1129.TH.20240812.1714.002.html.
[2]Nie D ,Zhu X ,Liu M , et al. Molecularly imprinted polymer-based electrochemical sensor for rapid detection of masked deoxynivalenol with Mn-doped CeO2 nanozyme as signal amplifier[J]. Journal of Hazardous Materials,2024,477.
🌈4 Matlab代码实现


 393
393

 被折叠的 条评论
为什么被折叠?
被折叠的 条评论
为什么被折叠?
 到【灌水乐园】发言


