


 这篇博客介绍了如何使用Pandas处理和分析多个中国城市的PM2.5数据,通过创建PeriodIndex将时间数据整合,并将其设置为DataFrame的索引。然后,对数据进行降采样以按周统计平均值,以便观察趋势。最后,通过Matplotlib绘制了美国和中国PM2.5浓度的对比图表,展示了不同城市在同一时间段内的空气质量变化。
一、问题和数据
现在我们有北京、深圳和沈阳5个城市空气质量戴护具,请绘制出5个城市的PM2.5随时间的变化情况。
观察这组数据中的时间结构,并不是字符串,这个时候我们应该怎么办?
数据来源: https://www.kaggle.com/uciml/pm25-data-for-five-chinese-cities
下面观察一下数据是什么样子的:
import pandas as pd
file_path="../data/PM2.5/BeijingPM20100101_20151231.csv"##.//表示上一级目录
df=pd.read_csv(file_path)
print(df.head())
print(df.info())
No year month day hour ... TEMP cbwd Iws precipitation Iprec 0 1 2010 1 1 0 ... -11.0 NW 1.79 0.0 0.0 1 2 2010 1 1 1 ... -12.0 NW 4.92 0.0 0.0 2 3 2010 1 1 2 ... -11.0 NW 6.71 0.0 0.0 3 4 2010 1 1 3 ... -14.0 NW 9.84 0.0 0.0
[5 rows x 18 columns]
<class 'pandas.core.frame.DataFrame'>
RangeIndex: 52584 entries, 0 to 52583
Data columns (total 18 columns):
# Column Non-Null Count Dtype
--- ------ -------------- -----
0 No 52584 non-null int64
1 year 52584 non-null int64
2 month 52584 non-null int64
3 day 52584 non-null int64
4 hour 52584 non-null int64
5 season 52584 non-null int64
6 PM_Dongsi 25052 non-null float64
7 PM_Dongsihuan 20508 non-null float64
8 PM_Nongzhanguan 24931 non-null float64
9 PM_US Post 50387 non-null float64
10 DEWP 52579 non-null float64
11 HUMI 52245 non-null float64
12 PRES 52245 non-null float64
13 TEMP 52579 non-null float64
14 cbwd 52579 non-null object
15 Iws 52579 non-null float64
16 precipitation 52100 non-null float64
17 Iprec 52100 non-null float64
dtypes: float64(11), int64(6), object(1)
二、pd.PeriodIndex()
之前所学习的DatetimeIndex可以理解为时间戳
那么现在我们要学习的PeriodIndex可以理解为时间段
#把分开的字符串通过periodindex转换成pandas里的事件类型
period = pd.PeriodIndex(year=df["year"],month=df["month"],day=df["day"],hour=df["hour"],freq="H")
df["datatime"]=period
print(df.head(10))
我们可以看出来分开地方时间被合并起来了,新定义了datatime这一列
No year month day ... Iws precipitation Iprec datatime
0 1 2010 1 1 ... 1.79 0.0 0.0 2010-01-01 00:00
1 2 2010 1 1 ... 4.92 0.0 0.0 2010-01-01 01:00
2 3 2010 1 1 ... 6.71 0.0 0.0 2010-01-01 02:00
3 4 2010 1 1 ... 9.84 0.0 0.0 2010-01-01 03:00
4 5 2010 1 1 ... 12.97 0.0 0.0 2010-01-01 04:00
5 6 2010 1 1 ... 16.10 0.0 0.0 2010-01-01 05:00
6 7 2010 1 1 ... 19.23 0.0 0.0 2010-01-01 06:00
##把datatime设置为索引
df.set_index("datatime",inplace=True)
#处理缺失数据,删除缺失数据
##print(df["PM_US Post"])
data=df["PM_US Post"].dropna()
##画图
_x=data.index
_y=data.values
plt.figure(figsize=(20,8),dpi=80)
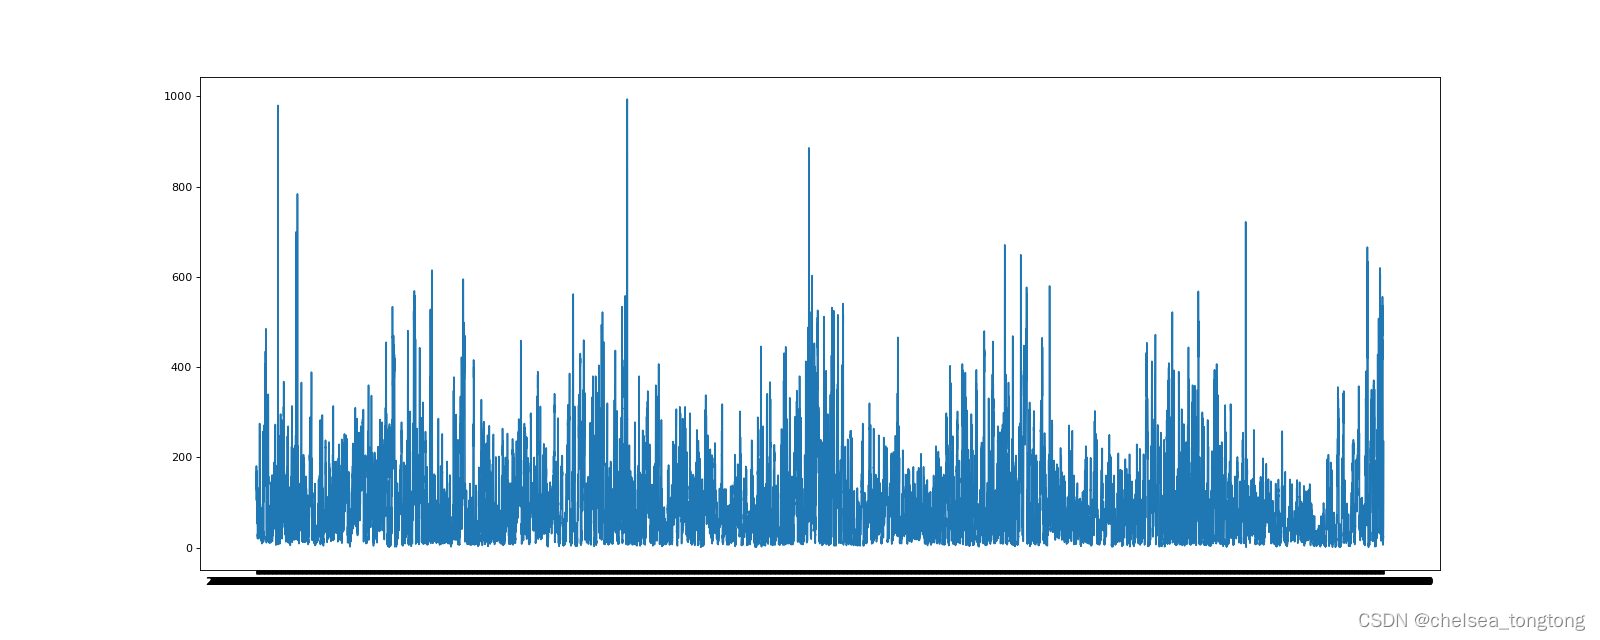
plt.plot(range(len(_x)),_y)###x为x轴数据,y为y轴数据,x轴如果要标签则range(len())
#plt.xticks(range(0,len(_x),20),list(_x)[::20])##前面是x的值,后面是x值对应的标签,害怕步长为一太多,所以取20步长
plt.show()以上这幅图就是按照小时进行画图观察变化情况,折线图都变成柱形图了,因为其是按照小时进行观察,所以我们需要降采样进行统计观察:
#进行降采样
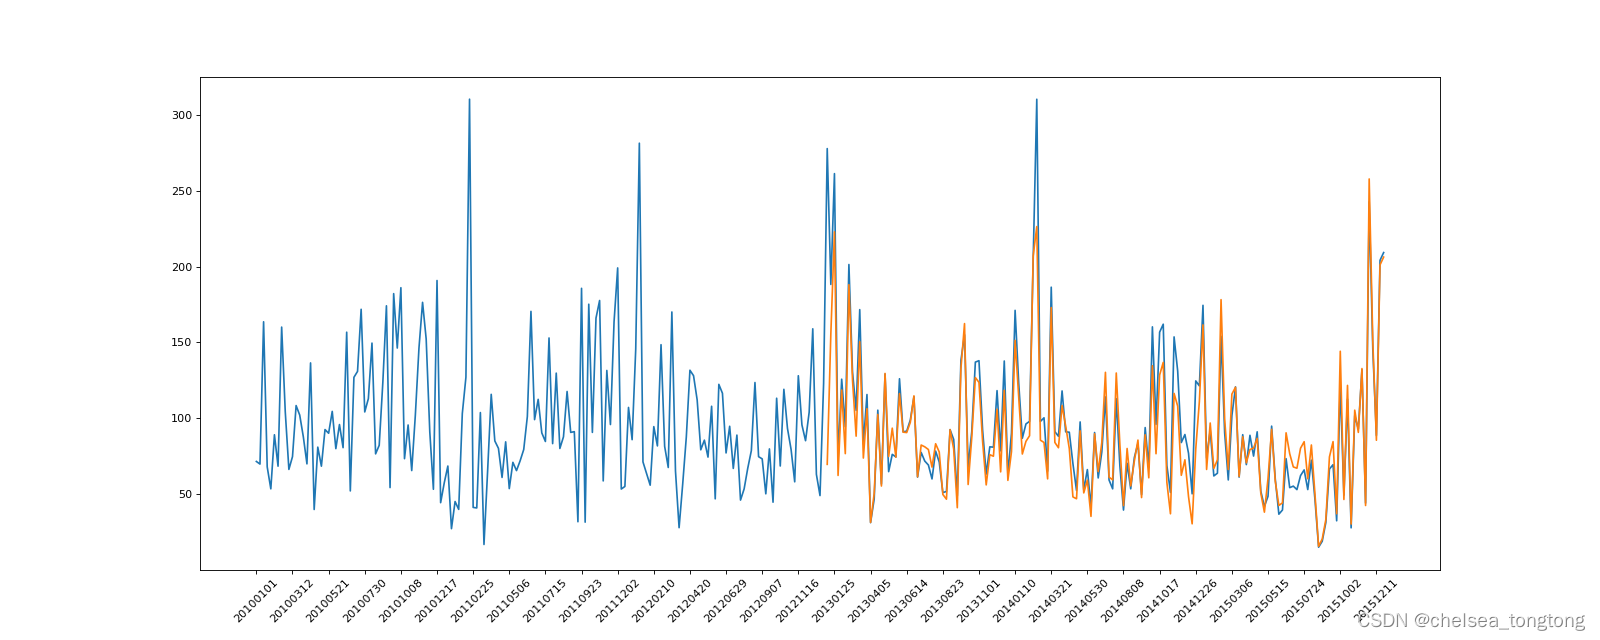
df=df.resample("7D").mean()NEXT,我们确定横坐标的区间,确保图像画出来好看些
print(df.shape)##观察df的长度(313.17)
plt.xticks(range(0,len(_x),10),list(_x)[::10],rotation=45)##前面是x的值,后面是x值对应的标签,害怕步长为一太多,所以取10步长
最后出来的图是美国的,我们加入中国的数据,将两国家的数据放在一个图上进行对比,我们能发现运用dropna()删除缺失值之后两国家数据长度不相同,所以出来的图如下:
完整代码如下:
import time
import pandas as pd
from matplotlib import pyplot as plt
file_path="../data/PM2.5/BeijingPM20100101_20151231.csv"##.//表示上一级目录
df=pd.read_csv(file_path)
print(df.head())
print(df.info())
#把分开的字符串通过periodindex转换成pandas里的事件类型
period = pd.PeriodIndex(year=df["year"],month=df["month"],day=df["day"],hour=df["hour"],freq="H")
df["datatime"]=period
print(df.head(10))
##把datatime设置为索引
df.set_index("datatime",inplace=True)
#进行降采样
df=df.resample("7D").mean()
print(df.shape)##观察df的长度(313.17)
#处理缺失数据,删除缺失数据
##print(df["PM_US Post"])
data=df["PM_US Post"]##dropna是缺失值删除
data_china=df["PM_Dongsi"]
##画图
_x=data.index
_x=[i.strftime("%Y%m%d") for i in _x]
_x_china=[i.strftime("%Y%m%d") for i in data_china.index]
_y=data.values
_y_china=data_china.values
plt.figure(figsize=(20,8),dpi=80)
plt.plot(range(len(_x)),_y,label="US_POST")
plt.plot(range(len(_x_china)),_y_china,label="CN_POST")###x为x轴数据,y为y轴数据,x轴如果要标签则range(len())
plt.xticks(range(0,len(_x),10),list(_x)[::10],rotation=45)##前面是x的值,后面是x值对应的标签,害怕步长为一太多,所以取20步长
plt.show()
三、函数回顾
感觉虽然每都学一点但很多学过的函数再次遇到还是会忘记,所以我接下来的博客里最后都会有函数的复习,温故而知新咩。
i.shftime("%Y%m%d") | srtftime()格式化一个时间字符串 |
df.resample().mean() | resample().mean)降采样 |
| df[""].dropna | .dropna删除缺失值 |
| plt.sticks(x,x_label) | plt.sticks()前面是x的值,后面是x的标签 |
| df.shape | 知道df是几行几列的(100,20) |


 160
160

 被折叠的 条评论
为什么被折叠?
被折叠的 条评论
为什么被折叠?
 到【灌水乐园】发言


