


vue使用maptalks绘制地图教程
版本:
vue:2.7.14
vue-cli:3.2.1
maptalks:1.0.0
一、加载最简单的地图
- 在github下载js文件,链接:https://github.com/maptalks/maptalks.js/releases
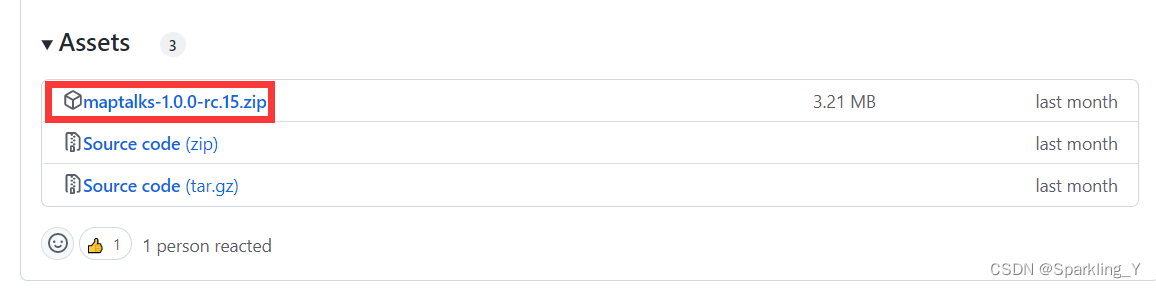
- 解压后把要用到文件的放在public下面
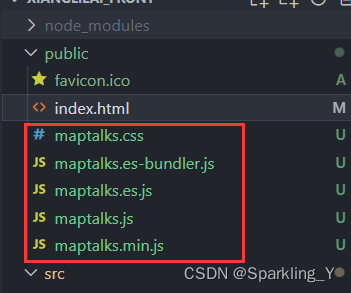
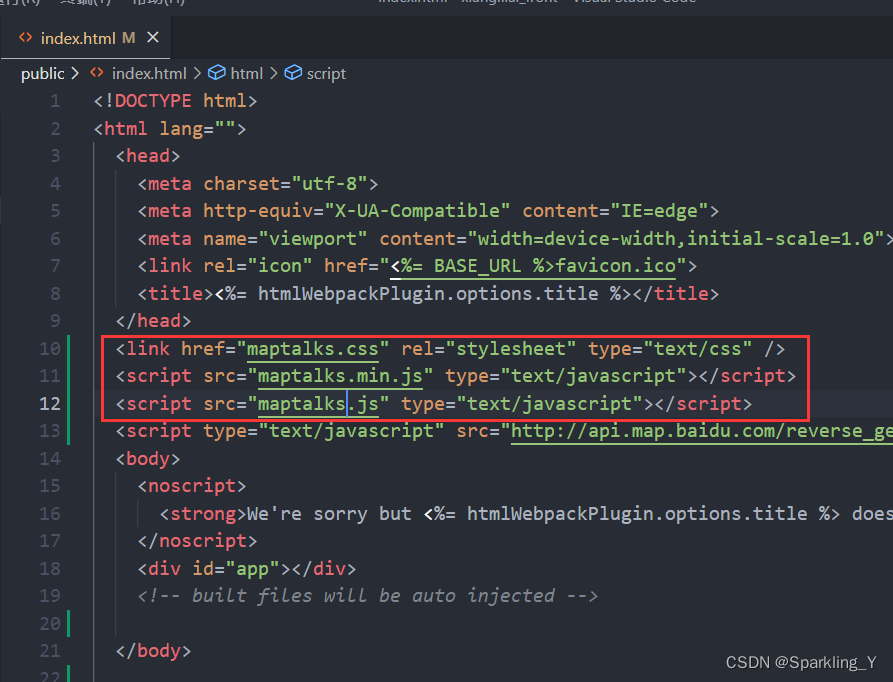
- 打开public下面的index.html,引入要用的文件:
  <link href="maptalks.css" rel="stylesheet" type="text/css" />
  <script src="maptalks.min.js" type="text/javascript"></script>
  <script src="maptalks.js" type="text/javascript"></script>
4. 在要展示地图的vue文件里,加入以下代码:
<template>
<div class="map_container">
<div style="width:800px;height:600px;" id="map"></div>
</div>
</template>
<script scoped>
export default {
name: 'Login',
data() {
return {
map: null,
}
},
methods: {},
mounted() {
map = new maptalks.Map('map', {
center: [0, 0],
zoom: 2,
baseLayer: new maptalks.TileLayer('base', {
'urlTemplate' : 'http://{s}.basemaps.cartocdn.com/light_all/{z}/{x}/{y}.png',
'subdomains' : ['a','b','c','d'],
'attribution' : '© <a href="http://www.osm.org/copyright">OSM</a> contributors, '+
'© <a href="https://carto.com/attributions">CARTO</a>'
})
});
},
}
</script>
<style>
.map_container{
margin: 20px;
}
</style>
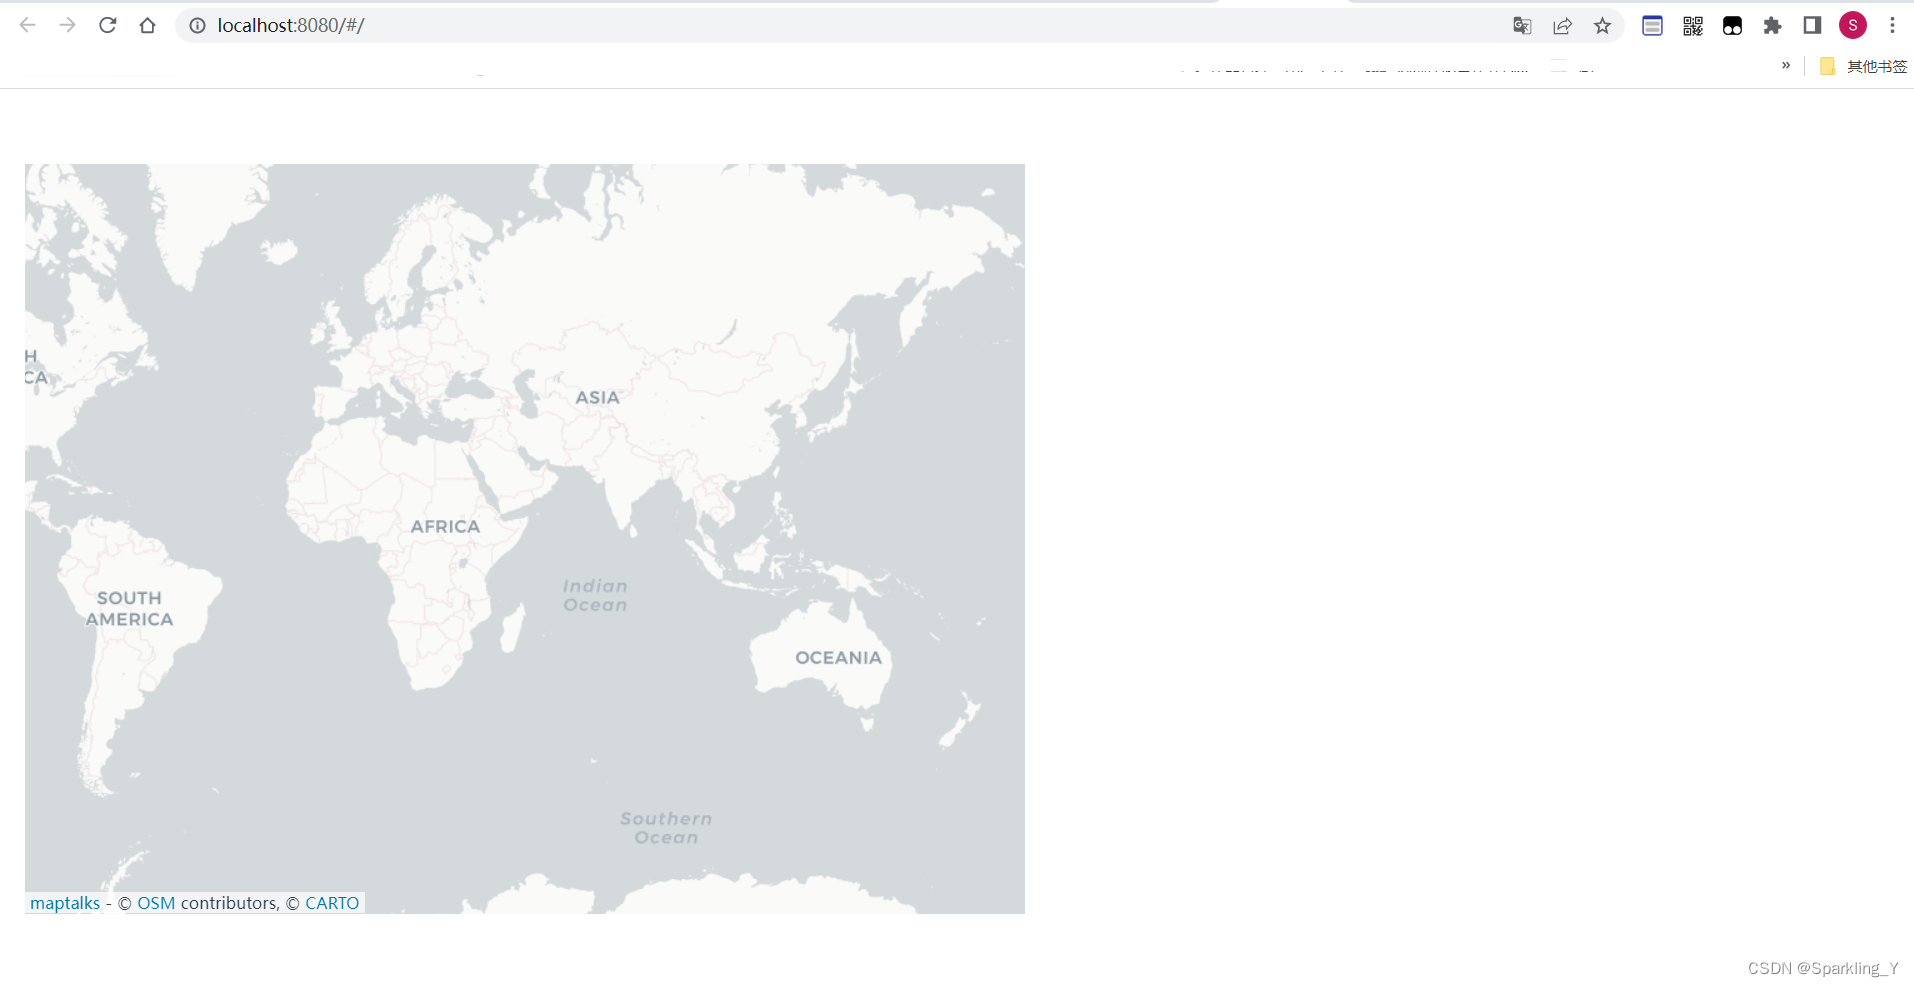
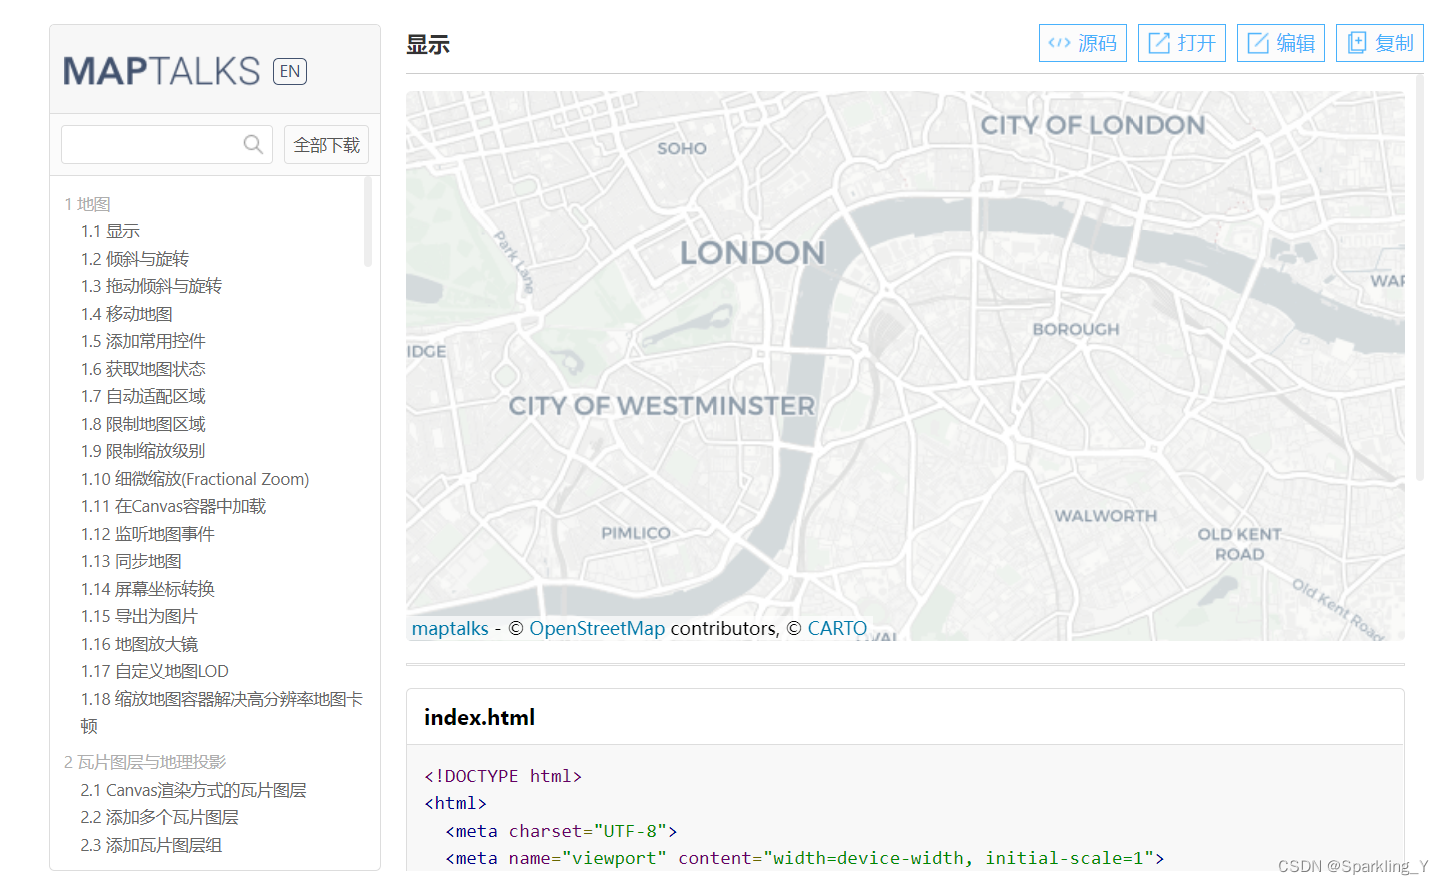
- 使用
npm run serve运行,效果如图:
二、加载更多地图样式
官网链接:https://maptalks.org/examples/cn/map/load/#map_load
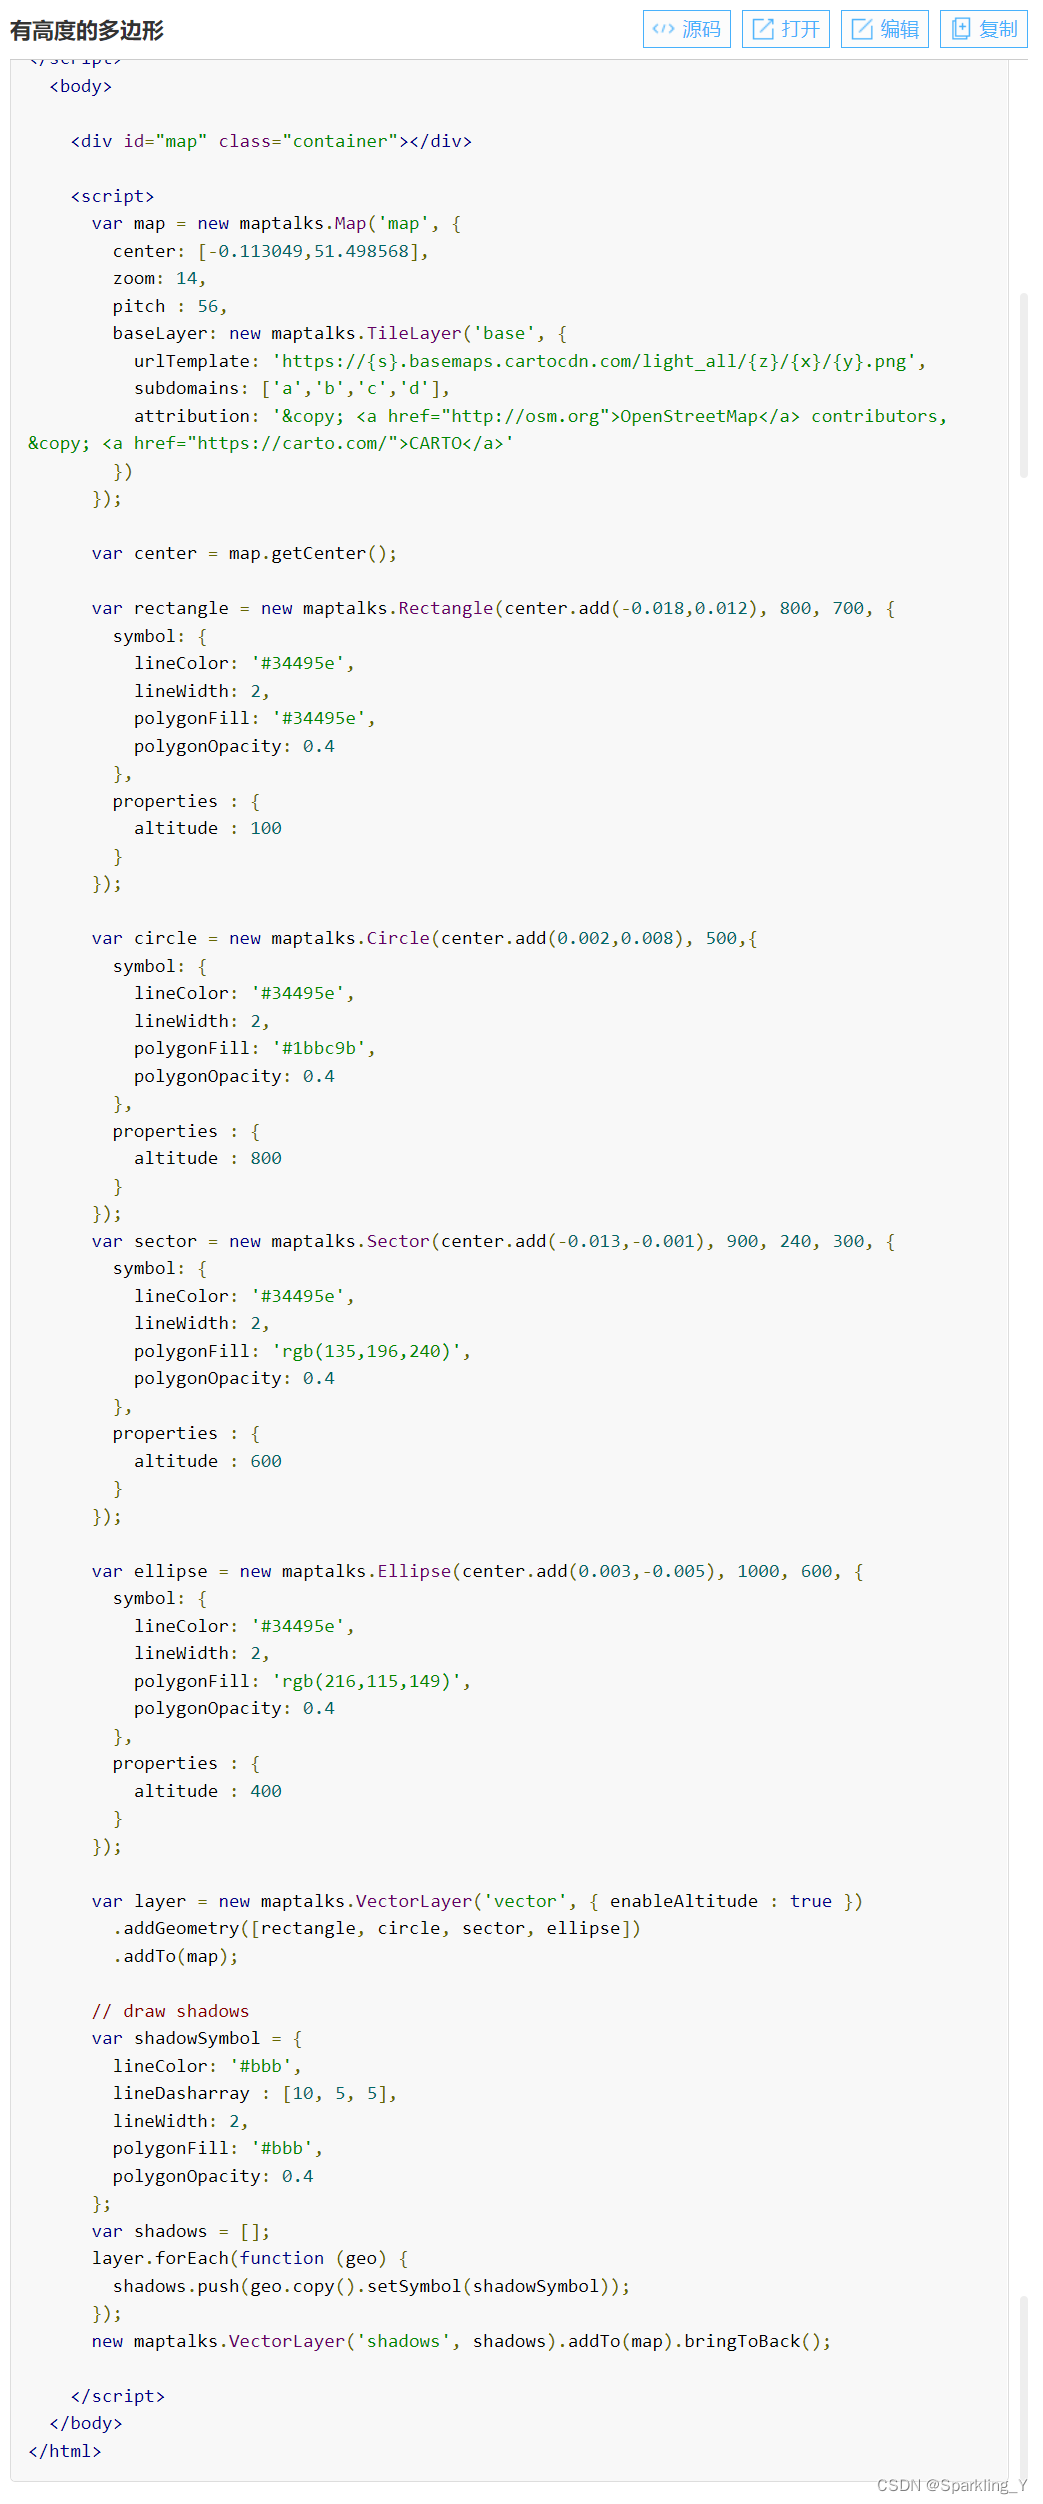
教程中有源码,可以将其迁移到vue中,下面用“绘制有高度的多边形”示例:
- 先在
.vue文件的<template>里照着下面写个<div>块
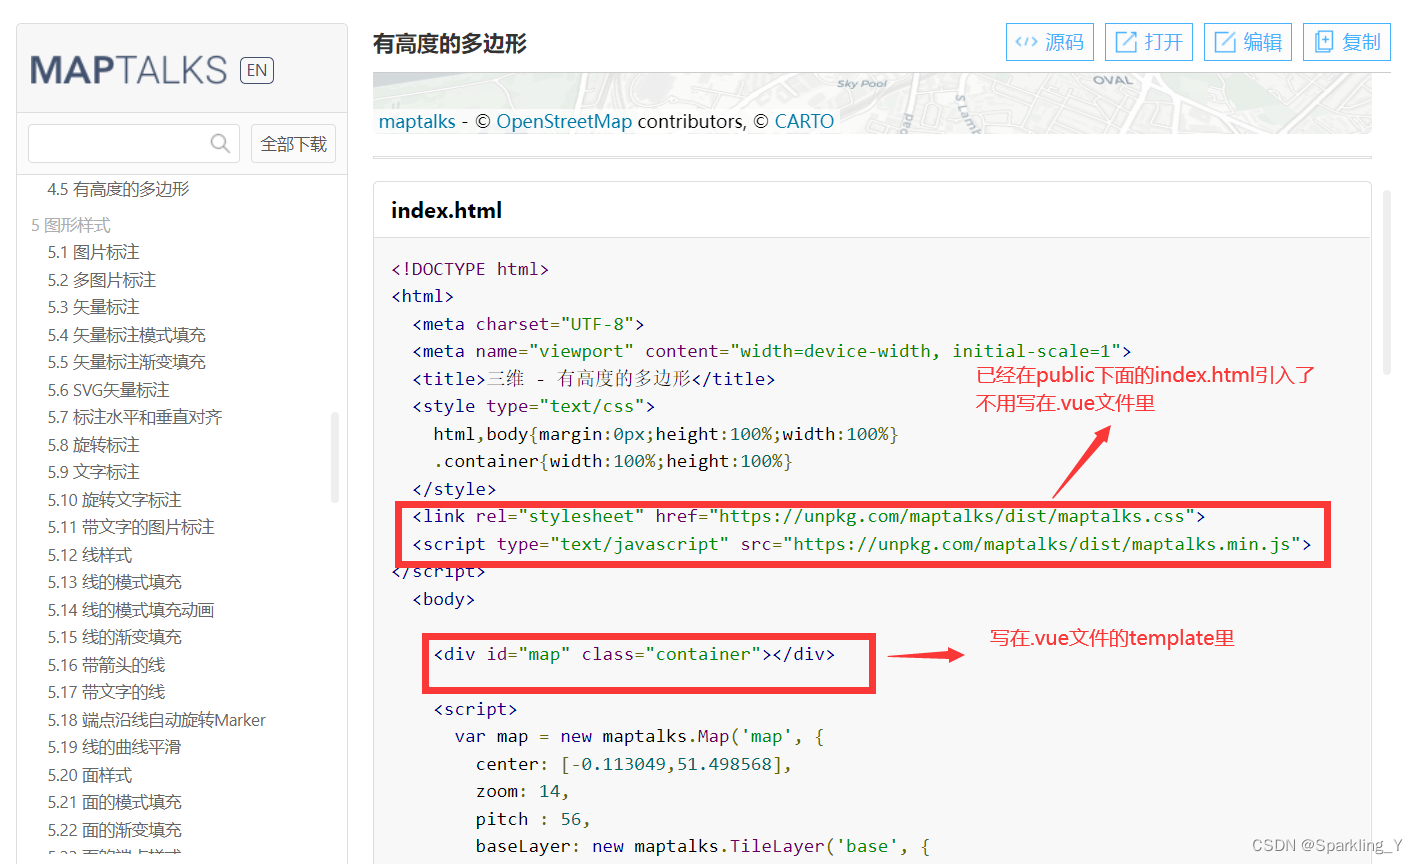
- 然后把下面
<script>里的代码全放在mounted函数里就可以了。
<script scoped>
	export default {
		name: 'Login',
		data() {
			return {
				map: null,
			}
		},
		methods: {
		},
		mounted() {//放这儿
		},
	}
</script>
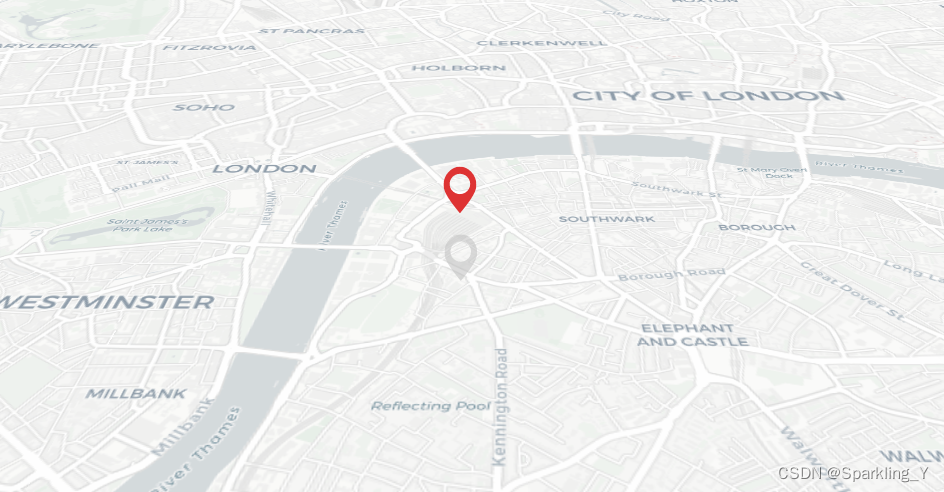
3. 使用npm run serve运行,效果如图:


 1162
1162


 被折叠的 条评论
为什么被折叠?
被折叠的 条评论
为什么被折叠?
 到【灌水乐园】发言


