


爬取国民经济核算数据(https://gdp.gotohui.com/)
import requests
from bs4 import BeautifulSoup
import pandas as pd
# 发送HTTP请求获取网页内容
url = 'https://gdp.gotohui.com/'
response = requests.get(url)
# 解析网页内容,找到表格数据所在的HTML标签
soup = BeautifulSoup(response.content, 'html.parser')
table = soup.find('table')
# 将表格数据转换为DataFrame对象
df1 = pd.read_html(str(table))[0]
df11=df1.head(23)
df11
# 发送HTTP请求获取网页内容
url = 'https://gdp.gotohui.com/data-0/1'
response = requests.get(url)
# 解析网页内容,找到表格数据所在的HTML标签
soup = BeautifulSoup(response.content, 'html.parser')
table = soup.find('table')
# 将表格数据转换为DataFrame对象
df2 = pd.read_html(str(table))[0]
df2.columns=['年份','一季度(亿元)','二季度(亿元)','三季度(亿元)','四季度(亿元)']
df22=df2.head(24)
df22
# 合并表格
result = pd.merge(df11, df22, how='left', on='年份')
result
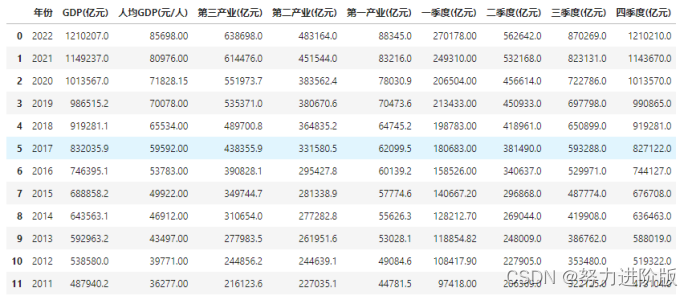
把上面获取的gdp数据保存为CSV格式并进行读取
import pandas as pd
import matplotlib.pyplot as plt
# 读取数据
data_path=open(r'D:\qq\gdp数据.csv',encoding='utf-8')
data=pd.read_csv(data_path)
# 提取GDP数据
GDP_all = data.loc[:, 'GDP(亿元)']
GDP_avg = data.loc[:, '人均GDP(元/人)']
GDP_one = data.loc[:, '一季度(亿元)']
GDP_two = data.loc[:, '二季度(亿元)']
GDP_thr = data.loc[:, '三季度(亿元)']
GDP_fou = data.loc[:, '四季度(亿元)']
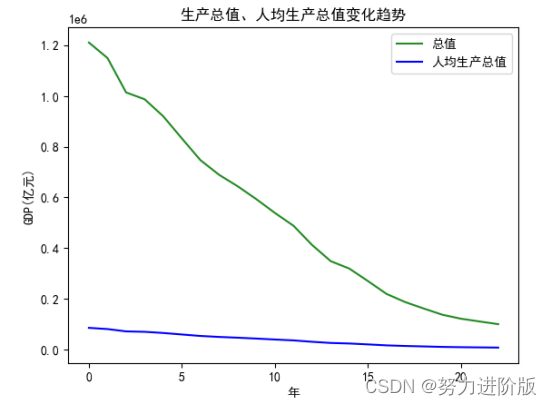
折线图
import matplotlib.pyplot as plt
plt.rcParams['font.family'] = 'sans-serif'
plt.rcParams['font.sans-serif'] = ['SimHei']
# 绘制折线图
plt.plot(GDP_all.index, GDP_all.values, label='总值',color='ForestGreen')
plt.plot(GDP_avg.index, GDP_avg.values, label='人均生产总值',color='blue')
plt.legend()
plt.title('生产总值、人均生产总值变化趋势')
plt.xlabel('年')
plt.ylabel('GDP(亿元)')
plt.show()
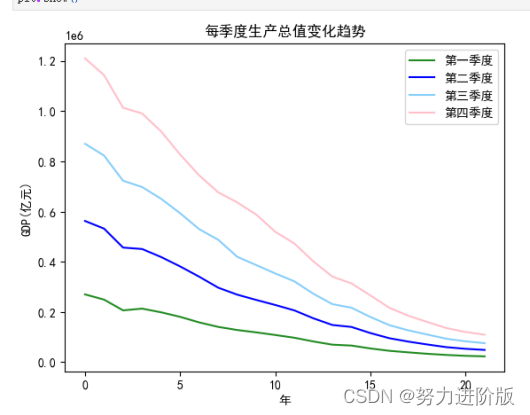
然后下面同样的方法把四个季度的数据导入plt.plot()方法中进行绘制四个季度的折线图。
import matplotlib.pyplot as plt
plt.rcParams['font.family'] = 'sans-serif'
plt.rcParams['font.sans-serif'] = ['SimHei']
# 绘制折线图
plt.plot(GDP_one.index, GDP_one.values, label='第一季度',color='ForestGreen')
plt.plot(GDP_two.index, GDP_two.values, label='第二季度',color='blue')
plt.plot(GDP_thr.index, GDP_thr.values, label='第三季度',color='LightSkyBlue')
plt.plot(GDP_fou.index, GDP_fou.values, label='第四季度',color='pink')
plt.legend()
plt.title('每季度生产总值变化趋势')
plt.xlabel('年')
plt.ylabel('GDP(亿元)')
plt.show()


 281
281


 被折叠的 条评论
为什么被折叠?
被折叠的 条评论
为什么被折叠?
 到【灌水乐园】发言


