


使用pie绘制绘制饼图
数据来源-2023泰迪杯(b题)
代码如下:
首先导入我们需要的python库
import pandas as pd
import numpy as np
import matplotlib.pyplot as plt
plt.rcParams['axes.unicode_minus'] = False #负号显示
plt.rcParams["font.sans-serif"]=["SimHei"]#中文显示
然后读取我们的数据并对数据进行分组
#读取数据
df =pd.DataFrame(pd.read_csv(r'data_qinxi.csv',encoding='GBK'))
# 按产品大类编码、销售渠道名称分类,并计算每组的订单需求量总和
grouped_data = df.groupby(['产品大类编码', '销售渠道名称'])['订单需求量'].sum()
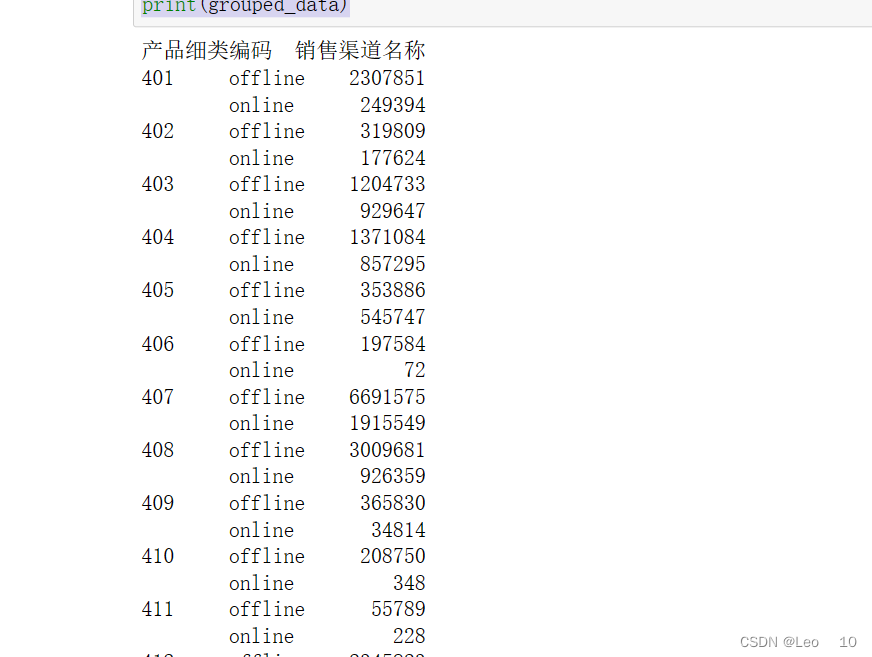
# 按产品细类编码、销售渠道名称分类,并计算每组的订单需求量总和
grouped_data1 = df.groupby(['产品细类编码', '销售渠道名称'])['订单需求量'].sum()
# 输出结果
print(grouped_data)
# 输出结果
print(grouped_data1)输出结果如图:

绘制图形:
%matplotlib auto#画布显示

first_product_category_codes = ['301', '302', '303', '304', '305', '306', '307', '308']
first_offline_sales_demand = [353886, 3009681, 2769974, 365830, 2345823, 7011384, 1204733, 1371084]
first_online_sales_demand = [545747, 926359, 250042, 34814, 826069, 2093173, 929647, 857295]
# plot the offline sales demand data
ax1 = plt.subplot2grid([2,2],(0,0))#把画布分为2×2的区域,此图在(0,0)区域
ax1.pie(first_offline_sales_demand, labels=first_product_category_codes, autopct='%1.1f%%')#autopct:小数点设置
plt.title('线下产品大类需求量')#标题设置
plt.show()
# plot the online sales demand data
ax1 = plt.subplot2grid([2,2],(0,1))
ax1.pie(first_online_sales_demand, labels=first_product_category_codes, autopct='%1.1f%%')
plt.title('线上产品大类需求量')
plt.show()


# product category codes and sales channel demand data
second_product_category_codes = ['401','402','403','404','405','406','407','408','409','410','411','412']
second_offline_sales_demand = [2307851,319809,1204733,1371084,353886,197584,6691575,3009681,365830,208750,55789,2345823]
second_online_sales_demand = [249394,177624,929647,857295,545747,72,1915549,926359,34814,348,228,826069]
ax1 = plt.subplot2grid([2,2],(1,0))
ax1.pie(second_offline_sales_demand, labels=second_product_category_codes, autopct='%1.1f%%',)
plt.title('线下产品细类类需求量')
plt.show()

# plot the online sales demand data
ax1 = plt.subplot2grid([2,2],(1,1))
ax1.pie(second_online_sales_demand, labels=second_product_category_codes, autopct='%1.1f%%')
plt.title('线上产品细类需求量')
plt.show()
结果显示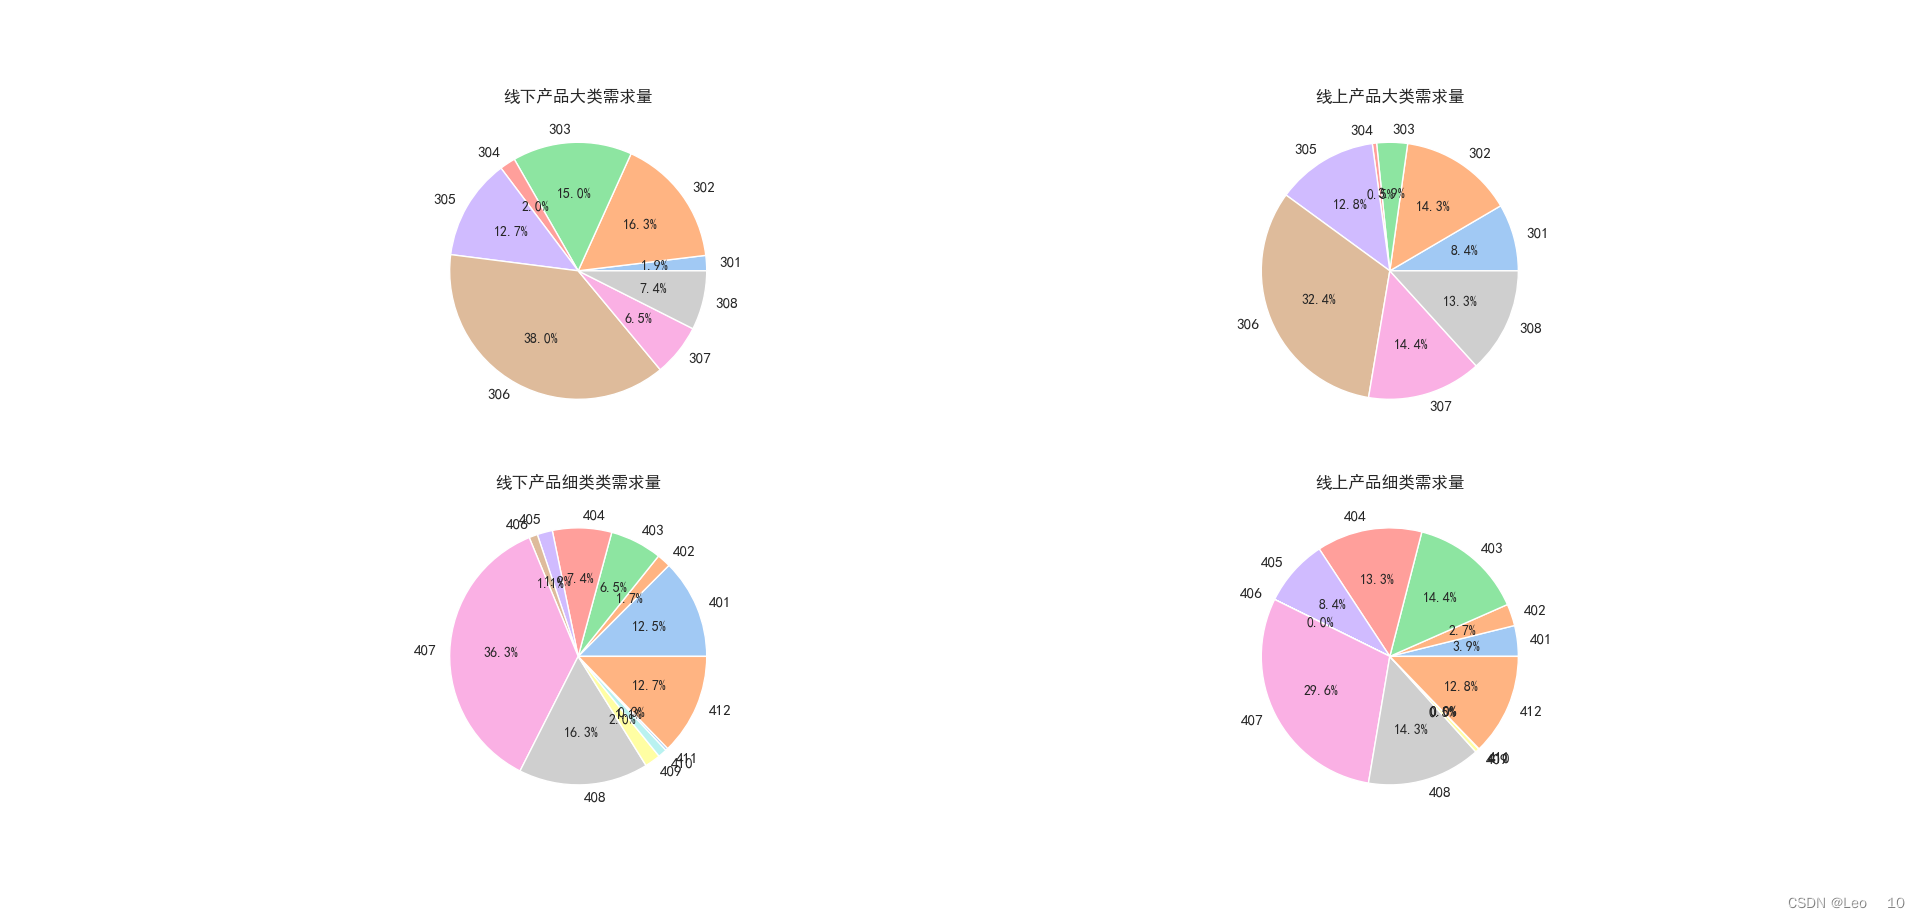
注:如有错误,敬请指出


 8万+
8万+


 被折叠的 条评论
为什么被折叠?
被折叠的 条评论
为什么被折叠?
 到【灌水乐园】发言


