


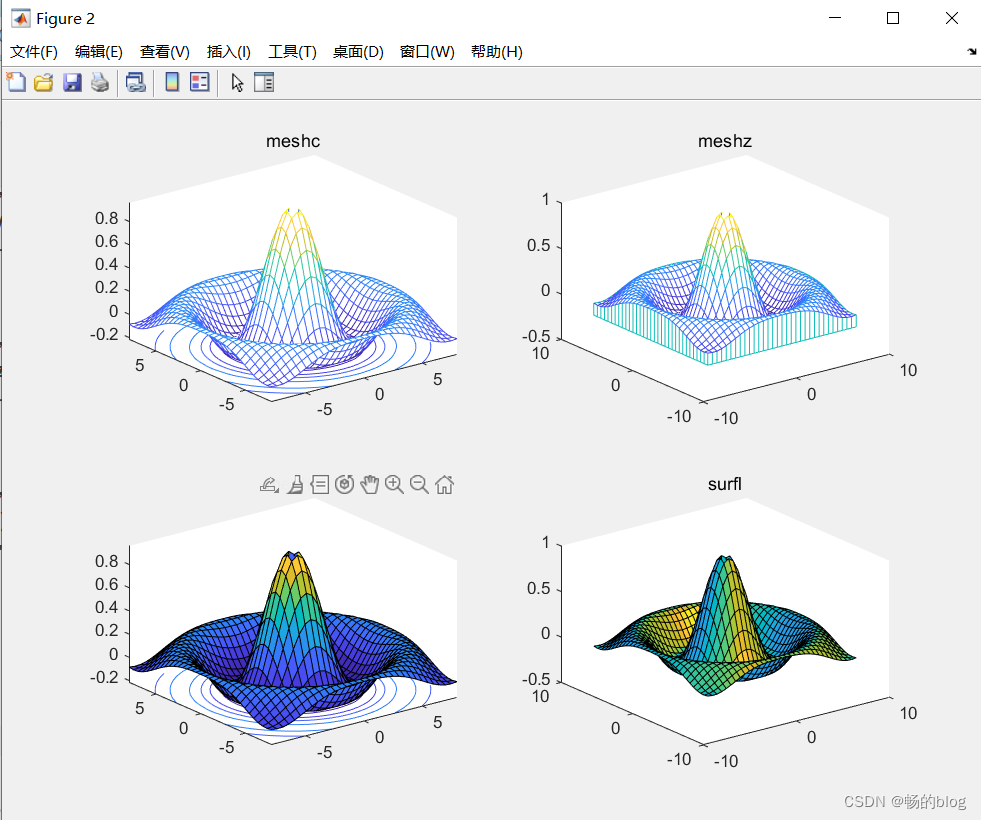
%example
[x,y]=meshgrid(-8:0.5:8);
z=sin(sqrt(x.^2+y.^2))./sqrt(x.^2+y.^2+eps);%eps是为了保证分母不为0
subplot(2,2,1);
meshc(x,y,z);% meshc - 网格曲面图下的等高线图
title('meshc');
grid;
subplot(2,2,2);
meshz(x,y,z);% meshz - 带帷幕的网格曲面图
title('meshz');
grid;
subplot(2,2,3);
surfc(x,y,z);% surfc - 曲面图下的等高线图
title('meshc');
grid;
subplot(2,2,4);
surfl(x,y,z);% surfl - 具有基于颜色图的光照的曲面图
title('surfl');
grid;


 1万+
1万+


 被折叠的 条评论
为什么被折叠?
被折叠的 条评论
为什么被折叠?
 到【灌水乐园】发言


