


目录
(1)nan: not a number; inf: infinity(无穷)
零、基础概念
数据分析:把大量的数据进行统计和整理得出结论为后续的决策提供数据支持。
一、matplotlib画图
作用:将数据可视化呈现
1.简单使用
from matplotlib import pyplot as plt

def print_wd():

    x=range(2,26,2)
    y=[15,13,14.5,17,20,25,26,26,24,22,18,15]
    plt.plot(x,y)
    plt.show()

if __name__ == '__main__':
    print_wd()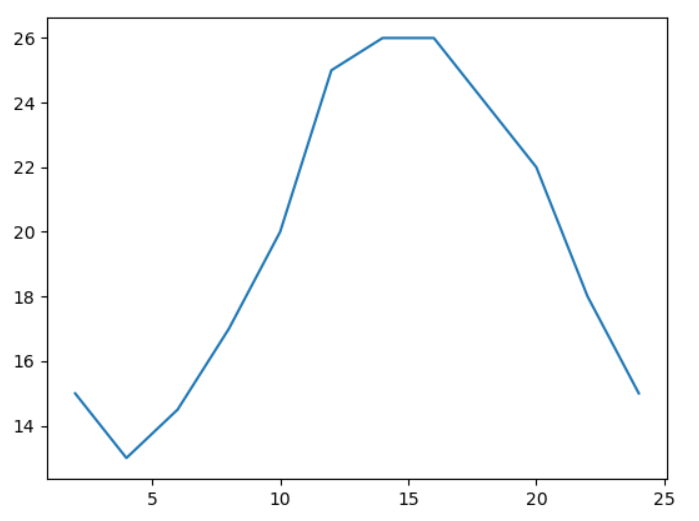
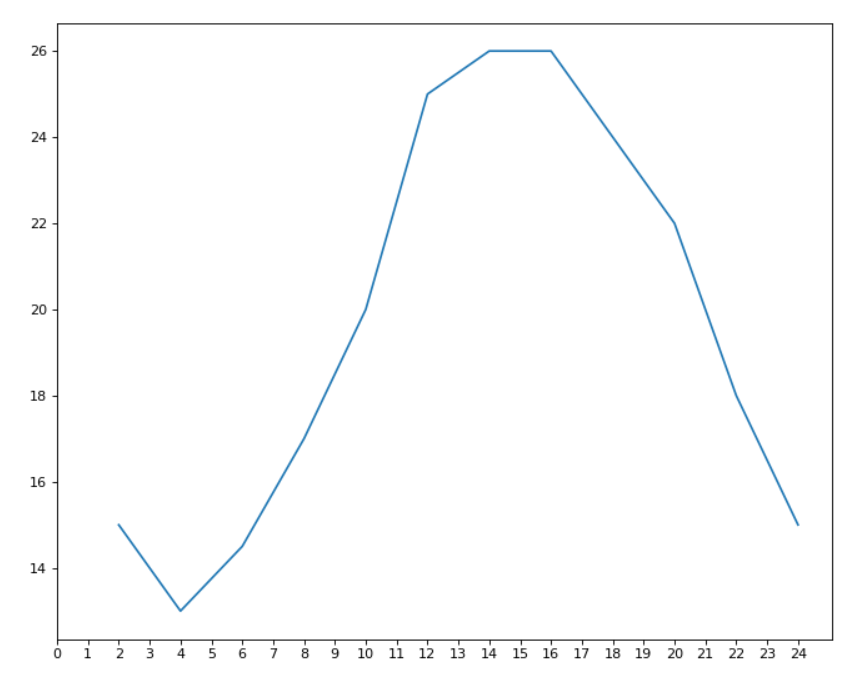
2.完善可视化内容
(1)设置刻度、图片大小清晰度、保存图片
from matplotlib import pyplot as plt

def print_wd():

    x=range(2,26,2)
    y=[15,13,14.5,17,20,25,26,26,24,22,18,15]

    #设置图片大小
    plt.figure(figsize=(10,8),dpi=80)#figsiza:图片大小;dpi:清晰度
    plt.plot(x,y)

    # 设置x(y)轴的刻度
    x_lables=[i for i in range(0,25)]
    plt.xticks(x_lables)#通过修改xticks(),yticks()内的参数调整x轴刻度

    # 保存图片
    plt.savefig("./wd.png")

    plt.show()
补充:直方图将plt.plot()改为plt.hist();散点图用plt.scatter()即可;竖(横)型条形图使用plt.bar()( plt.barh() )即可.多次绘制时记得将图x轴所对相对总轴作移动
(2)设置刻度、可视化正常显示中文、添加描述信息
import random
from matplotlib import pyplot as plt

def bh():
    y=[random.randint(20,35)for i in range(120)]
    x=range(0,120)


    plt.figure(figsize=(40,8),dpi=80)
    plt.plot(x,y)

    #设置刻度
    x_label=["10点{0}分".format(i) for i in range(60)]
    x_label+=["11点{0}分".format(i)for i in range(60)]
    plt.xticks(list(x)[::3], x_label[::3], rotation=45)
    # 查看所拥有的字体信息
    #print([f.name for f in matplotlib.font_manager.fontManager.ttflist])

    # 修改字体让中文正常显示
    plt.rcParams['font.sans-serif'] = ['SimHei']

    #设置描述信息
    plt.xlabel("时间")
    plt.ylabel("温度")
    plt.title("10点到12点的温度变化")

    plt.show()
(3)两条折线、绘制网格、添加图例
def friends():
    x=range(11,31)
    y1=[1,0,1,1,2,4,3,2,3,4,4,5,6,5,4,3,3,1,1,1]
    y2=[1,0,3,1,2,2,3,3,2,1,2,1,1,1,1,1,1,1,1,1]
    plt.figure(figsize=(10,6))
    plt.plot(x,y1,label="甲",color="orange",linestyle=':')#label属性设置图例
    plt.plot(x,y2,label="乙",linestyle='--')
    plt.rcParams['font.sans-serif'] = ['SimHei']

    x_labels=["{0}岁".format(i) for i in x]
    plt.xticks(list(x),x_labels,rotation=45)
    plt.yticks(range(0,8))

    plt.xlabel("年龄")
    plt.ylabel("交朋友的数量")
    plt.title("交友预测")

    #绘制网格
    plt.grid(alpha=0.4)#alpha设置透明度
    #添加图例
    plt.legend(loc='upper left')#loc改变图例所在位置

    plt.show()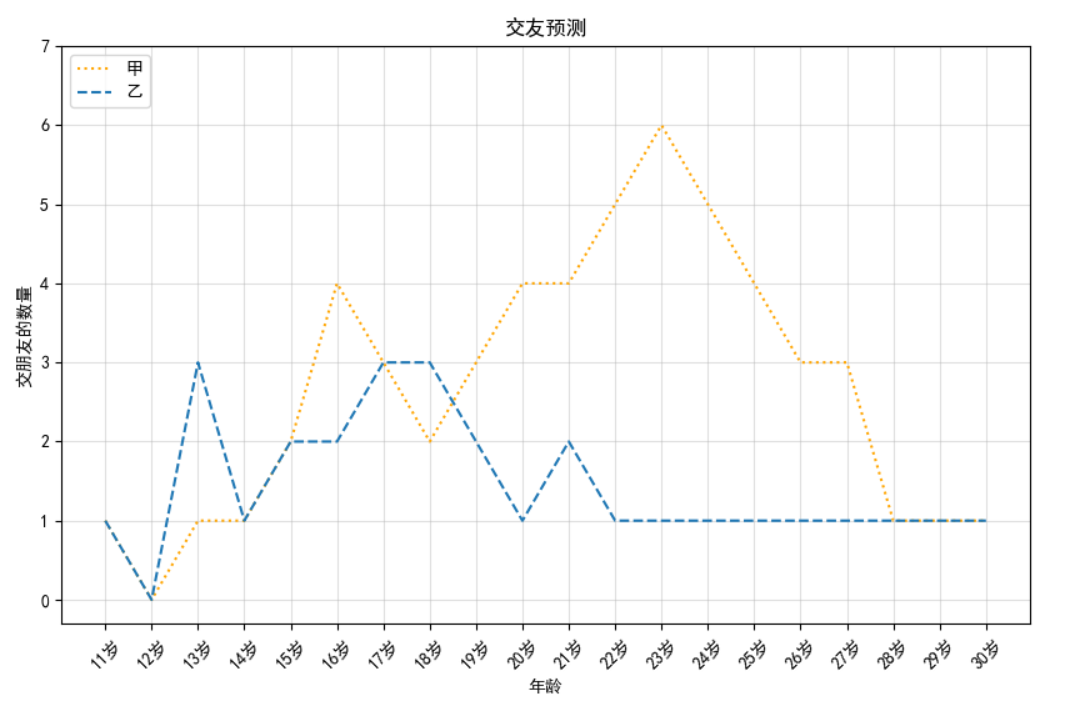
3.应用场景
可以根据https://matplotlib.org/stable/gallery/index.html#main-content来修改参数选择画的图
折线图:上升或下降表示统计数量的增减变化
直方图:显示连续多组数据分布情况
条形图:比较离散数据之间的差别
散点图:判断变量之间的关联趋势
补充:连续数据表示数据之间有关联,离散表示没有关联
二、numpy
作用:处理数据
1.读取:loadtxt
np.loadtxt(frame,dtype=np.float,delimiter=None,skiprows=0,usecols=None,unpack=False)
fname:文件名(路径)
dtype:数据类型(可选"int")
delimiter:分隔字符串(可用",")
skiprows:跳过前x行
usecols:读取指定列
unpack:读入相同属性分别写入不同数组变量
2.转置(交换轴)、计算
(1)x.transpose() 或者 x.T
def np_go():
    t2=np.arange(24).reshape((4,6))
    print(t2)
    print("*"*50)
    print(t2.T)
(2)x.swapaxes(b,a)
def np_go():
    t2=np.arange(24).reshape((4,6))
    print(t2)
    print("*"*50)
    print(t2.swapaxes(1,0))#原本轴为(0,1)
(3)axis
def np_go():
    t2=np.arange(24).reshape((4,6))
    print(t2)
    print("*"*50)
    print(np.sum(t2,axis=1))# axis=0压成一行, axis=1压成一列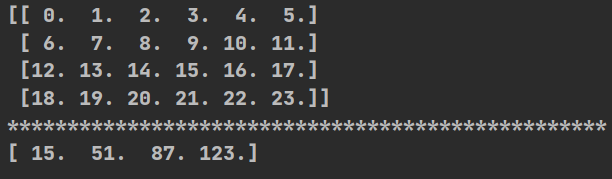
3.索引、切片
(1)取行
import numpy as np
def np_go():
    t2=np.arange(24).reshape((4,6))
    print(t2)
    print("*"*50)
    #取单行
    print("单行:\n",t2[2,:])
    #取多行
    print("多行:\n",t2[2:,:])
    #取不连续的多行
    print("不连续的多行:\n",t2[[0,2],:])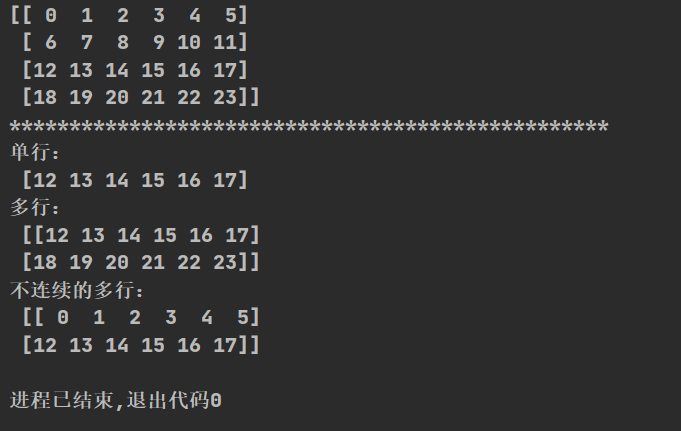
(2)取点
import numpy as np
def np_go():
    t2=np.arange(24).reshape((4,6))
    print(t2)
    print("*"*50)
    #取多点
    print("点:\n",t2[[0,1,2],[1,2,3]])#相当于取(0,1),(1,2),(2,3)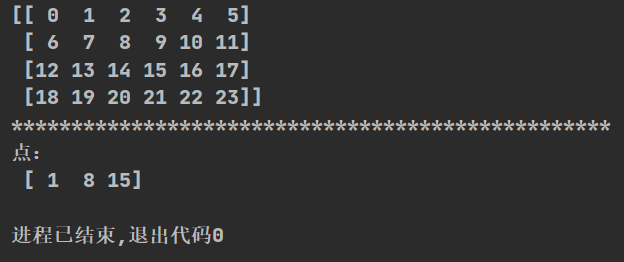
4.数值修改
(1)t2[t2<10]
import numpy as np
def np_go():
    t2=np.arange(24).reshape((4,6))
    print(t2)
    print("*"*50)
    print(t2<10)#输出为bool值
    print("*" * 50)
    t2[t2<10]=3#将bool为true的部分全改为3
    print(t2)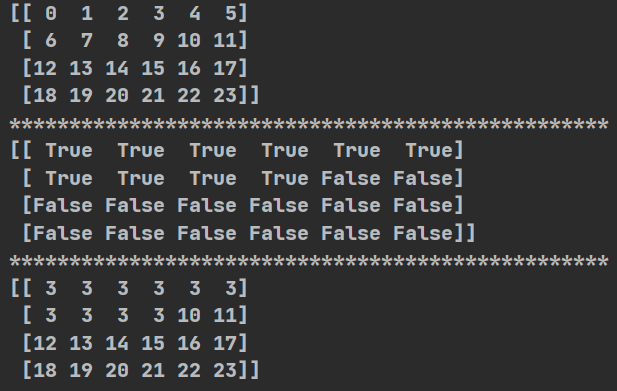
(2)np.where() :三元运算符
import numpy as np
def np_go():
    t2=np.arange(24).reshape((4,6))
    print(t2)
    print("*"*50)
    print(np.where(t2<=10,100,300))#np.where(判断条件,符合则改为的值,不符合则改为的值)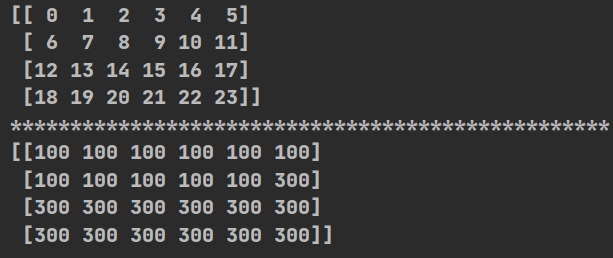
(3)x.clip():裁剪
import numpy as np
def np_go():
    t2=np.arange(24).reshape((4,6))
    print(t2)
    print("*"*50)
    print(t2.clip(10,18))#生成新数组,将原数组小于10的改为10,大于18的改为18
(4)x.astype(float):修改类型
t2=np.arange(24).reshape((4,6)).astype(float)5.numpy中的nan
(1)nan: not a number; inf: infinity(无穷)
(2)两个nan不相等
(3)判断nan原因:因为缺失值,数据要进行预处理
(4)nan与任何计算均为nan
import numpy as np
def np_go():
    t2=np.arange(24).reshape((4,6)).astype(float)
    t2[1, 2] = np.nan
    print(t2)
    print("*"*50)
    #因为缺失值,数据要预处理
    a=np.isnan(t2)
    print(a)
    print("nan的数量为:",np.count_nonzero(a))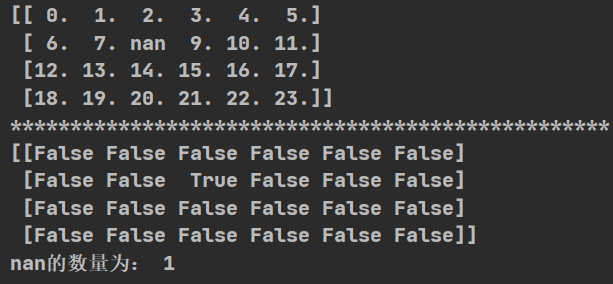
(5)实际例子
import numpy as np
def np_go():
    #创造所需数据集
    t2=np.arange(24).reshape((4,6)).astype(float)
    t2[1, 2:] = np.nan
    print(t2)
    print("*"*50)
    return(t2)

def clear_nan(t):
    for i in range(t.shape[1]):#遍历每一列
        temp=t[:,i]#查看当前列
        nan_num=np.count_nonzero(np.isnan(temp))#获取当前列nan的数量
        if nan_num!=0:#数量不为0,说明这一列有nan
            temp_not_nan=temp[temp==temp]#将不为nan的进行数组传参
            temp[np.isnan(temp)]=temp_not_nan.mean()#均值赋予nan的点
    return(t)

if __name__ == '__main__':

print(clear_nan(np_go())) 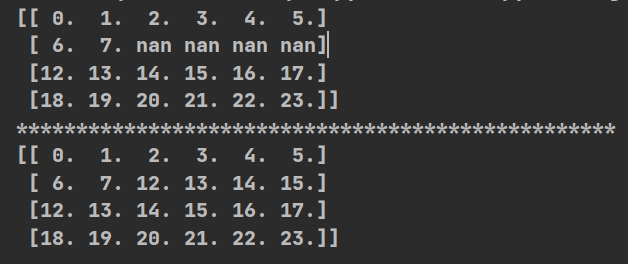
6.数组拼接
(1)竖直水平拼接
import numpy as np
def pinjie():
    t1 = np.arange(0,12).reshape((2, 6))
    t2 = np.arange(12,24).reshape((2, 6))
    print(t1)
    print(t2)
    print("*"*25+"竖直拼接"+"*"*25)
    print(np.vstack((t1,t2)))
    print("*"*25+"水平拼接"+"*"*25)
    print(np.hstack((t1,t2)))
(2)行列交换
import numpy as np
def jiaohuan():
    t = np.arange(24).reshape((4,6 ))
    print(t)
    print("*"*25+"行交换"+"*"*25)
    t[[1, 2], :] = t[[2, 1], :]
    print(t)
    print("*"*25+"列交换"+"*"*25)
    t[:,[0,2]]=t[:,[2,0]]
print(t) 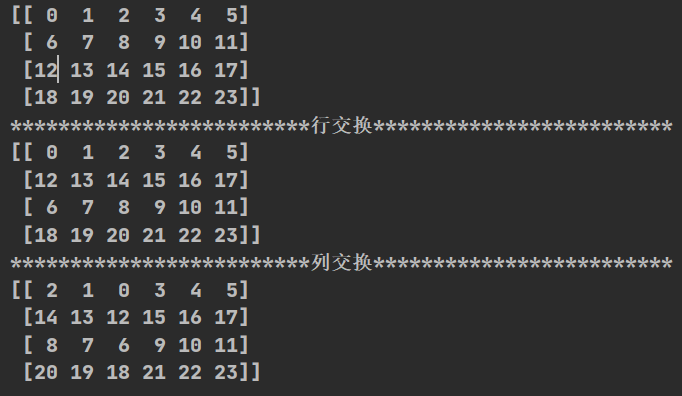
7.其他方法
(1)获取最大最小值的位置
np.argmax(x,axis=0)
np.argmin(x,axis=1)
(2)直接创建数组
全0:np.zeros((3,4))
全1:np.ones((3,4))
(3)对角线全为1的正方形数组
np.eye(10)
(4)随机数
np.random.randint(low,high,(shape)):范围low-high,为shape样式的数组
三、pandas
作用:处理复杂组合的数据,大多数函数使用方法与numpy一致,对有nan的数值计算时pandas会自动屏蔽nan
1.Series
(1)一维、带标签数组
import pandas as pd
def pds():
    t=pd.Series([1,23,3,54,5],index=list("abcde"))
    print(t)
(2)与numpy一致的方法修改属性
import pandas as pd
def pds():
    t=pd.Series([1,23,3,54,5],index=list("abcde"))
    print("原:",t.dtype)
    print(t)
    print("*"*25+"变换"+"*"*25)
    t=t.astype(float)
    print("改:",t.dtype)
    print(t)
(3)切片和索引
import pandas as pd
def pds():
    t=pd.Series([1,23,3,54,5],index=list("abcde"))
    print(t)
    print("*"*25+"变换"+"*"*25)
    #通过索引和位置(与numpy一致)都可以得到值
    print(t["a"])
    print(t[1])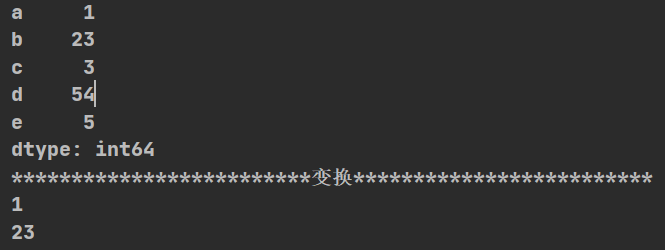
(4)属性
import pandas as pd
def pds():
    t=pd.Series([1,23,3,54,5],index=list("abcde"))
    print(t)
    print("*"*25+"变换"+"*"*25)
    #获取索引和值
    print(t.index)
print(t.values) 
(5)读取外部数据
pd.read_csv();pd.read_sql()
2.DataFrame
DataFrame是Series容器
(1)属性
colums:列
index:行
import pandas as pd
def df():
    t=pd.DataFrame(np.arange(12).reshape(3,4),index=list("abc"),columns=list("XYZW"))
    print(t)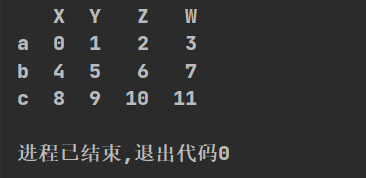
(2)对字典、列表的转换
import pandas as pd
def zidian():
    d={"name":["a","b"],"age":[20,30],"tel":[123,321]}#字典
    print(type(d))
    t=pd.DataFrame(d)#通过pd.DataFrame()直接转化,列表[{},{},{}]也是同样的方法
    print(t)
    print(type(t))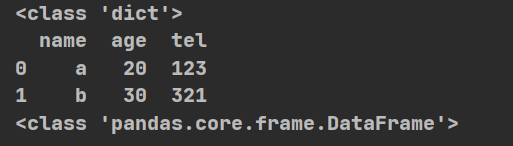
(3)遍历筛选所需要的内容
#先遍历,取出想要的值放进一个小字典,再把这个小字典存入list
def get_want_data(data):
# data为进行筛选的初始列表
data_list = []
for i in data:
temp={}#暂时存放
temp["info"]=i["info"]# i为从初始获取的一行列表数据
temp["title"]=i["title"]# 索引为所需要的属性
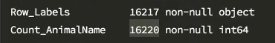
data_list.append(temp) (4)其它

补充:x.info()可以判断数据是否存在nan(如下图info的信息中,二者不相等则证明存在nan)
(5)排序
df=x.sort_values(by="列索引名",ascending=False): x数据按列索引名倒序排列
(6)取行取列
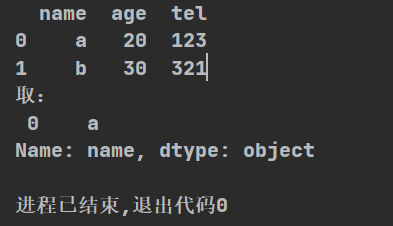
import pandas as pd
def zidian():
    d={"name":["a","b"],"age":[20,30],"tel":[123,321]}
    t=pd.DataFrame(d)
    print(t)
    print("取:\n",t[:1]["name"])#当列为有命名的索引时写入字符串
(7)loc、iloc获取数据
import numpy as np
import pandas as pd
def df():
    t=pd.DataFrame(np.arange(12).reshape(3,4),index=list("abc"),columns=list("XYZW"))
    print(t)
    print("*" * 25 + "取值" + "*" * 25)
    print(t.loc[["a","c"],:])#某两个不连续的行
    print("*" * 25 + "取值2" + "*" * 25)
    print(t.loc["a":"c",:])#某行到某行(冒号在loc里面是闭合的)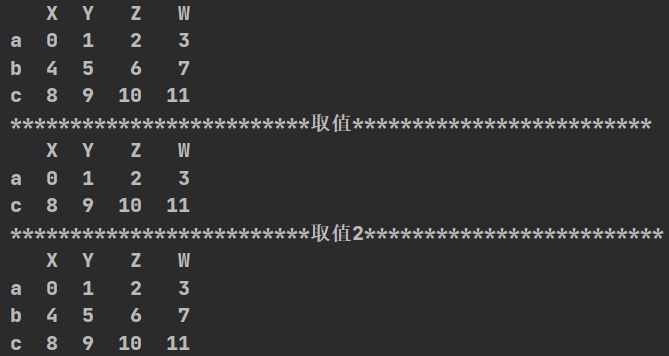
import pandas as pd
def df():
    t=pd.DataFrame(np.arange(12).reshape(3,4),index=list("abc"),columns=list("XYZW"))
    print(t)
    print("*" * 25 + "取值" + "*" * 25)
print(t.iloc[0,:])#iloc通过位置取数据 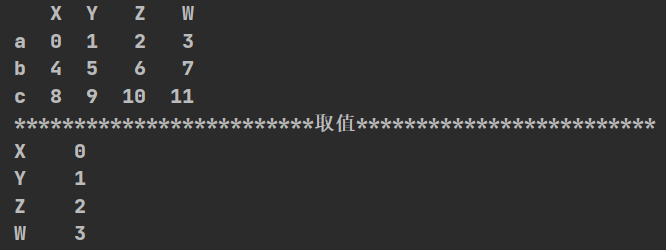
(8)bool索引
import pandas as pd
def df():
    t=pd.DataFrame(np.arange(12).reshape(3,4),index=list("abc"),columns=list("XYZW"))
    print(t)
    print("*" * 25 + "取值" + "*" * 25)
    print(t[t["W"]>6])#bool索引取值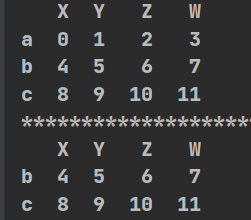
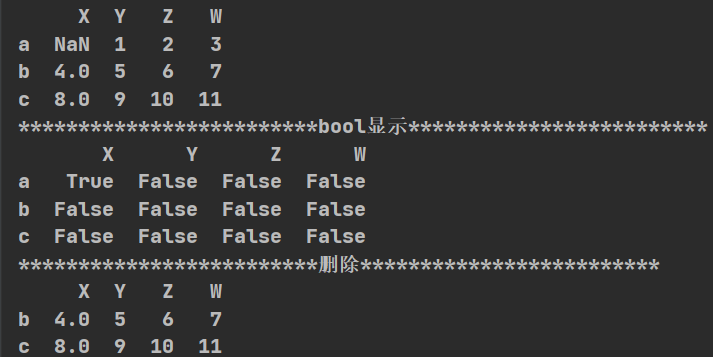
(9)缺失数据处理-删除、填充
import pandas as pd
import numpy as np
def df():
    t=pd.DataFrame(np.arange(12).reshape(3,4),index=list("abc"),columns=list("XYZW"))
    t.loc["a","X"]=np.nan
    print(t)

    print("*"*25+"bool显示"+"*"*25)
    print(pd.isnull(t))#bool值显示是否为nan

    print("*"*25+"删除"+"*"*25)
    t.dropna(axis=0, how="any", inplace=True)
    print(t)
    #how="all":全为nan则进行删除;how="any":有一个为nan则进行删除
    # inplace=True:就地处决,直接修改原变量的值
import pandas as pd
import numpy as np
def df():
    t=pd.DataFrame(np.arange(12).reshape(3,4),index=list("abc"),columns=list("XYZW"))
    t.loc["a","X"]=np.nan
    print(t)

    print("*"*25+"填充"+"*"*25)
    t["X"]=t["X"].fillna(t["X"].mean())#某一列的填充
print(t) 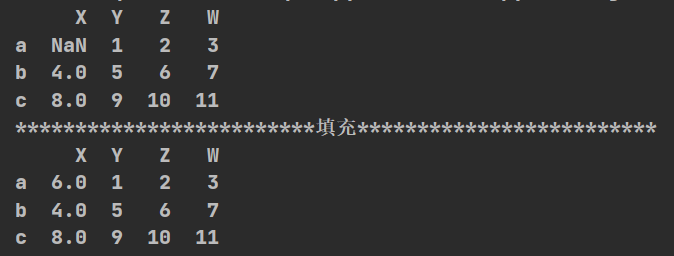


 2649
2649

 被折叠的 条评论
为什么被折叠?
被折叠的 条评论
为什么被折叠?
 到【灌水乐园】发言


